

Key Insights
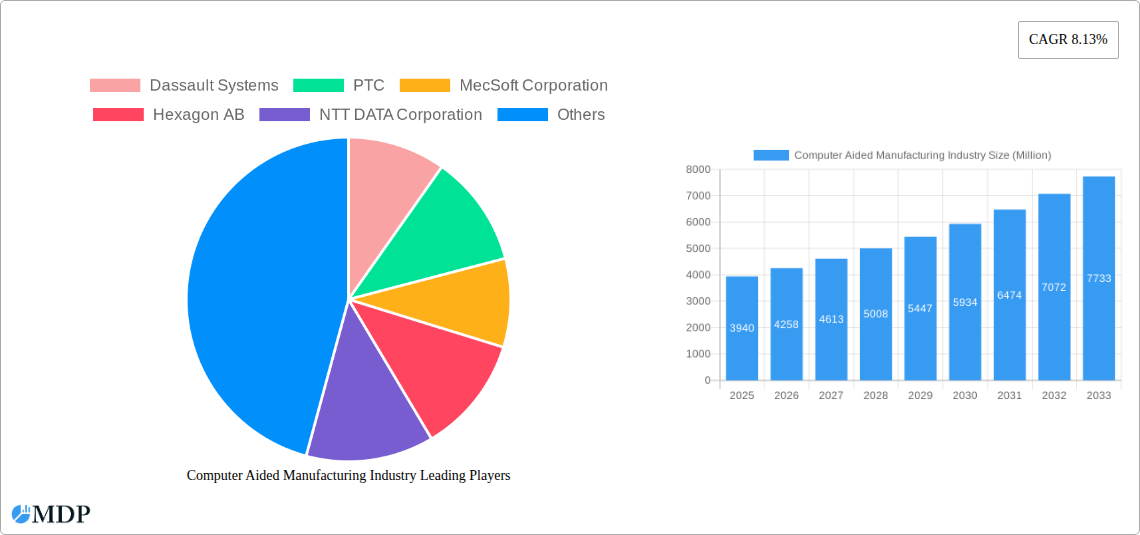
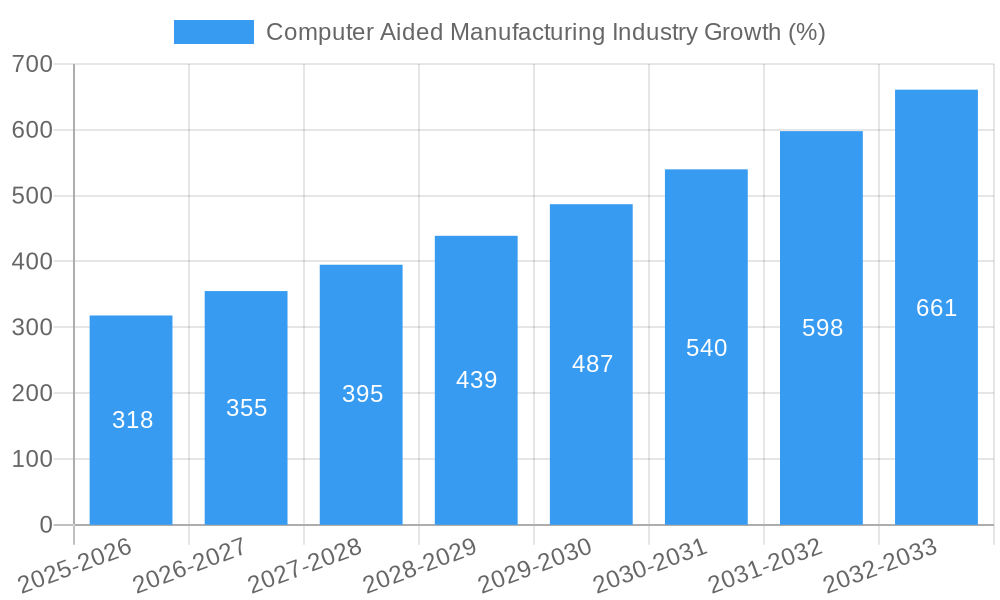
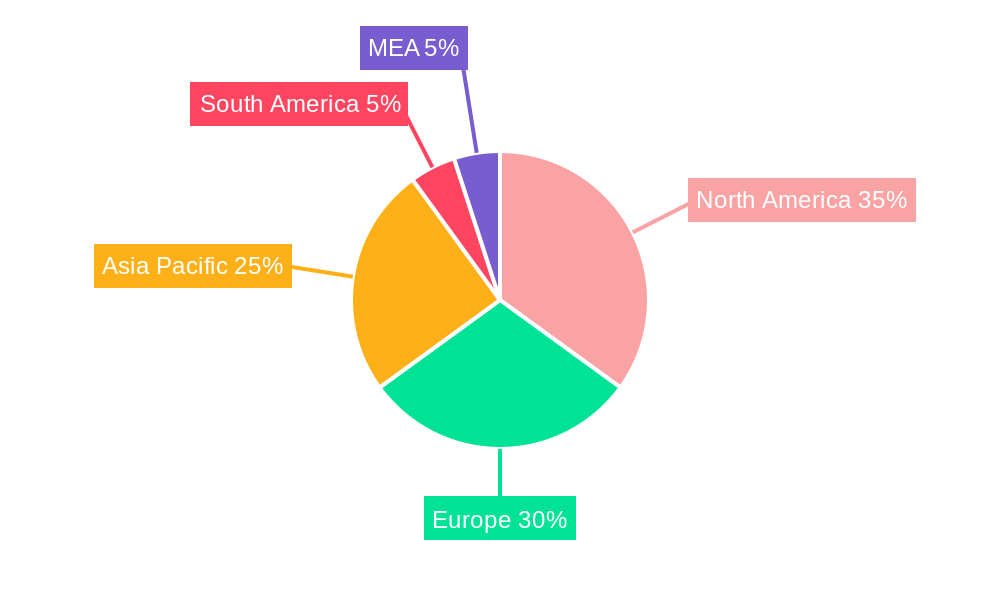
The Computer Aided Manufacturing (CAM) industry is experiencing robust growth, projected to reach a market size of $3.94 billion in 2025, expanding at a compound annual growth rate (CAGR) of 8.13%. This growth is fueled by several key drivers. Increasing automation needs across diverse sectors like aerospace & defense, automotive, and medical devices are significantly boosting the adoption of CAM software and solutions. The trend towards Industry 4.0 and the digitalization of manufacturing processes further fuels this demand, enabling enhanced efficiency, reduced production costs, and improved product quality. Advancements in technologies such as artificial intelligence (AI) and machine learning (ML) are also integrating into CAM software, offering predictive maintenance capabilities and optimized production planning. While challenges such as the initial high investment cost for implementing CAM systems and the requirement for skilled labor can act as restraints, the long-term benefits of improved productivity and reduced errors outweigh these concerns, contributing to the overall market expansion. The market is segmented by end-user industries, with aerospace & defense and automotive likely holding significant shares due to their high dependence on precision manufacturing and complex designs. North America and Europe are expected to dominate the market initially, given their established manufacturing base and higher adoption rates of advanced technologies. However, the Asia-Pacific region is projected to witness rapid growth due to increasing industrialization and manufacturing activities in countries like China and India. Competition is fierce among key players such as Dassault Systèmes, PTC, Autodesk, and Siemens, with smaller specialized firms catering to niche applications. The forecast period of 2025-2033 promises continued expansion, driven by ongoing technological innovation and the increasing adoption of CAM across various industries globally.
The competitive landscape is characterized by a mix of large multinational corporations offering comprehensive CAM solutions and smaller, specialized companies focusing on specific industry niches or software functionalities. This diverse landscape fosters innovation and caters to the varied needs of different manufacturers. The future success of CAM vendors hinges on their ability to adapt to emerging technologies like AI and cloud computing, provide robust customer support, and deliver solutions that seamlessly integrate into existing manufacturing ecosystems. Continued expansion into new geographic markets, particularly in developing economies, will also be crucial for maintaining growth momentum. The industry is expected to witness further consolidation through mergers and acquisitions as larger companies seek to expand their market share and product portfolios. The long-term outlook for the CAM industry remains positive, reflecting the continuous demand for enhanced manufacturing efficiency and precision across a broad spectrum of industrial sectors.
Computer Aided Manufacturing (CAM) Industry Report: 2019-2033
This comprehensive report provides an in-depth analysis of the Computer Aided Manufacturing (CAM) industry, offering valuable insights for stakeholders across the value chain. Covering the period from 2019 to 2033, with a focus on 2025, this report examines market dynamics, leading players, technological advancements, and future growth opportunities. The report utilizes data from diverse sources, including company financials, industry publications, and expert interviews, to provide a robust and accurate market assessment. Total market revenue is predicted to reach xx Million USD by 2033.
Computer Aided Manufacturing Industry Market Dynamics & Concentration
The Computer Aided Manufacturing (CAM) market is characterized by a moderately concentrated landscape, with several major players holding significant market share. Market concentration is influenced by factors such as technological innovation, regulatory compliance, and strategic mergers and acquisitions (M&A). The industry exhibits strong innovation drivers, including the integration of artificial intelligence (AI), the Internet of Things (IoT), and advanced simulation technologies. Stringent regulatory frameworks related to safety and environmental standards impact industry practices and operational costs. The emergence of additive manufacturing (3D printing) presents a significant product substitute, albeit with its own limitations. End-user trends, such as the increasing demand for customized products and shorter lead times, drive innovation and market expansion.
- Market Share: The top 5 players hold approximately xx% of the global market share in 2025.
- M&A Activity: The historical period (2019-2024) witnessed approximately xx M&A deals, primarily focused on expanding technological capabilities and market reach. This trend is expected to continue in the forecast period.
- Innovation Drivers: AI-powered CAM software, cloud-based solutions, and digital twin technologies are reshaping the industry.
- Regulatory Frameworks: Compliance with industry-specific safety and environmental regulations remains a key challenge and factor influencing market dynamics.
Computer Aided Manufacturing Industry Industry Trends & Analysis
The CAM industry is experiencing robust growth, driven by several key trends. The increasing adoption of Industry 4.0 technologies, such as AI and IoT, is transforming manufacturing processes, leading to increased efficiency and productivity. The demand for customized products and shorter product lifecycles further fuels the adoption of CAM solutions, enabling greater flexibility and agility. The growing complexity of products and the need for precise manufacturing techniques contribute to the market's expansion. Competitive dynamics are intensified by continuous innovation and strategic partnerships between CAM software providers and hardware manufacturers. The global CAM market is expected to exhibit a Compound Annual Growth Rate (CAGR) of xx% during the forecast period (2025-2033), with significant market penetration in key end-user industries.
Leading Markets & Segments in Computer Aided Manufacturing Industry
The Aerospace & Defense segment currently dominates the CAM market, driven by the stringent requirements for precision and quality in aircraft and defense system manufacturing. The automotive industry is another significant segment, with high demand for CAM solutions for tooling, part design, and production optimization.
- Aerospace & Defense: Revenue in 2025: xx Million USD; Market Share: xx%
- Key Drivers: Stringent quality standards, complex geometries, high precision requirements.
- Automotive: Revenue in 2025: xx Million USD; Market Share: xx%
- Key Drivers: High production volumes, need for automation, design complexity.
- Medical: Revenue in 2025: xx Million USD; Market Share: xx%
- Key Drivers: Precision requirements, need for biocompatibility, regulatory compliance.
- Energy & Utilities: Revenue in 2025: xx Million USD; Market Share: xx%
- Key Drivers: Automation of processes, improved efficiency, cost reduction.
- Other End-User Industries: Revenue in 2025: xx Million USD; Market Share: xx%
The North American region holds a significant market share, driven by factors such as technological advancements and the presence of major CAM software providers. Government initiatives promoting advanced manufacturing further contribute to market growth.
Computer Aided Manufacturing Industry Product Developments
Recent product developments focus on integrating AI, machine learning, and cloud technologies into CAM software. This leads to enhanced simulation capabilities, automated process planning, and improved efficiency. Manufacturers are incorporating features like real-time data analytics and predictive maintenance to optimize production processes and reduce downtime. The market is also witnessing the rise of CAM solutions tailored to specific industries, offering specialized features and functionalities to meet unique requirements.
Key Drivers of Computer Aided Manufacturing Industry Growth
The CAM market's growth is propelled by technological advancements, favorable economic conditions, and supportive regulatory frameworks. The increasing adoption of Industry 4.0 technologies, particularly AI and IoT, significantly enhances efficiency and productivity. Government initiatives promoting advanced manufacturing and automation create favorable market conditions. Furthermore, the growing demand for customized products and faster production cycles drives the need for sophisticated CAM solutions.
Challenges in the Computer Aided Manufacturing Industry Market
The CAM market faces challenges such as the high initial investment costs associated with implementing CAM systems, which can be a barrier for smaller companies. Integration complexities and the need for skilled personnel also pose challenges. Furthermore, intense competition among vendors and the constant evolution of technology necessitate continuous investment in research and development. Supply chain disruptions can also cause significant production delays and increased costs.
Emerging Opportunities in Computer Aided Manufacturing Industry
The CAM industry presents numerous growth opportunities. The increasing adoption of additive manufacturing (3D printing) opens up possibilities for customized and complex part production. Strategic partnerships between CAM software providers and hardware manufacturers create synergistic opportunities. Expanding into emerging markets with growing manufacturing sectors offers significant potential for market expansion. Advancements in AI and machine learning will further improve CAM software capabilities, opening up new applications and market segments.
Leading Players in the Computer Aided Manufacturing Industry Sector
- Dassault Systèmes
- PTC
- MecSoft Corporation
- Hexagon AB
- NTT DATA Corporation
- Siemens AG
- SolidCAM Ltd
- OPEN MIND Technologies AG
- Autodesk Inc
- 3D Systems Inc
- BobCAD-CAM
- SmartCAMcnc
- ZWSOFTCO LTD (Guangzhou)
- HCL Technologies Limited
- CNC Software LLC (Mastercam)
Key Milestones in Computer Aided Manufacturing Industry Industry
- November 2023: Microlight3D launched Luminis software, a CAM software for microFAB-3D, enabling 3D printing of objects 100x smaller than a hair strand, with 3D visualization capturing 40-60 fps data. This significantly expands the capabilities of micro-manufacturing.
- May 2023: NVIDIA introduced NVIDIA Omniverse, connecting CAD apps, APIs, and AI frameworks, enabling virtual factory creation and digitalized manufacturing workflows, improving quality, safety, and reducing delays. This represents a significant step towards digital transformation in manufacturing.
Strategic Outlook for Computer Aided Manufacturing Industry Market
The CAM market is poised for continued growth, driven by technological advancements, increased automation, and the growing demand for customized products. Strategic partnerships, investments in R&D, and expansion into emerging markets will be crucial for success. Companies focusing on AI-powered solutions, cloud-based platforms, and industry-specific applications are expected to gain a competitive edge. The long-term outlook remains positive, with significant potential for market expansion and innovation.
Computer Aided Manufacturing Industry Segmentation
-
1. Deployment Model
- 1.1. On-Premises
- 1.2. Cloud-Based
-
2. End-User Industry
- 2.1. Aerospace & Defense
- 2.2. Automotive
- 2.3. Medical
- 2.4. Energy & Utilities
- 2.5. Other End-User Industries
Computer Aided Manufacturing Industry Segmentation By Geography
-
1. North America
- 1.1. United States
- 1.2. Canada
-
2. Europe
- 2.1. Germany
- 2.2. Switzerland
- 2.3. Spain
- 2.4. Austria
- 2.5. Belgium
- 2.6. Netherlands
- 2.7. United Kingdom
- 2.8. France
- 2.9. Italy
- 2.10. Sweden
- 2.11. Poland
-
3. Asia
- 3.1. China
- 3.2. Japan
- 3.3. South Korea
- 3.4. India
- 4. Australia and New Zealand
-
5. Latin America
- 5.1. Brazil
- 5.2. Mexico
-
6. Middle East and Africa
- 6.1. United Arab Emirates
- 6.2. Saudi Arabia
- 6.3. South Africa
Computer Aided Manufacturing Industry REPORT HIGHLIGHTS
| Aspects | Details |
|---|---|
| Study Period | 2019-2033 |
| Base Year | 2024 |
| Estimated Year | 2025 |
| Forecast Period | 2025-2033 |
| Historical Period | 2019-2024 |
| Growth Rate | CAGR of 8.13% from 2019-2033 |
| Segmentation |
|
Table of Contents
- 1. Introduction
- 1.1. Research Scope
- 1.2. Market Segmentation
- 1.3. Research Methodology
- 1.4. Definitions and Assumptions
- 2. Executive Summary
- 2.1. Introduction
- 3. Market Dynamics
- 3.1. Introduction
- 3.2. Market Drivers
- 3.2.1. Increasing Adoption of Industry 4.; Growing Utilization of CAM Software in the Packaging Machinery Sector
- 3.3. Market Restrains
- 3.3.1. Wide Availability of Open Source CAM Software
- 3.4. Market Trends
- 3.4.1. Automotive is Expected to Hold a Major Market Share
- 4. Market Factor Analysis
- 4.1. Porters Five Forces
- 4.2. Supply/Value Chain
- 4.3. PESTEL analysis
- 4.4. Market Entropy
- 4.5. Patent/Trademark Analysis
- 5. Global Computer Aided Manufacturing Industry Analysis, Insights and Forecast, 2019-2031
- 5.1. Market Analysis, Insights and Forecast - by Deployment Model
- 5.1.1. On-Premises
- 5.1.2. Cloud-Based
- 5.2. Market Analysis, Insights and Forecast - by End-User Industry
- 5.2.1. Aerospace & Defense
- 5.2.2. Automotive
- 5.2.3. Medical
- 5.2.4. Energy & Utilities
- 5.2.5. Other End-User Industries
- 5.3. Market Analysis, Insights and Forecast - by Region
- 5.3.1. North America
- 5.3.2. Europe
- 5.3.3. Asia
- 5.3.4. Australia and New Zealand
- 5.3.5. Latin America
- 5.3.6. Middle East and Africa
- 5.1. Market Analysis, Insights and Forecast - by Deployment Model
- 6. North America Computer Aided Manufacturing Industry Analysis, Insights and Forecast, 2019-2031
- 6.1. Market Analysis, Insights and Forecast - by Deployment Model
- 6.1.1. On-Premises
- 6.1.2. Cloud-Based
- 6.2. Market Analysis, Insights and Forecast - by End-User Industry
- 6.2.1. Aerospace & Defense
- 6.2.2. Automotive
- 6.2.3. Medical
- 6.2.4. Energy & Utilities
- 6.2.5. Other End-User Industries
- 6.1. Market Analysis, Insights and Forecast - by Deployment Model
- 7. Europe Computer Aided Manufacturing Industry Analysis, Insights and Forecast, 2019-2031
- 7.1. Market Analysis, Insights and Forecast - by Deployment Model
- 7.1.1. On-Premises
- 7.1.2. Cloud-Based
- 7.2. Market Analysis, Insights and Forecast - by End-User Industry
- 7.2.1. Aerospace & Defense
- 7.2.2. Automotive
- 7.2.3. Medical
- 7.2.4. Energy & Utilities
- 7.2.5. Other End-User Industries
- 7.1. Market Analysis, Insights and Forecast - by Deployment Model
- 8. Asia Computer Aided Manufacturing Industry Analysis, Insights and Forecast, 2019-2031
- 8.1. Market Analysis, Insights and Forecast - by Deployment Model
- 8.1.1. On-Premises
- 8.1.2. Cloud-Based
- 8.2. Market Analysis, Insights and Forecast - by End-User Industry
- 8.2.1. Aerospace & Defense
- 8.2.2. Automotive
- 8.2.3. Medical
- 8.2.4. Energy & Utilities
- 8.2.5. Other End-User Industries
- 8.1. Market Analysis, Insights and Forecast - by Deployment Model
- 9. Australia and New Zealand Computer Aided Manufacturing Industry Analysis, Insights and Forecast, 2019-2031
- 9.1. Market Analysis, Insights and Forecast - by Deployment Model
- 9.1.1. On-Premises
- 9.1.2. Cloud-Based
- 9.2. Market Analysis, Insights and Forecast - by End-User Industry
- 9.2.1. Aerospace & Defense
- 9.2.2. Automotive
- 9.2.3. Medical
- 9.2.4. Energy & Utilities
- 9.2.5. Other End-User Industries
- 9.1. Market Analysis, Insights and Forecast - by Deployment Model
- 10. Latin America Computer Aided Manufacturing Industry Analysis, Insights and Forecast, 2019-2031
- 10.1. Market Analysis, Insights and Forecast - by Deployment Model
- 10.1.1. On-Premises
- 10.1.2. Cloud-Based
- 10.2. Market Analysis, Insights and Forecast - by End-User Industry
- 10.2.1. Aerospace & Defense
- 10.2.2. Automotive
- 10.2.3. Medical
- 10.2.4. Energy & Utilities
- 10.2.5. Other End-User Industries
- 10.1. Market Analysis, Insights and Forecast - by Deployment Model
- 11. Middle East and Africa Computer Aided Manufacturing Industry Analysis, Insights and Forecast, 2019-2031
- 11.1. Market Analysis, Insights and Forecast - by Deployment Model
- 11.1.1. On-Premises
- 11.1.2. Cloud-Based
- 11.2. Market Analysis, Insights and Forecast - by End-User Industry
- 11.2.1. Aerospace & Defense
- 11.2.2. Automotive
- 11.2.3. Medical
- 11.2.4. Energy & Utilities
- 11.2.5. Other End-User Industries
- 11.1. Market Analysis, Insights and Forecast - by Deployment Model
- 12. North America Computer Aided Manufacturing Industry Analysis, Insights and Forecast, 2019-2031
- 12.1. Market Analysis, Insights and Forecast - By Country/Sub-region
- 12.1.1 United States
- 12.1.2 Canada
- 12.1.3 Mexico
- 13. Europe Computer Aided Manufacturing Industry Analysis, Insights and Forecast, 2019-2031
- 13.1. Market Analysis, Insights and Forecast - By Country/Sub-region
- 13.1.1 Germany
- 13.1.2 United Kingdom
- 13.1.3 France
- 13.1.4 Spain
- 13.1.5 Italy
- 13.1.6 Spain
- 13.1.7 Belgium
- 13.1.8 Netherland
- 13.1.9 Nordics
- 13.1.10 Rest of Europe
- 14. Asia Pacific Computer Aided Manufacturing Industry Analysis, Insights and Forecast, 2019-2031
- 14.1. Market Analysis, Insights and Forecast - By Country/Sub-region
- 14.1.1 China
- 14.1.2 Japan
- 14.1.3 India
- 14.1.4 South Korea
- 14.1.5 Southeast Asia
- 14.1.6 Australia
- 14.1.7 Indonesia
- 14.1.8 Phillipes
- 14.1.9 Singapore
- 14.1.10 Thailandc
- 14.1.11 Rest of Asia Pacific
- 15. South America Computer Aided Manufacturing Industry Analysis, Insights and Forecast, 2019-2031
- 15.1. Market Analysis, Insights and Forecast - By Country/Sub-region
- 15.1.1 Brazil
- 15.1.2 Argentina
- 15.1.3 Peru
- 15.1.4 Chile
- 15.1.5 Colombia
- 15.1.6 Ecuador
- 15.1.7 Venezuela
- 15.1.8 Rest of South America
- 16. North America Computer Aided Manufacturing Industry Analysis, Insights and Forecast, 2019-2031
- 16.1. Market Analysis, Insights and Forecast - By Country/Sub-region
- 16.1.1 United States
- 16.1.2 Canada
- 16.1.3 Mexico
- 17. MEA Computer Aided Manufacturing Industry Analysis, Insights and Forecast, 2019-2031
- 17.1. Market Analysis, Insights and Forecast - By Country/Sub-region
- 17.1.1 United Arab Emirates
- 17.1.2 Saudi Arabia
- 17.1.3 South Africa
- 17.1.4 Rest of Middle East and Africa
- 18. Competitive Analysis
- 18.1. Global Market Share Analysis 2024
- 18.2. Company Profiles
- 18.2.1 Dassault Systems
- 18.2.1.1. Overview
- 18.2.1.2. Products
- 18.2.1.3. SWOT Analysis
- 18.2.1.4. Recent Developments
- 18.2.1.5. Financials (Based on Availability)
- 18.2.2 PTC
- 18.2.2.1. Overview
- 18.2.2.2. Products
- 18.2.2.3. SWOT Analysis
- 18.2.2.4. Recent Developments
- 18.2.2.5. Financials (Based on Availability)
- 18.2.3 MecSoft Corporation
- 18.2.3.1. Overview
- 18.2.3.2. Products
- 18.2.3.3. SWOT Analysis
- 18.2.3.4. Recent Developments
- 18.2.3.5. Financials (Based on Availability)
- 18.2.4 Hexagon AB
- 18.2.4.1. Overview
- 18.2.4.2. Products
- 18.2.4.3. SWOT Analysis
- 18.2.4.4. Recent Developments
- 18.2.4.5. Financials (Based on Availability)
- 18.2.5 NTT DATA Corporation
- 18.2.5.1. Overview
- 18.2.5.2. Products
- 18.2.5.3. SWOT Analysis
- 18.2.5.4. Recent Developments
- 18.2.5.5. Financials (Based on Availability)
- 18.2.6 Siemens AG
- 18.2.6.1. Overview
- 18.2.6.2. Products
- 18.2.6.3. SWOT Analysis
- 18.2.6.4. Recent Developments
- 18.2.6.5. Financials (Based on Availability)
- 18.2.7 SolidCAM Ltd
- 18.2.7.1. Overview
- 18.2.7.2. Products
- 18.2.7.3. SWOT Analysis
- 18.2.7.4. Recent Developments
- 18.2.7.5. Financials (Based on Availability)
- 18.2.8 OPEN MIND Technologies AG
- 18.2.8.1. Overview
- 18.2.8.2. Products
- 18.2.8.3. SWOT Analysis
- 18.2.8.4. Recent Developments
- 18.2.8.5. Financials (Based on Availability)
- 18.2.9 Autodesk Inc
- 18.2.9.1. Overview
- 18.2.9.2. Products
- 18.2.9.3. SWOT Analysis
- 18.2.9.4. Recent Developments
- 18.2.9.5. Financials (Based on Availability)
- 18.2.10 3D Systems Inc
- 18.2.10.1. Overview
- 18.2.10.2. Products
- 18.2.10.3. SWOT Analysis
- 18.2.10.4. Recent Developments
- 18.2.10.5. Financials (Based on Availability)
- 18.2.11 BobCAD-CAM
- 18.2.11.1. Overview
- 18.2.11.2. Products
- 18.2.11.3. SWOT Analysis
- 18.2.11.4. Recent Developments
- 18.2.11.5. Financials (Based on Availability)
- 18.2.12 SmartCAMcnc
- 18.2.12.1. Overview
- 18.2.12.2. Products
- 18.2.12.3. SWOT Analysis
- 18.2.12.4. Recent Developments
- 18.2.12.5. Financials (Based on Availability)
- 18.2.13 ZWSOFTCO LTD (Guangzhou)
- 18.2.13.1. Overview
- 18.2.13.2. Products
- 18.2.13.3. SWOT Analysis
- 18.2.13.4. Recent Developments
- 18.2.13.5. Financials (Based on Availability)
- 18.2.14 HCL Technologies Limited
- 18.2.14.1. Overview
- 18.2.14.2. Products
- 18.2.14.3. SWOT Analysis
- 18.2.14.4. Recent Developments
- 18.2.14.5. Financials (Based on Availability)
- 18.2.15 CNC Software LLC (Mastercam)
- 18.2.15.1. Overview
- 18.2.15.2. Products
- 18.2.15.3. SWOT Analysis
- 18.2.15.4. Recent Developments
- 18.2.15.5. Financials (Based on Availability)
- 18.2.1 Dassault Systems
List of Figures
- Figure 1: Global Computer Aided Manufacturing Industry Revenue Breakdown (Million, %) by Region 2024 & 2032
- Figure 2: North America Computer Aided Manufacturing Industry Revenue (Million), by Country 2024 & 2032
- Figure 3: North America Computer Aided Manufacturing Industry Revenue Share (%), by Country 2024 & 2032
- Figure 4: Europe Computer Aided Manufacturing Industry Revenue (Million), by Country 2024 & 2032
- Figure 5: Europe Computer Aided Manufacturing Industry Revenue Share (%), by Country 2024 & 2032
- Figure 6: Asia Pacific Computer Aided Manufacturing Industry Revenue (Million), by Country 2024 & 2032
- Figure 7: Asia Pacific Computer Aided Manufacturing Industry Revenue Share (%), by Country 2024 & 2032
- Figure 8: South America Computer Aided Manufacturing Industry Revenue (Million), by Country 2024 & 2032
- Figure 9: South America Computer Aided Manufacturing Industry Revenue Share (%), by Country 2024 & 2032
- Figure 10: North America Computer Aided Manufacturing Industry Revenue (Million), by Country 2024 & 2032
- Figure 11: North America Computer Aided Manufacturing Industry Revenue Share (%), by Country 2024 & 2032
- Figure 12: MEA Computer Aided Manufacturing Industry Revenue (Million), by Country 2024 & 2032
- Figure 13: MEA Computer Aided Manufacturing Industry Revenue Share (%), by Country 2024 & 2032
- Figure 14: North America Computer Aided Manufacturing Industry Revenue (Million), by Deployment Model 2024 & 2032
- Figure 15: North America Computer Aided Manufacturing Industry Revenue Share (%), by Deployment Model 2024 & 2032
- Figure 16: North America Computer Aided Manufacturing Industry Revenue (Million), by End-User Industry 2024 & 2032
- Figure 17: North America Computer Aided Manufacturing Industry Revenue Share (%), by End-User Industry 2024 & 2032
- Figure 18: North America Computer Aided Manufacturing Industry Revenue (Million), by Country 2024 & 2032
- Figure 19: North America Computer Aided Manufacturing Industry Revenue Share (%), by Country 2024 & 2032
- Figure 20: Europe Computer Aided Manufacturing Industry Revenue (Million), by Deployment Model 2024 & 2032
- Figure 21: Europe Computer Aided Manufacturing Industry Revenue Share (%), by Deployment Model 2024 & 2032
- Figure 22: Europe Computer Aided Manufacturing Industry Revenue (Million), by End-User Industry 2024 & 2032
- Figure 23: Europe Computer Aided Manufacturing Industry Revenue Share (%), by End-User Industry 2024 & 2032
- Figure 24: Europe Computer Aided Manufacturing Industry Revenue (Million), by Country 2024 & 2032
- Figure 25: Europe Computer Aided Manufacturing Industry Revenue Share (%), by Country 2024 & 2032
- Figure 26: Asia Computer Aided Manufacturing Industry Revenue (Million), by Deployment Model 2024 & 2032
- Figure 27: Asia Computer Aided Manufacturing Industry Revenue Share (%), by Deployment Model 2024 & 2032
- Figure 28: Asia Computer Aided Manufacturing Industry Revenue (Million), by End-User Industry 2024 & 2032
- Figure 29: Asia Computer Aided Manufacturing Industry Revenue Share (%), by End-User Industry 2024 & 2032
- Figure 30: Asia Computer Aided Manufacturing Industry Revenue (Million), by Country 2024 & 2032
- Figure 31: Asia Computer Aided Manufacturing Industry Revenue Share (%), by Country 2024 & 2032
- Figure 32: Australia and New Zealand Computer Aided Manufacturing Industry Revenue (Million), by Deployment Model 2024 & 2032
- Figure 33: Australia and New Zealand Computer Aided Manufacturing Industry Revenue Share (%), by Deployment Model 2024 & 2032
- Figure 34: Australia and New Zealand Computer Aided Manufacturing Industry Revenue (Million), by End-User Industry 2024 & 2032
- Figure 35: Australia and New Zealand Computer Aided Manufacturing Industry Revenue Share (%), by End-User Industry 2024 & 2032
- Figure 36: Australia and New Zealand Computer Aided Manufacturing Industry Revenue (Million), by Country 2024 & 2032
- Figure 37: Australia and New Zealand Computer Aided Manufacturing Industry Revenue Share (%), by Country 2024 & 2032
- Figure 38: Latin America Computer Aided Manufacturing Industry Revenue (Million), by Deployment Model 2024 & 2032
- Figure 39: Latin America Computer Aided Manufacturing Industry Revenue Share (%), by Deployment Model 2024 & 2032
- Figure 40: Latin America Computer Aided Manufacturing Industry Revenue (Million), by End-User Industry 2024 & 2032
- Figure 41: Latin America Computer Aided Manufacturing Industry Revenue Share (%), by End-User Industry 2024 & 2032
- Figure 42: Latin America Computer Aided Manufacturing Industry Revenue (Million), by Country 2024 & 2032
- Figure 43: Latin America Computer Aided Manufacturing Industry Revenue Share (%), by Country 2024 & 2032
- Figure 44: Middle East and Africa Computer Aided Manufacturing Industry Revenue (Million), by Deployment Model 2024 & 2032
- Figure 45: Middle East and Africa Computer Aided Manufacturing Industry Revenue Share (%), by Deployment Model 2024 & 2032
- Figure 46: Middle East and Africa Computer Aided Manufacturing Industry Revenue (Million), by End-User Industry 2024 & 2032
- Figure 47: Middle East and Africa Computer Aided Manufacturing Industry Revenue Share (%), by End-User Industry 2024 & 2032
- Figure 48: Middle East and Africa Computer Aided Manufacturing Industry Revenue (Million), by Country 2024 & 2032
- Figure 49: Middle East and Africa Computer Aided Manufacturing Industry Revenue Share (%), by Country 2024 & 2032
List of Tables
- Table 1: Global Computer Aided Manufacturing Industry Revenue Million Forecast, by Region 2019 & 2032
- Table 2: Global Computer Aided Manufacturing Industry Revenue Million Forecast, by Deployment Model 2019 & 2032
- Table 3: Global Computer Aided Manufacturing Industry Revenue Million Forecast, by End-User Industry 2019 & 2032
- Table 4: Global Computer Aided Manufacturing Industry Revenue Million Forecast, by Region 2019 & 2032
- Table 5: Global Computer Aided Manufacturing Industry Revenue Million Forecast, by Country 2019 & 2032
- Table 6: United States Computer Aided Manufacturing Industry Revenue (Million) Forecast, by Application 2019 & 2032
- Table 7: Canada Computer Aided Manufacturing Industry Revenue (Million) Forecast, by Application 2019 & 2032
- Table 8: Mexico Computer Aided Manufacturing Industry Revenue (Million) Forecast, by Application 2019 & 2032
- Table 9: Global Computer Aided Manufacturing Industry Revenue Million Forecast, by Country 2019 & 2032
- Table 10: Germany Computer Aided Manufacturing Industry Revenue (Million) Forecast, by Application 2019 & 2032
- Table 11: United Kingdom Computer Aided Manufacturing Industry Revenue (Million) Forecast, by Application 2019 & 2032
- Table 12: France Computer Aided Manufacturing Industry Revenue (Million) Forecast, by Application 2019 & 2032
- Table 13: Spain Computer Aided Manufacturing Industry Revenue (Million) Forecast, by Application 2019 & 2032
- Table 14: Italy Computer Aided Manufacturing Industry Revenue (Million) Forecast, by Application 2019 & 2032
- Table 15: Spain Computer Aided Manufacturing Industry Revenue (Million) Forecast, by Application 2019 & 2032
- Table 16: Belgium Computer Aided Manufacturing Industry Revenue (Million) Forecast, by Application 2019 & 2032
- Table 17: Netherland Computer Aided Manufacturing Industry Revenue (Million) Forecast, by Application 2019 & 2032
- Table 18: Nordics Computer Aided Manufacturing Industry Revenue (Million) Forecast, by Application 2019 & 2032
- Table 19: Rest of Europe Computer Aided Manufacturing Industry Revenue (Million) Forecast, by Application 2019 & 2032
- Table 20: Global Computer Aided Manufacturing Industry Revenue Million Forecast, by Country 2019 & 2032
- Table 21: China Computer Aided Manufacturing Industry Revenue (Million) Forecast, by Application 2019 & 2032
- Table 22: Japan Computer Aided Manufacturing Industry Revenue (Million) Forecast, by Application 2019 & 2032
- Table 23: India Computer Aided Manufacturing Industry Revenue (Million) Forecast, by Application 2019 & 2032
- Table 24: South Korea Computer Aided Manufacturing Industry Revenue (Million) Forecast, by Application 2019 & 2032
- Table 25: Southeast Asia Computer Aided Manufacturing Industry Revenue (Million) Forecast, by Application 2019 & 2032
- Table 26: Australia Computer Aided Manufacturing Industry Revenue (Million) Forecast, by Application 2019 & 2032
- Table 27: Indonesia Computer Aided Manufacturing Industry Revenue (Million) Forecast, by Application 2019 & 2032
- Table 28: Phillipes Computer Aided Manufacturing Industry Revenue (Million) Forecast, by Application 2019 & 2032
- Table 29: Singapore Computer Aided Manufacturing Industry Revenue (Million) Forecast, by Application 2019 & 2032
- Table 30: Thailandc Computer Aided Manufacturing Industry Revenue (Million) Forecast, by Application 2019 & 2032
- Table 31: Rest of Asia Pacific Computer Aided Manufacturing Industry Revenue (Million) Forecast, by Application 2019 & 2032
- Table 32: Global Computer Aided Manufacturing Industry Revenue Million Forecast, by Country 2019 & 2032
- Table 33: Brazil Computer Aided Manufacturing Industry Revenue (Million) Forecast, by Application 2019 & 2032
- Table 34: Argentina Computer Aided Manufacturing Industry Revenue (Million) Forecast, by Application 2019 & 2032
- Table 35: Peru Computer Aided Manufacturing Industry Revenue (Million) Forecast, by Application 2019 & 2032
- Table 36: Chile Computer Aided Manufacturing Industry Revenue (Million) Forecast, by Application 2019 & 2032
- Table 37: Colombia Computer Aided Manufacturing Industry Revenue (Million) Forecast, by Application 2019 & 2032
- Table 38: Ecuador Computer Aided Manufacturing Industry Revenue (Million) Forecast, by Application 2019 & 2032
- Table 39: Venezuela Computer Aided Manufacturing Industry Revenue (Million) Forecast, by Application 2019 & 2032
- Table 40: Rest of South America Computer Aided Manufacturing Industry Revenue (Million) Forecast, by Application 2019 & 2032
- Table 41: Global Computer Aided Manufacturing Industry Revenue Million Forecast, by Country 2019 & 2032
- Table 42: United States Computer Aided Manufacturing Industry Revenue (Million) Forecast, by Application 2019 & 2032
- Table 43: Canada Computer Aided Manufacturing Industry Revenue (Million) Forecast, by Application 2019 & 2032
- Table 44: Mexico Computer Aided Manufacturing Industry Revenue (Million) Forecast, by Application 2019 & 2032
- Table 45: Global Computer Aided Manufacturing Industry Revenue Million Forecast, by Country 2019 & 2032
- Table 46: United Arab Emirates Computer Aided Manufacturing Industry Revenue (Million) Forecast, by Application 2019 & 2032
- Table 47: Saudi Arabia Computer Aided Manufacturing Industry Revenue (Million) Forecast, by Application 2019 & 2032
- Table 48: South Africa Computer Aided Manufacturing Industry Revenue (Million) Forecast, by Application 2019 & 2032
- Table 49: Rest of Middle East and Africa Computer Aided Manufacturing Industry Revenue (Million) Forecast, by Application 2019 & 2032
- Table 50: Global Computer Aided Manufacturing Industry Revenue Million Forecast, by Deployment Model 2019 & 2032
- Table 51: Global Computer Aided Manufacturing Industry Revenue Million Forecast, by End-User Industry 2019 & 2032
- Table 52: Global Computer Aided Manufacturing Industry Revenue Million Forecast, by Country 2019 & 2032
- Table 53: United States Computer Aided Manufacturing Industry Revenue (Million) Forecast, by Application 2019 & 2032
- Table 54: Canada Computer Aided Manufacturing Industry Revenue (Million) Forecast, by Application 2019 & 2032
- Table 55: Global Computer Aided Manufacturing Industry Revenue Million Forecast, by Deployment Model 2019 & 2032
- Table 56: Global Computer Aided Manufacturing Industry Revenue Million Forecast, by End-User Industry 2019 & 2032
- Table 57: Global Computer Aided Manufacturing Industry Revenue Million Forecast, by Country 2019 & 2032
- Table 58: Germany Computer Aided Manufacturing Industry Revenue (Million) Forecast, by Application 2019 & 2032
- Table 59: Switzerland Computer Aided Manufacturing Industry Revenue (Million) Forecast, by Application 2019 & 2032
- Table 60: Spain Computer Aided Manufacturing Industry Revenue (Million) Forecast, by Application 2019 & 2032
- Table 61: Austria Computer Aided Manufacturing Industry Revenue (Million) Forecast, by Application 2019 & 2032
- Table 62: Belgium Computer Aided Manufacturing Industry Revenue (Million) Forecast, by Application 2019 & 2032
- Table 63: Netherlands Computer Aided Manufacturing Industry Revenue (Million) Forecast, by Application 2019 & 2032
- Table 64: United Kingdom Computer Aided Manufacturing Industry Revenue (Million) Forecast, by Application 2019 & 2032
- Table 65: France Computer Aided Manufacturing Industry Revenue (Million) Forecast, by Application 2019 & 2032
- Table 66: Italy Computer Aided Manufacturing Industry Revenue (Million) Forecast, by Application 2019 & 2032
- Table 67: Sweden Computer Aided Manufacturing Industry Revenue (Million) Forecast, by Application 2019 & 2032
- Table 68: Poland Computer Aided Manufacturing Industry Revenue (Million) Forecast, by Application 2019 & 2032
- Table 69: Global Computer Aided Manufacturing Industry Revenue Million Forecast, by Deployment Model 2019 & 2032
- Table 70: Global Computer Aided Manufacturing Industry Revenue Million Forecast, by End-User Industry 2019 & 2032
- Table 71: Global Computer Aided Manufacturing Industry Revenue Million Forecast, by Country 2019 & 2032
- Table 72: China Computer Aided Manufacturing Industry Revenue (Million) Forecast, by Application 2019 & 2032
- Table 73: Japan Computer Aided Manufacturing Industry Revenue (Million) Forecast, by Application 2019 & 2032
- Table 74: South Korea Computer Aided Manufacturing Industry Revenue (Million) Forecast, by Application 2019 & 2032
- Table 75: India Computer Aided Manufacturing Industry Revenue (Million) Forecast, by Application 2019 & 2032
- Table 76: Global Computer Aided Manufacturing Industry Revenue Million Forecast, by Deployment Model 2019 & 2032
- Table 77: Global Computer Aided Manufacturing Industry Revenue Million Forecast, by End-User Industry 2019 & 2032
- Table 78: Global Computer Aided Manufacturing Industry Revenue Million Forecast, by Country 2019 & 2032
- Table 79: Global Computer Aided Manufacturing Industry Revenue Million Forecast, by Deployment Model 2019 & 2032
- Table 80: Global Computer Aided Manufacturing Industry Revenue Million Forecast, by End-User Industry 2019 & 2032
- Table 81: Global Computer Aided Manufacturing Industry Revenue Million Forecast, by Country 2019 & 2032
- Table 82: Brazil Computer Aided Manufacturing Industry Revenue (Million) Forecast, by Application 2019 & 2032
- Table 83: Mexico Computer Aided Manufacturing Industry Revenue (Million) Forecast, by Application 2019 & 2032
- Table 84: Global Computer Aided Manufacturing Industry Revenue Million Forecast, by Deployment Model 2019 & 2032
- Table 85: Global Computer Aided Manufacturing Industry Revenue Million Forecast, by End-User Industry 2019 & 2032
- Table 86: Global Computer Aided Manufacturing Industry Revenue Million Forecast, by Country 2019 & 2032
- Table 87: United Arab Emirates Computer Aided Manufacturing Industry Revenue (Million) Forecast, by Application 2019 & 2032
- Table 88: Saudi Arabia Computer Aided Manufacturing Industry Revenue (Million) Forecast, by Application 2019 & 2032
- Table 89: South Africa Computer Aided Manufacturing Industry Revenue (Million) Forecast, by Application 2019 & 2032
Frequently Asked Questions
1. What is the projected Compound Annual Growth Rate (CAGR) of the Computer Aided Manufacturing Industry?
The projected CAGR is approximately 8.13%.
2. Which companies are prominent players in the Computer Aided Manufacturing Industry?
Key companies in the market include Dassault Systems, PTC, MecSoft Corporation, Hexagon AB, NTT DATA Corporation, Siemens AG, SolidCAM Ltd, OPEN MIND Technologies AG, Autodesk Inc, 3D Systems Inc, BobCAD-CAM, SmartCAMcnc , ZWSOFTCO LTD (Guangzhou), HCL Technologies Limited, CNC Software LLC (Mastercam).
3. What are the main segments of the Computer Aided Manufacturing Industry?
The market segments include Deployment Model, End-User Industry.
4. Can you provide details about the market size?
The market size is estimated to be USD 3.94 Million as of 2022.
5. What are some drivers contributing to market growth?
Increasing Adoption of Industry 4.; Growing Utilization of CAM Software in the Packaging Machinery Sector.
6. What are the notable trends driving market growth?
Automotive is Expected to Hold a Major Market Share.
7. Are there any restraints impacting market growth?
Wide Availability of Open Source CAM Software.
8. Can you provide examples of recent developments in the market?
November 2023 - Microlight3D launched Luminis software, a computer-aided manufacturing (CAM) software built explicitly for the microFAB-3D. Luminis combines the ability to prepare objects for printing and control the printer, aiding to 3D print objects to 100× smaller than a strand of hair. Luminis features 3D visualization for the capturing of 40 fps - 60 fps data under the same load. The software enables printing prototypes of technologies used in micro-robotics, microfluidics, micro-optics, and cell culture and tissue engineering.
9. What pricing options are available for accessing the report?
Pricing options include single-user, multi-user, and enterprise licenses priced at USD 4750, USD 5250, and USD 8750 respectively.
10. Is the market size provided in terms of value or volume?
The market size is provided in terms of value, measured in Million.
11. Are there any specific market keywords associated with the report?
Yes, the market keyword associated with the report is "Computer Aided Manufacturing Industry," which aids in identifying and referencing the specific market segment covered.
12. How do I determine which pricing option suits my needs best?
The pricing options vary based on user requirements and access needs. Individual users may opt for single-user licenses, while businesses requiring broader access may choose multi-user or enterprise licenses for cost-effective access to the report.
13. Are there any additional resources or data provided in the Computer Aided Manufacturing Industry report?
While the report offers comprehensive insights, it's advisable to review the specific contents or supplementary materials provided to ascertain if additional resources or data are available.
14. How can I stay updated on further developments or reports in the Computer Aided Manufacturing Industry?
To stay informed about further developments, trends, and reports in the Computer Aided Manufacturing Industry, consider subscribing to industry newsletters, following relevant companies and organizations, or regularly checking reputable industry news sources and publications.
Methodology
Step 1 - Identification of Relevant Samples Size from Population Database


Step 2 - Approaches for Defining Global Market Size (Value, Volume* & Price*)

Note*: In applicable scenarios
Step 3 - Data Sources
Primary Research
- Web Analytics
- Survey Reports
- Research Institute
- Latest Research Reports
- Opinion Leaders
Secondary Research
- Annual Reports
- White Paper
- Latest Press Release
- Industry Association
- Paid Database
- Investor Presentations

Step 4 - Data Triangulation
Involves using different sources of information in order to increase the validity of a study
These sources are likely to be stakeholders in a program - participants, other researchers, program staff, other community members, and so on.
Then we put all data in single framework & apply various statistical tools to find out the dynamic on the market.
During the analysis stage, feedback from the stakeholder groups would be compared to determine areas of agreement as well as areas of divergence
