

Key Insights
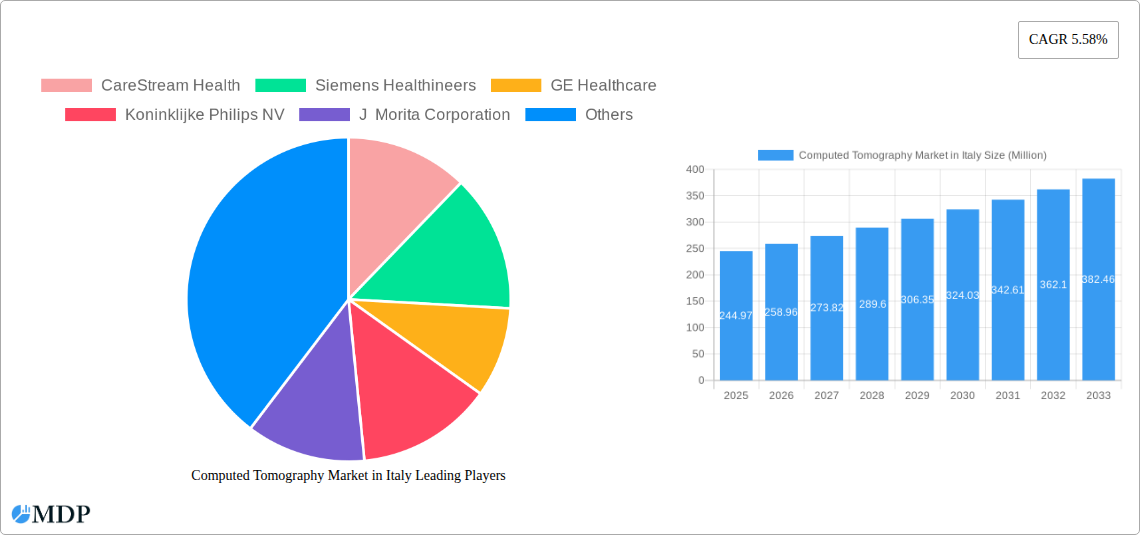
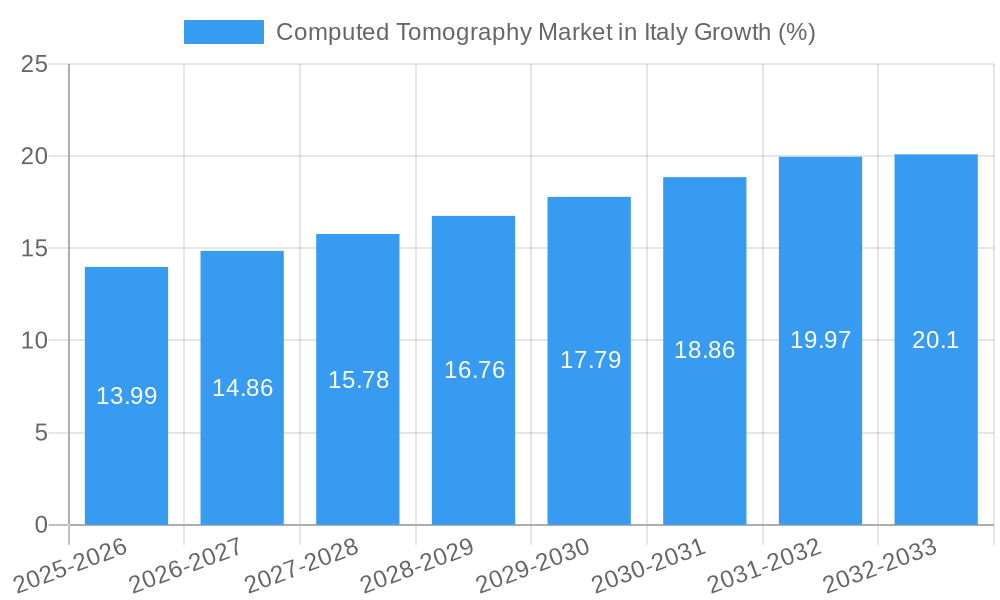
The Italian Computed Tomography (CT) market, valued at €244.97 million in 2025, is projected to experience robust growth, driven by a Compound Annual Growth Rate (CAGR) of 5.58% from 2025 to 2033. This expansion is fueled by several key factors. Technological advancements leading to faster scan times, improved image quality, and reduced radiation exposure are significantly increasing the adoption of CT scans across various medical specialties. The rising prevalence of chronic diseases such as cardiovascular diseases, cancer, and neurological disorders necessitates increased diagnostic imaging procedures, further bolstering market demand. Furthermore, the growing number of hospitals and diagnostic centers, coupled with increasing government initiatives to improve healthcare infrastructure, contribute to the market's positive trajectory. The market segmentation reveals a significant share held by high-slice CT scanners, reflecting a preference for advanced technology offering superior image resolution and diagnostic capabilities. Oncology remains the leading application segment, followed by neurology and cardiology, indicating the vital role of CT in diagnosing and managing these critical health conditions. While the market faces challenges such as high initial investment costs for CT scanners and potential regulatory hurdles, the overall growth outlook remains optimistic, driven by the aforementioned factors.
The competitive landscape is characterized by the presence of both global and regional players, including industry giants like CareStream Health, Siemens Healthineers, GE Healthcare, Koninklijke Philips NV, and others. These companies are engaged in intense competition, focusing on technological innovation, strategic partnerships, and expansion of their product portfolios to capture a larger market share. The strategic focus on offering comprehensive solutions, including advanced image processing software and service contracts, contributes to the overall market growth. The Italian market is likely to witness further consolidation in the coming years, with companies focusing on mergers and acquisitions to expand their market presence and enhance their product offerings. The continued focus on improving healthcare accessibility and affordability will play a key role in shaping the future trajectory of the Italian CT market.
Computed Tomography (CT) Market in Italy: A Comprehensive Report (2019-2033)
This in-depth report provides a comprehensive analysis of the Computed Tomography (CT) market in Italy, offering invaluable insights for industry stakeholders, investors, and market strategists. The study covers the period from 2019 to 2033, with a focus on the estimated year 2025 and a forecast period of 2025-2033. The report leverages a wealth of data to illuminate market dynamics, technological advancements, and competitive landscapes, enabling informed decision-making. Key market segments analyzed include Type (Low Slice, Medium Slice, High Slice), Application (Oncology, Neurology, Cardiovascular, Musculoskeletal, Other Applications), and End User (Hospitals, Diagnostic Centers, Other End Users). Leading players such as CareStream Health, Siemens Healthineers, GE Healthcare, Koninklijke Philips NV, J Morita Corporation, Canon Medical Systems Corporation, and Fujifilm Holdings Corporation are thoroughly examined.
Computed Tomography Market in Italy Market Dynamics & Concentration
The Italian CT market is characterized by a moderately concentrated landscape, with a few major players holding significant market share. The market share of the top three players is estimated at xx% in 2025. Innovation is a key driver, with ongoing advancements in technology leading to higher resolution imaging, faster scan times, and reduced radiation dose. The regulatory framework, primarily governed by the Italian Ministry of Health, plays a significant role in shaping market dynamics, including approvals for new technologies and reimbursement policies. Product substitutes, such as MRI and ultrasound, present competitive pressure, while the increasing prevalence of chronic diseases is driving demand for CT scans. End-user trends reflect a shift towards advanced imaging modalities and a preference for minimally invasive procedures. M&A activity in the Italian CT market has been relatively moderate in recent years, with approximately xx deals recorded between 2019 and 2024.
- Market Concentration: Top 3 players hold xx% market share (2025 estimate).
- Innovation Drivers: Higher resolution, faster scan times, reduced radiation dose.
- Regulatory Framework: Primarily governed by the Italian Ministry of Health.
- Product Substitutes: MRI, Ultrasound.
- End-user trends: Preference for advanced imaging and minimally invasive procedures.
- M&A Activity: Approximately xx deals between 2019-2024.
Computed Tomography Market in Italy Industry Trends & Analysis
The Italian CT market is projected to experience a CAGR of xx% during the forecast period (2025-2033), driven by factors such as the rising prevalence of chronic diseases, an aging population, increasing healthcare expenditure, and technological advancements. Technological disruptions, particularly the adoption of AI-powered imaging and photon-counting CT, are transforming the industry. Consumer preferences are shifting towards faster, more accurate, and less invasive diagnostic procedures. The competitive landscape is marked by intense rivalry among established players and the emergence of new entrants with innovative technologies. Market penetration of advanced CT technologies remains relatively low, offering significant growth potential.
Leading Markets & Segments in Computed Tomography Market in Italy
The Hospitals segment dominates the end-user landscape, accounting for the largest share of the market in 2025. Within applications, Oncology and Cardiovascular applications hold significant market share due to the high prevalence of related diseases in Italy. High-slice CT scanners are gaining traction owing to their superior image quality and diagnostic capabilities. The Northern region of Italy demonstrates higher market penetration compared to other regions due to higher healthcare infrastructure and spending.
- Dominant Segment (2025): Hospitals (End User), Oncology & Cardiovascular (Application), High Slice (Type).
- Key Drivers:
- High Prevalence of Chronic Diseases: Cardiovascular diseases, cancer.
- Aging Population: Increasing demand for diagnostic imaging services.
- Healthcare Infrastructure: Well-established healthcare system in Northern Italy.
- Government Initiatives: Funding and support for healthcare advancements.
Computed Tomography Market in Italy Product Developments
Recent product innovations focus on improving image quality, reducing radiation exposure, and incorporating AI-powered functionalities. The launch of photon-counting CT scanners represents a significant technological leap, enhancing diagnostic accuracy and efficiency. These advancements are enhancing the competitive advantage of leading manufacturers by catering to the growing demand for advanced imaging solutions and improving patient outcomes.
Key Drivers of Computed Tomography Market in Italy Growth
Several factors are driving the growth of the CT market in Italy. These include the rising prevalence of chronic diseases necessitating advanced diagnostic tools, increasing healthcare expenditure, growing adoption of technologically advanced CT systems offering better image quality and reduced radiation doses, and favorable government regulations promoting healthcare infrastructure development. These factors collectively contribute to a robust market outlook.
Challenges in the Computed Tomography Market in Italy Market
Challenges include high initial investment costs associated with advanced CT systems, stringent regulatory approvals, potential reimbursement constraints impacting affordability, and the competitive pressure from established and emerging players. These factors, along with supply chain disruptions, may pose some limitations to market expansion.
Emerging Opportunities in Computed Tomography Market in Italy
The market presents significant opportunities for growth. The increasing adoption of AI and machine learning in CT imaging is expected to drive innovation. Strategic partnerships between technology providers and healthcare institutions, along with market expansion strategies targeting underserved regions, will play a key role in future growth. Furthermore, the development of specialized CT applications for specific disease areas offers significant potential.
Leading Players in the Computed Tomography Market in Italy Sector
- CareStream Health
- Siemens Healthineers
- GE Healthcare
- Koninklijke Philips NV
- J Morita Corporation
- Canon Medical Systems Corporation
- Fujifilm Holdings Corporation
Key Milestones in Computed Tomography Market in Italy Industry
- November 2021: Siemens Healthineers launched Naeotom Alpha, the world's first photon-counting CT scanner in the United States and Europe. This significantly impacted the market by introducing a superior imaging technology.
- November 2021: Philips extended its AI-enabled CT imaging portfolio across European countries, including Italy. This broadened access to advanced imaging solutions.
Strategic Outlook for Computed Tomography Market in Italy Market
The Italian CT market is poised for substantial growth over the forecast period. The continued adoption of advanced technologies, strategic collaborations between manufacturers and healthcare providers, and government initiatives to modernize healthcare infrastructure will fuel market expansion. Companies focusing on innovation, strategic partnerships, and customer-centric solutions are well-positioned to capitalize on the substantial market potential.
Computed Tomography Market in Italy Segmentation
-
1. Type
- 1.1. Low Slice
- 1.2. Medium Slice
- 1.3. High Slice
-
2. Application
- 2.1. Oncology
- 2.2. Neurology
- 2.3. Cardiovascular
- 2.4. Musculoskeletal
- 2.5. Other Applications
-
3. End User
- 3.1. Hospitals
- 3.2. Diagnostic Centers
- 3.3. Other End Users
Computed Tomography Market in Italy Segmentation By Geography
-
1. North America
- 1.1. United States
- 1.2. Canada
- 1.3. Mexico
-
2. South America
- 2.1. Brazil
- 2.2. Argentina
- 2.3. Rest of South America
-
3. Europe
- 3.1. United Kingdom
- 3.2. Germany
- 3.3. France
- 3.4. Italy
- 3.5. Spain
- 3.6. Russia
- 3.7. Benelux
- 3.8. Nordics
- 3.9. Rest of Europe
-
4. Middle East & Africa
- 4.1. Turkey
- 4.2. Israel
- 4.3. GCC
- 4.4. North Africa
- 4.5. South Africa
- 4.6. Rest of Middle East & Africa
-
5. Asia Pacific
- 5.1. China
- 5.2. India
- 5.3. Japan
- 5.4. South Korea
- 5.5. ASEAN
- 5.6. Oceania
- 5.7. Rest of Asia Pacific
Computed Tomography Market in Italy REPORT HIGHLIGHTS
| Aspects | Details |
|---|---|
| Study Period | 2019-2033 |
| Base Year | 2024 |
| Estimated Year | 2025 |
| Forecast Period | 2025-2033 |
| Historical Period | 2019-2024 |
| Growth Rate | CAGR of 5.58% from 2019-2033 |
| Segmentation |
|
Table of Contents
- 1. Introduction
- 1.1. Research Scope
- 1.2. Market Segmentation
- 1.3. Research Methodology
- 1.4. Definitions and Assumptions
- 2. Executive Summary
- 2.1. Introduction
- 3. Market Dynamics
- 3.1. Introduction
- 3.2. Market Drivers
- 3.2.1. Increasing Geriatric Population and Chronic Disease Burden; Technological Advancements in Computed Tomography
- 3.3. Market Restrains
- 3.3.1. High Cost Associated With CT Scan Procedure and Equipment
- 3.4. Market Trends
- 3.4.1. Oncology Segment is Expected to Register Significant Growth Over the Forecast Period
- 4. Market Factor Analysis
- 4.1. Porters Five Forces
- 4.2. Supply/Value Chain
- 4.3. PESTEL analysis
- 4.4. Market Entropy
- 4.5. Patent/Trademark Analysis
- 5. Global Computed Tomography Market in Italy Analysis, Insights and Forecast, 2019-2031
- 5.1. Market Analysis, Insights and Forecast - by Type
- 5.1.1. Low Slice
- 5.1.2. Medium Slice
- 5.1.3. High Slice
- 5.2. Market Analysis, Insights and Forecast - by Application
- 5.2.1. Oncology
- 5.2.2. Neurology
- 5.2.3. Cardiovascular
- 5.2.4. Musculoskeletal
- 5.2.5. Other Applications
- 5.3. Market Analysis, Insights and Forecast - by End User
- 5.3.1. Hospitals
- 5.3.2. Diagnostic Centers
- 5.3.3. Other End Users
- 5.4. Market Analysis, Insights and Forecast - by Region
- 5.4.1. North America
- 5.4.2. South America
- 5.4.3. Europe
- 5.4.4. Middle East & Africa
- 5.4.5. Asia Pacific
- 5.1. Market Analysis, Insights and Forecast - by Type
- 6. North America Computed Tomography Market in Italy Analysis, Insights and Forecast, 2019-2031
- 6.1. Market Analysis, Insights and Forecast - by Type
- 6.1.1. Low Slice
- 6.1.2. Medium Slice
- 6.1.3. High Slice
- 6.2. Market Analysis, Insights and Forecast - by Application
- 6.2.1. Oncology
- 6.2.2. Neurology
- 6.2.3. Cardiovascular
- 6.2.4. Musculoskeletal
- 6.2.5. Other Applications
- 6.3. Market Analysis, Insights and Forecast - by End User
- 6.3.1. Hospitals
- 6.3.2. Diagnostic Centers
- 6.3.3. Other End Users
- 6.1. Market Analysis, Insights and Forecast - by Type
- 7. South America Computed Tomography Market in Italy Analysis, Insights and Forecast, 2019-2031
- 7.1. Market Analysis, Insights and Forecast - by Type
- 7.1.1. Low Slice
- 7.1.2. Medium Slice
- 7.1.3. High Slice
- 7.2. Market Analysis, Insights and Forecast - by Application
- 7.2.1. Oncology
- 7.2.2. Neurology
- 7.2.3. Cardiovascular
- 7.2.4. Musculoskeletal
- 7.2.5. Other Applications
- 7.3. Market Analysis, Insights and Forecast - by End User
- 7.3.1. Hospitals
- 7.3.2. Diagnostic Centers
- 7.3.3. Other End Users
- 7.1. Market Analysis, Insights and Forecast - by Type
- 8. Europe Computed Tomography Market in Italy Analysis, Insights and Forecast, 2019-2031
- 8.1. Market Analysis, Insights and Forecast - by Type
- 8.1.1. Low Slice
- 8.1.2. Medium Slice
- 8.1.3. High Slice
- 8.2. Market Analysis, Insights and Forecast - by Application
- 8.2.1. Oncology
- 8.2.2. Neurology
- 8.2.3. Cardiovascular
- 8.2.4. Musculoskeletal
- 8.2.5. Other Applications
- 8.3. Market Analysis, Insights and Forecast - by End User
- 8.3.1. Hospitals
- 8.3.2. Diagnostic Centers
- 8.3.3. Other End Users
- 8.1. Market Analysis, Insights and Forecast - by Type
- 9. Middle East & Africa Computed Tomography Market in Italy Analysis, Insights and Forecast, 2019-2031
- 9.1. Market Analysis, Insights and Forecast - by Type
- 9.1.1. Low Slice
- 9.1.2. Medium Slice
- 9.1.3. High Slice
- 9.2. Market Analysis, Insights and Forecast - by Application
- 9.2.1. Oncology
- 9.2.2. Neurology
- 9.2.3. Cardiovascular
- 9.2.4. Musculoskeletal
- 9.2.5. Other Applications
- 9.3. Market Analysis, Insights and Forecast - by End User
- 9.3.1. Hospitals
- 9.3.2. Diagnostic Centers
- 9.3.3. Other End Users
- 9.1. Market Analysis, Insights and Forecast - by Type
- 10. Asia Pacific Computed Tomography Market in Italy Analysis, Insights and Forecast, 2019-2031
- 10.1. Market Analysis, Insights and Forecast - by Type
- 10.1.1. Low Slice
- 10.1.2. Medium Slice
- 10.1.3. High Slice
- 10.2. Market Analysis, Insights and Forecast - by Application
- 10.2.1. Oncology
- 10.2.2. Neurology
- 10.2.3. Cardiovascular
- 10.2.4. Musculoskeletal
- 10.2.5. Other Applications
- 10.3. Market Analysis, Insights and Forecast - by End User
- 10.3.1. Hospitals
- 10.3.2. Diagnostic Centers
- 10.3.3. Other End Users
- 10.1. Market Analysis, Insights and Forecast - by Type
- 11. Competitive Analysis
- 11.1. Global Market Share Analysis 2024
- 11.2. Company Profiles
- 11.2.1 CareStream Health
- 11.2.1.1. Overview
- 11.2.1.2. Products
- 11.2.1.3. SWOT Analysis
- 11.2.1.4. Recent Developments
- 11.2.1.5. Financials (Based on Availability)
- 11.2.2 Siemens Healthineers
- 11.2.2.1. Overview
- 11.2.2.2. Products
- 11.2.2.3. SWOT Analysis
- 11.2.2.4. Recent Developments
- 11.2.2.5. Financials (Based on Availability)
- 11.2.3 GE Healthcare
- 11.2.3.1. Overview
- 11.2.3.2. Products
- 11.2.3.3. SWOT Analysis
- 11.2.3.4. Recent Developments
- 11.2.3.5. Financials (Based on Availability)
- 11.2.4 Koninklijke Philips NV
- 11.2.4.1. Overview
- 11.2.4.2. Products
- 11.2.4.3. SWOT Analysis
- 11.2.4.4. Recent Developments
- 11.2.4.5. Financials (Based on Availability)
- 11.2.5 J Morita Corporation
- 11.2.5.1. Overview
- 11.2.5.2. Products
- 11.2.5.3. SWOT Analysis
- 11.2.5.4. Recent Developments
- 11.2.5.5. Financials (Based on Availability)
- 11.2.6 Canon Medical Systems Corporation
- 11.2.6.1. Overview
- 11.2.6.2. Products
- 11.2.6.3. SWOT Analysis
- 11.2.6.4. Recent Developments
- 11.2.6.5. Financials (Based on Availability)
- 11.2.7 Fujifilm Holdings Corporation
- 11.2.7.1. Overview
- 11.2.7.2. Products
- 11.2.7.3. SWOT Analysis
- 11.2.7.4. Recent Developments
- 11.2.7.5. Financials (Based on Availability)
- 11.2.1 CareStream Health
List of Figures
- Figure 1: Global Computed Tomography Market in Italy Revenue Breakdown (Million, %) by Region 2024 & 2032
- Figure 2: Global Computed Tomography Market in Italy Volume Breakdown (Piece, %) by Region 2024 & 2032
- Figure 3: Italy Computed Tomography Market in Italy Revenue (Million), by Country 2024 & 2032
- Figure 4: Italy Computed Tomography Market in Italy Volume (Piece), by Country 2024 & 2032
- Figure 5: Italy Computed Tomography Market in Italy Revenue Share (%), by Country 2024 & 2032
- Figure 6: Italy Computed Tomography Market in Italy Volume Share (%), by Country 2024 & 2032
- Figure 7: North America Computed Tomography Market in Italy Revenue (Million), by Type 2024 & 2032
- Figure 8: North America Computed Tomography Market in Italy Volume (Piece), by Type 2024 & 2032
- Figure 9: North America Computed Tomography Market in Italy Revenue Share (%), by Type 2024 & 2032
- Figure 10: North America Computed Tomography Market in Italy Volume Share (%), by Type 2024 & 2032
- Figure 11: North America Computed Tomography Market in Italy Revenue (Million), by Application 2024 & 2032
- Figure 12: North America Computed Tomography Market in Italy Volume (Piece), by Application 2024 & 2032
- Figure 13: North America Computed Tomography Market in Italy Revenue Share (%), by Application 2024 & 2032
- Figure 14: North America Computed Tomography Market in Italy Volume Share (%), by Application 2024 & 2032
- Figure 15: North America Computed Tomography Market in Italy Revenue (Million), by End User 2024 & 2032
- Figure 16: North America Computed Tomography Market in Italy Volume (Piece), by End User 2024 & 2032
- Figure 17: North America Computed Tomography Market in Italy Revenue Share (%), by End User 2024 & 2032
- Figure 18: North America Computed Tomography Market in Italy Volume Share (%), by End User 2024 & 2032
- Figure 19: North America Computed Tomography Market in Italy Revenue (Million), by Country 2024 & 2032
- Figure 20: North America Computed Tomography Market in Italy Volume (Piece), by Country 2024 & 2032
- Figure 21: North America Computed Tomography Market in Italy Revenue Share (%), by Country 2024 & 2032
- Figure 22: North America Computed Tomography Market in Italy Volume Share (%), by Country 2024 & 2032
- Figure 23: South America Computed Tomography Market in Italy Revenue (Million), by Type 2024 & 2032
- Figure 24: South America Computed Tomography Market in Italy Volume (Piece), by Type 2024 & 2032
- Figure 25: South America Computed Tomography Market in Italy Revenue Share (%), by Type 2024 & 2032
- Figure 26: South America Computed Tomography Market in Italy Volume Share (%), by Type 2024 & 2032
- Figure 27: South America Computed Tomography Market in Italy Revenue (Million), by Application 2024 & 2032
- Figure 28: South America Computed Tomography Market in Italy Volume (Piece), by Application 2024 & 2032
- Figure 29: South America Computed Tomography Market in Italy Revenue Share (%), by Application 2024 & 2032
- Figure 30: South America Computed Tomography Market in Italy Volume Share (%), by Application 2024 & 2032
- Figure 31: South America Computed Tomography Market in Italy Revenue (Million), by End User 2024 & 2032
- Figure 32: South America Computed Tomography Market in Italy Volume (Piece), by End User 2024 & 2032
- Figure 33: South America Computed Tomography Market in Italy Revenue Share (%), by End User 2024 & 2032
- Figure 34: South America Computed Tomography Market in Italy Volume Share (%), by End User 2024 & 2032
- Figure 35: South America Computed Tomography Market in Italy Revenue (Million), by Country 2024 & 2032
- Figure 36: South America Computed Tomography Market in Italy Volume (Piece), by Country 2024 & 2032
- Figure 37: South America Computed Tomography Market in Italy Revenue Share (%), by Country 2024 & 2032
- Figure 38: South America Computed Tomography Market in Italy Volume Share (%), by Country 2024 & 2032
- Figure 39: Europe Computed Tomography Market in Italy Revenue (Million), by Type 2024 & 2032
- Figure 40: Europe Computed Tomography Market in Italy Volume (Piece), by Type 2024 & 2032
- Figure 41: Europe Computed Tomography Market in Italy Revenue Share (%), by Type 2024 & 2032
- Figure 42: Europe Computed Tomography Market in Italy Volume Share (%), by Type 2024 & 2032
- Figure 43: Europe Computed Tomography Market in Italy Revenue (Million), by Application 2024 & 2032
- Figure 44: Europe Computed Tomography Market in Italy Volume (Piece), by Application 2024 & 2032
- Figure 45: Europe Computed Tomography Market in Italy Revenue Share (%), by Application 2024 & 2032
- Figure 46: Europe Computed Tomography Market in Italy Volume Share (%), by Application 2024 & 2032
- Figure 47: Europe Computed Tomography Market in Italy Revenue (Million), by End User 2024 & 2032
- Figure 48: Europe Computed Tomography Market in Italy Volume (Piece), by End User 2024 & 2032
- Figure 49: Europe Computed Tomography Market in Italy Revenue Share (%), by End User 2024 & 2032
- Figure 50: Europe Computed Tomography Market in Italy Volume Share (%), by End User 2024 & 2032
- Figure 51: Europe Computed Tomography Market in Italy Revenue (Million), by Country 2024 & 2032
- Figure 52: Europe Computed Tomography Market in Italy Volume (Piece), by Country 2024 & 2032
- Figure 53: Europe Computed Tomography Market in Italy Revenue Share (%), by Country 2024 & 2032
- Figure 54: Europe Computed Tomography Market in Italy Volume Share (%), by Country 2024 & 2032
- Figure 55: Middle East & Africa Computed Tomography Market in Italy Revenue (Million), by Type 2024 & 2032
- Figure 56: Middle East & Africa Computed Tomography Market in Italy Volume (Piece), by Type 2024 & 2032
- Figure 57: Middle East & Africa Computed Tomography Market in Italy Revenue Share (%), by Type 2024 & 2032
- Figure 58: Middle East & Africa Computed Tomography Market in Italy Volume Share (%), by Type 2024 & 2032
- Figure 59: Middle East & Africa Computed Tomography Market in Italy Revenue (Million), by Application 2024 & 2032
- Figure 60: Middle East & Africa Computed Tomography Market in Italy Volume (Piece), by Application 2024 & 2032
- Figure 61: Middle East & Africa Computed Tomography Market in Italy Revenue Share (%), by Application 2024 & 2032
- Figure 62: Middle East & Africa Computed Tomography Market in Italy Volume Share (%), by Application 2024 & 2032
- Figure 63: Middle East & Africa Computed Tomography Market in Italy Revenue (Million), by End User 2024 & 2032
- Figure 64: Middle East & Africa Computed Tomography Market in Italy Volume (Piece), by End User 2024 & 2032
- Figure 65: Middle East & Africa Computed Tomography Market in Italy Revenue Share (%), by End User 2024 & 2032
- Figure 66: Middle East & Africa Computed Tomography Market in Italy Volume Share (%), by End User 2024 & 2032
- Figure 67: Middle East & Africa Computed Tomography Market in Italy Revenue (Million), by Country 2024 & 2032
- Figure 68: Middle East & Africa Computed Tomography Market in Italy Volume (Piece), by Country 2024 & 2032
- Figure 69: Middle East & Africa Computed Tomography Market in Italy Revenue Share (%), by Country 2024 & 2032
- Figure 70: Middle East & Africa Computed Tomography Market in Italy Volume Share (%), by Country 2024 & 2032
- Figure 71: Asia Pacific Computed Tomography Market in Italy Revenue (Million), by Type 2024 & 2032
- Figure 72: Asia Pacific Computed Tomography Market in Italy Volume (Piece), by Type 2024 & 2032
- Figure 73: Asia Pacific Computed Tomography Market in Italy Revenue Share (%), by Type 2024 & 2032
- Figure 74: Asia Pacific Computed Tomography Market in Italy Volume Share (%), by Type 2024 & 2032
- Figure 75: Asia Pacific Computed Tomography Market in Italy Revenue (Million), by Application 2024 & 2032
- Figure 76: Asia Pacific Computed Tomography Market in Italy Volume (Piece), by Application 2024 & 2032
- Figure 77: Asia Pacific Computed Tomography Market in Italy Revenue Share (%), by Application 2024 & 2032
- Figure 78: Asia Pacific Computed Tomography Market in Italy Volume Share (%), by Application 2024 & 2032
- Figure 79: Asia Pacific Computed Tomography Market in Italy Revenue (Million), by End User 2024 & 2032
- Figure 80: Asia Pacific Computed Tomography Market in Italy Volume (Piece), by End User 2024 & 2032
- Figure 81: Asia Pacific Computed Tomography Market in Italy Revenue Share (%), by End User 2024 & 2032
- Figure 82: Asia Pacific Computed Tomography Market in Italy Volume Share (%), by End User 2024 & 2032
- Figure 83: Asia Pacific Computed Tomography Market in Italy Revenue (Million), by Country 2024 & 2032
- Figure 84: Asia Pacific Computed Tomography Market in Italy Volume (Piece), by Country 2024 & 2032
- Figure 85: Asia Pacific Computed Tomography Market in Italy Revenue Share (%), by Country 2024 & 2032
- Figure 86: Asia Pacific Computed Tomography Market in Italy Volume Share (%), by Country 2024 & 2032
List of Tables
- Table 1: Global Computed Tomography Market in Italy Revenue Million Forecast, by Region 2019 & 2032
- Table 2: Global Computed Tomography Market in Italy Volume Piece Forecast, by Region 2019 & 2032
- Table 3: Global Computed Tomography Market in Italy Revenue Million Forecast, by Type 2019 & 2032
- Table 4: Global Computed Tomography Market in Italy Volume Piece Forecast, by Type 2019 & 2032
- Table 5: Global Computed Tomography Market in Italy Revenue Million Forecast, by Application 2019 & 2032
- Table 6: Global Computed Tomography Market in Italy Volume Piece Forecast, by Application 2019 & 2032
- Table 7: Global Computed Tomography Market in Italy Revenue Million Forecast, by End User 2019 & 2032
- Table 8: Global Computed Tomography Market in Italy Volume Piece Forecast, by End User 2019 & 2032
- Table 9: Global Computed Tomography Market in Italy Revenue Million Forecast, by Region 2019 & 2032
- Table 10: Global Computed Tomography Market in Italy Volume Piece Forecast, by Region 2019 & 2032
- Table 11: Global Computed Tomography Market in Italy Revenue Million Forecast, by Country 2019 & 2032
- Table 12: Global Computed Tomography Market in Italy Volume Piece Forecast, by Country 2019 & 2032
- Table 13: Global Computed Tomography Market in Italy Revenue Million Forecast, by Type 2019 & 2032
- Table 14: Global Computed Tomography Market in Italy Volume Piece Forecast, by Type 2019 & 2032
- Table 15: Global Computed Tomography Market in Italy Revenue Million Forecast, by Application 2019 & 2032
- Table 16: Global Computed Tomography Market in Italy Volume Piece Forecast, by Application 2019 & 2032
- Table 17: Global Computed Tomography Market in Italy Revenue Million Forecast, by End User 2019 & 2032
- Table 18: Global Computed Tomography Market in Italy Volume Piece Forecast, by End User 2019 & 2032
- Table 19: Global Computed Tomography Market in Italy Revenue Million Forecast, by Country 2019 & 2032
- Table 20: Global Computed Tomography Market in Italy Volume Piece Forecast, by Country 2019 & 2032
- Table 21: United States Computed Tomography Market in Italy Revenue (Million) Forecast, by Application 2019 & 2032
- Table 22: United States Computed Tomography Market in Italy Volume (Piece) Forecast, by Application 2019 & 2032
- Table 23: Canada Computed Tomography Market in Italy Revenue (Million) Forecast, by Application 2019 & 2032
- Table 24: Canada Computed Tomography Market in Italy Volume (Piece) Forecast, by Application 2019 & 2032
- Table 25: Mexico Computed Tomography Market in Italy Revenue (Million) Forecast, by Application 2019 & 2032
- Table 26: Mexico Computed Tomography Market in Italy Volume (Piece) Forecast, by Application 2019 & 2032
- Table 27: Global Computed Tomography Market in Italy Revenue Million Forecast, by Type 2019 & 2032
- Table 28: Global Computed Tomography Market in Italy Volume Piece Forecast, by Type 2019 & 2032
- Table 29: Global Computed Tomography Market in Italy Revenue Million Forecast, by Application 2019 & 2032
- Table 30: Global Computed Tomography Market in Italy Volume Piece Forecast, by Application 2019 & 2032
- Table 31: Global Computed Tomography Market in Italy Revenue Million Forecast, by End User 2019 & 2032
- Table 32: Global Computed Tomography Market in Italy Volume Piece Forecast, by End User 2019 & 2032
- Table 33: Global Computed Tomography Market in Italy Revenue Million Forecast, by Country 2019 & 2032
- Table 34: Global Computed Tomography Market in Italy Volume Piece Forecast, by Country 2019 & 2032
- Table 35: Brazil Computed Tomography Market in Italy Revenue (Million) Forecast, by Application 2019 & 2032
- Table 36: Brazil Computed Tomography Market in Italy Volume (Piece) Forecast, by Application 2019 & 2032
- Table 37: Argentina Computed Tomography Market in Italy Revenue (Million) Forecast, by Application 2019 & 2032
- Table 38: Argentina Computed Tomography Market in Italy Volume (Piece) Forecast, by Application 2019 & 2032
- Table 39: Rest of South America Computed Tomography Market in Italy Revenue (Million) Forecast, by Application 2019 & 2032
- Table 40: Rest of South America Computed Tomography Market in Italy Volume (Piece) Forecast, by Application 2019 & 2032
- Table 41: Global Computed Tomography Market in Italy Revenue Million Forecast, by Type 2019 & 2032
- Table 42: Global Computed Tomography Market in Italy Volume Piece Forecast, by Type 2019 & 2032
- Table 43: Global Computed Tomography Market in Italy Revenue Million Forecast, by Application 2019 & 2032
- Table 44: Global Computed Tomography Market in Italy Volume Piece Forecast, by Application 2019 & 2032
- Table 45: Global Computed Tomography Market in Italy Revenue Million Forecast, by End User 2019 & 2032
- Table 46: Global Computed Tomography Market in Italy Volume Piece Forecast, by End User 2019 & 2032
- Table 47: Global Computed Tomography Market in Italy Revenue Million Forecast, by Country 2019 & 2032
- Table 48: Global Computed Tomography Market in Italy Volume Piece Forecast, by Country 2019 & 2032
- Table 49: United Kingdom Computed Tomography Market in Italy Revenue (Million) Forecast, by Application 2019 & 2032
- Table 50: United Kingdom Computed Tomography Market in Italy Volume (Piece) Forecast, by Application 2019 & 2032
- Table 51: Germany Computed Tomography Market in Italy Revenue (Million) Forecast, by Application 2019 & 2032
- Table 52: Germany Computed Tomography Market in Italy Volume (Piece) Forecast, by Application 2019 & 2032
- Table 53: France Computed Tomography Market in Italy Revenue (Million) Forecast, by Application 2019 & 2032
- Table 54: France Computed Tomography Market in Italy Volume (Piece) Forecast, by Application 2019 & 2032
- Table 55: Italy Computed Tomography Market in Italy Revenue (Million) Forecast, by Application 2019 & 2032
- Table 56: Italy Computed Tomography Market in Italy Volume (Piece) Forecast, by Application 2019 & 2032
- Table 57: Spain Computed Tomography Market in Italy Revenue (Million) Forecast, by Application 2019 & 2032
- Table 58: Spain Computed Tomography Market in Italy Volume (Piece) Forecast, by Application 2019 & 2032
- Table 59: Russia Computed Tomography Market in Italy Revenue (Million) Forecast, by Application 2019 & 2032
- Table 60: Russia Computed Tomography Market in Italy Volume (Piece) Forecast, by Application 2019 & 2032
- Table 61: Benelux Computed Tomography Market in Italy Revenue (Million) Forecast, by Application 2019 & 2032
- Table 62: Benelux Computed Tomography Market in Italy Volume (Piece) Forecast, by Application 2019 & 2032
- Table 63: Nordics Computed Tomography Market in Italy Revenue (Million) Forecast, by Application 2019 & 2032
- Table 64: Nordics Computed Tomography Market in Italy Volume (Piece) Forecast, by Application 2019 & 2032
- Table 65: Rest of Europe Computed Tomography Market in Italy Revenue (Million) Forecast, by Application 2019 & 2032
- Table 66: Rest of Europe Computed Tomography Market in Italy Volume (Piece) Forecast, by Application 2019 & 2032
- Table 67: Global Computed Tomography Market in Italy Revenue Million Forecast, by Type 2019 & 2032
- Table 68: Global Computed Tomography Market in Italy Volume Piece Forecast, by Type 2019 & 2032
- Table 69: Global Computed Tomography Market in Italy Revenue Million Forecast, by Application 2019 & 2032
- Table 70: Global Computed Tomography Market in Italy Volume Piece Forecast, by Application 2019 & 2032
- Table 71: Global Computed Tomography Market in Italy Revenue Million Forecast, by End User 2019 & 2032
- Table 72: Global Computed Tomography Market in Italy Volume Piece Forecast, by End User 2019 & 2032
- Table 73: Global Computed Tomography Market in Italy Revenue Million Forecast, by Country 2019 & 2032
- Table 74: Global Computed Tomography Market in Italy Volume Piece Forecast, by Country 2019 & 2032
- Table 75: Turkey Computed Tomography Market in Italy Revenue (Million) Forecast, by Application 2019 & 2032
- Table 76: Turkey Computed Tomography Market in Italy Volume (Piece) Forecast, by Application 2019 & 2032
- Table 77: Israel Computed Tomography Market in Italy Revenue (Million) Forecast, by Application 2019 & 2032
- Table 78: Israel Computed Tomography Market in Italy Volume (Piece) Forecast, by Application 2019 & 2032
- Table 79: GCC Computed Tomography Market in Italy Revenue (Million) Forecast, by Application 2019 & 2032
- Table 80: GCC Computed Tomography Market in Italy Volume (Piece) Forecast, by Application 2019 & 2032
- Table 81: North Africa Computed Tomography Market in Italy Revenue (Million) Forecast, by Application 2019 & 2032
- Table 82: North Africa Computed Tomography Market in Italy Volume (Piece) Forecast, by Application 2019 & 2032
- Table 83: South Africa Computed Tomography Market in Italy Revenue (Million) Forecast, by Application 2019 & 2032
- Table 84: South Africa Computed Tomography Market in Italy Volume (Piece) Forecast, by Application 2019 & 2032
- Table 85: Rest of Middle East & Africa Computed Tomography Market in Italy Revenue (Million) Forecast, by Application 2019 & 2032
- Table 86: Rest of Middle East & Africa Computed Tomography Market in Italy Volume (Piece) Forecast, by Application 2019 & 2032
- Table 87: Global Computed Tomography Market in Italy Revenue Million Forecast, by Type 2019 & 2032
- Table 88: Global Computed Tomography Market in Italy Volume Piece Forecast, by Type 2019 & 2032
- Table 89: Global Computed Tomography Market in Italy Revenue Million Forecast, by Application 2019 & 2032
- Table 90: Global Computed Tomography Market in Italy Volume Piece Forecast, by Application 2019 & 2032
- Table 91: Global Computed Tomography Market in Italy Revenue Million Forecast, by End User 2019 & 2032
- Table 92: Global Computed Tomography Market in Italy Volume Piece Forecast, by End User 2019 & 2032
- Table 93: Global Computed Tomography Market in Italy Revenue Million Forecast, by Country 2019 & 2032
- Table 94: Global Computed Tomography Market in Italy Volume Piece Forecast, by Country 2019 & 2032
- Table 95: China Computed Tomography Market in Italy Revenue (Million) Forecast, by Application 2019 & 2032
- Table 96: China Computed Tomography Market in Italy Volume (Piece) Forecast, by Application 2019 & 2032
- Table 97: India Computed Tomography Market in Italy Revenue (Million) Forecast, by Application 2019 & 2032
- Table 98: India Computed Tomography Market in Italy Volume (Piece) Forecast, by Application 2019 & 2032
- Table 99: Japan Computed Tomography Market in Italy Revenue (Million) Forecast, by Application 2019 & 2032
- Table 100: Japan Computed Tomography Market in Italy Volume (Piece) Forecast, by Application 2019 & 2032
- Table 101: South Korea Computed Tomography Market in Italy Revenue (Million) Forecast, by Application 2019 & 2032
- Table 102: South Korea Computed Tomography Market in Italy Volume (Piece) Forecast, by Application 2019 & 2032
- Table 103: ASEAN Computed Tomography Market in Italy Revenue (Million) Forecast, by Application 2019 & 2032
- Table 104: ASEAN Computed Tomography Market in Italy Volume (Piece) Forecast, by Application 2019 & 2032
- Table 105: Oceania Computed Tomography Market in Italy Revenue (Million) Forecast, by Application 2019 & 2032
- Table 106: Oceania Computed Tomography Market in Italy Volume (Piece) Forecast, by Application 2019 & 2032
- Table 107: Rest of Asia Pacific Computed Tomography Market in Italy Revenue (Million) Forecast, by Application 2019 & 2032
- Table 108: Rest of Asia Pacific Computed Tomography Market in Italy Volume (Piece) Forecast, by Application 2019 & 2032
Frequently Asked Questions
1. What is the projected Compound Annual Growth Rate (CAGR) of the Computed Tomography Market in Italy?
The projected CAGR is approximately 5.58%.
2. Which companies are prominent players in the Computed Tomography Market in Italy?
Key companies in the market include CareStream Health, Siemens Healthineers, GE Healthcare, Koninklijke Philips NV, J Morita Corporation, Canon Medical Systems Corporation, Fujifilm Holdings Corporation.
3. What are the main segments of the Computed Tomography Market in Italy?
The market segments include Type, Application, End User.
4. Can you provide details about the market size?
The market size is estimated to be USD 244.97 Million as of 2022.
5. What are some drivers contributing to market growth?
Increasing Geriatric Population and Chronic Disease Burden; Technological Advancements in Computed Tomography.
6. What are the notable trends driving market growth?
Oncology Segment is Expected to Register Significant Growth Over the Forecast Period.
7. Are there any restraints impacting market growth?
High Cost Associated With CT Scan Procedure and Equipment.
8. Can you provide examples of recent developments in the market?
In November 2021, Siemens Healthineers launched Naeotom Alpha, the world's first photon-counting CT scanner in the United States and Europe.
9. What pricing options are available for accessing the report?
Pricing options include single-user, multi-user, and enterprise licenses priced at USD 3800, USD 4500, and USD 5800 respectively.
10. Is the market size provided in terms of value or volume?
The market size is provided in terms of value, measured in Million and volume, measured in Piece.
11. Are there any specific market keywords associated with the report?
Yes, the market keyword associated with the report is "Computed Tomography Market in Italy," which aids in identifying and referencing the specific market segment covered.
12. How do I determine which pricing option suits my needs best?
The pricing options vary based on user requirements and access needs. Individual users may opt for single-user licenses, while businesses requiring broader access may choose multi-user or enterprise licenses for cost-effective access to the report.
13. Are there any additional resources or data provided in the Computed Tomography Market in Italy report?
While the report offers comprehensive insights, it's advisable to review the specific contents or supplementary materials provided to ascertain if additional resources or data are available.
14. How can I stay updated on further developments or reports in the Computed Tomography Market in Italy?
To stay informed about further developments, trends, and reports in the Computed Tomography Market in Italy, consider subscribing to industry newsletters, following relevant companies and organizations, or regularly checking reputable industry news sources and publications.
Methodology
Step 1 - Identification of Relevant Samples Size from Population Database


Step 2 - Approaches for Defining Global Market Size (Value, Volume* & Price*)

Note*: In applicable scenarios
Step 3 - Data Sources
Primary Research
- Web Analytics
- Survey Reports
- Research Institute
- Latest Research Reports
- Opinion Leaders
Secondary Research
- Annual Reports
- White Paper
- Latest Press Release
- Industry Association
- Paid Database
- Investor Presentations

Step 4 - Data Triangulation
Involves using different sources of information in order to increase the validity of a study
These sources are likely to be stakeholders in a program - participants, other researchers, program staff, other community members, and so on.
Then we put all data in single framework & apply various statistical tools to find out the dynamic on the market.
During the analysis stage, feedback from the stakeholder groups would be compared to determine areas of agreement as well as areas of divergence
