

Key Insights
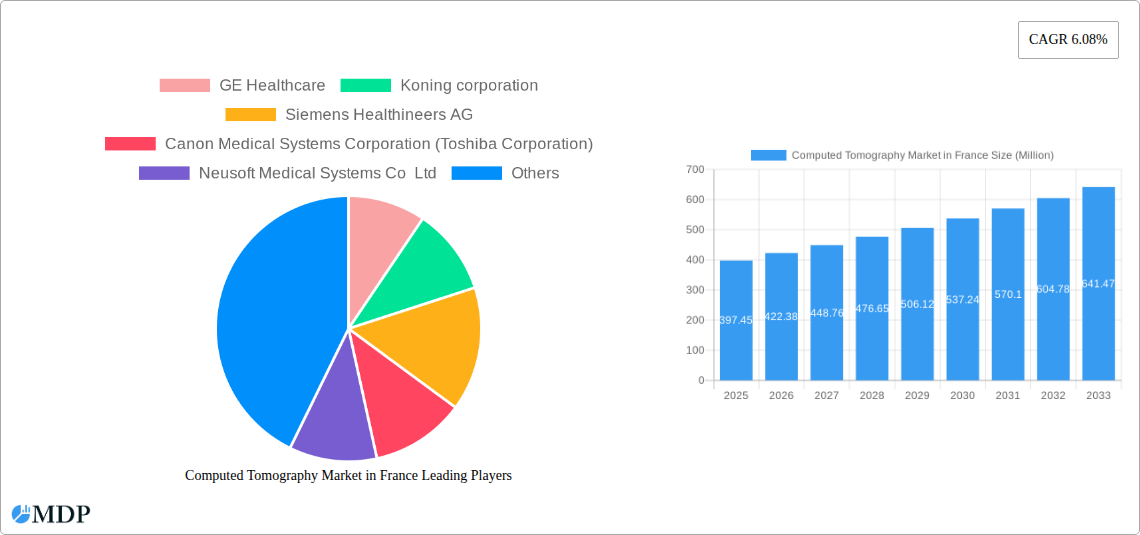
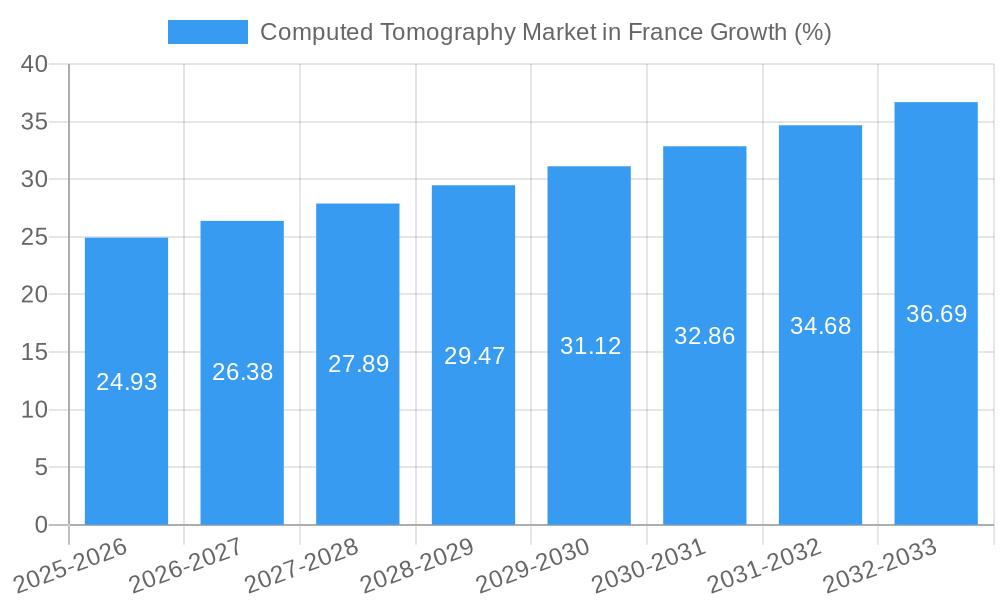
The French Computed Tomography (CT) market, valued at €397.45 million in 2025, is poised for robust growth, exhibiting a Compound Annual Growth Rate (CAGR) of 6.08% from 2025 to 2033. This expansion is driven by several key factors. The increasing prevalence of chronic diseases like cancer, cardiovascular disorders, and neurological conditions necessitates advanced diagnostic imaging, fueling demand for CT scans. Technological advancements, including the introduction of multi-slice CT scanners with enhanced image quality and reduced radiation exposure, are also significant drivers. Furthermore, the rising geriatric population in France contributes to the increased demand for diagnostic imaging services, particularly CT scans, for early detection and diagnosis of age-related conditions. Government initiatives promoting healthcare infrastructure development and increased investment in medical technology further contribute to the market's positive trajectory. The market is segmented by slice type (low, medium, high), application (oncology, neurology, cardiovascular, musculoskeletal, other), and end-user (hospitals, diagnostic centers, other). Hospitals currently dominate the end-user segment, reflecting the vital role of CT in inpatient care. However, the diagnostic center segment is expected to witness significant growth due to increasing demand for outpatient services and cost-effectiveness. Competition among key players like GE Healthcare, Siemens Healthineers, and Philips, coupled with ongoing technological innovation, ensures a dynamic market landscape.
The market's growth, however, is not without challenges. Rising costs associated with advanced CT scanners and maintenance can present barriers to entry for smaller facilities. Moreover, increasing regulatory scrutiny and stringent safety guidelines related to radiation exposure necessitate compliance costs, which can affect overall profitability. Despite these constraints, the consistent demand driven by an aging population and technological advancements creates a favorable outlook for sustained expansion of the French CT market. The strong growth trajectory indicates significant opportunities for both established and emerging players focusing on innovation and strategic partnerships.
Computed Tomography (CT) Market in France: A Comprehensive Market Report (2019-2033)
This in-depth report provides a comprehensive analysis of the Computed Tomography (CT) market in France, covering market dynamics, industry trends, leading segments, key players, and future growth opportunities. The study period spans from 2019 to 2033, with 2025 serving as the base and estimated year. This report is essential for industry stakeholders, investors, and anyone seeking a detailed understanding of this vital healthcare market.
Computed Tomography Market in France Market Dynamics & Concentration
The French CT market, valued at xx Million in 2025, exhibits a moderately concentrated landscape with a few major players holding significant market share. Market concentration is driven by economies of scale, technological advancements, and stringent regulatory approvals. Innovation is a key driver, with continuous improvements in image quality, speed, and radiation dose reduction shaping market dynamics. The regulatory framework, largely aligned with European Union directives, impacts device approvals and pricing strategies. Product substitutes, such as MRI and ultrasound, pose competitive pressures but CT remains the preferred modality for certain applications. End-user trends show a growing preference for advanced CT technologies, including multislice and spectral CT, driven by demand for improved diagnostic accuracy and efficiency. M&A activity in the French CT market has been relatively modest in recent years, with approximately xx deals recorded between 2019 and 2024, primarily involving smaller companies and technology acquisitions.
- Market Concentration: High, with top 5 players holding approximately xx% of the market share.
- Innovation Drivers: Improved image quality, reduced radiation dose, faster scan times, AI integration.
- Regulatory Framework: Stringent approvals, price controls impacting market access.
- Product Substitutes: MRI, Ultrasound, posing limited but growing competitive threat.
- End-User Trends: Shift towards advanced CT technologies for enhanced diagnostic capabilities.
- M&A Activity: xx deals between 2019 and 2024, predominantly small-scale acquisitions.
Computed Tomography Market in France Industry Trends & Analysis
The French CT market demonstrates robust growth, exhibiting a CAGR of xx% during the historical period (2019-2024) and a projected CAGR of xx% during the forecast period (2025-2033). This growth is fueled by several factors. Increasing prevalence of chronic diseases like cardiovascular diseases and cancer necessitates frequent diagnostic imaging. Technological advancements, like multislice and spectral CT, improve diagnostic accuracy and efficiency, boosting market penetration. Growing geriatric population adds further to the demand for CT scans. Government initiatives promoting healthcare infrastructure development and investment in medical technology also contribute positively. Competitive dynamics are characterized by intense competition amongst major players, focused on innovation, pricing strategies, and service offerings. Market penetration of advanced CT technologies remains relatively high in urban areas compared to rural regions, indicating significant untapped potential in rural markets.
Leading Markets & Segments in Computed Tomography Market in France
The French CT market shows strong growth across all segments, yet some exhibit stronger dominance.
- Type: High-slice CT scanners constitute the dominant segment (xx%), followed by medium-slice (xx%) and low-slice (xx%) CT scanners. This is driven by the increasing demand for higher resolution images and faster scan times.
- Application: Oncology and Cardiovascular applications account for a significant portion (xx%) of the market, followed by Neurology, Musculoskeletal, and Other Applications. The high prevalence of cardiovascular diseases and cancer in France fuels the demand for CT scans in these areas.
- End User: Hospitals account for the largest market share (xx%), followed by Diagnostic Centers and Other End Users. This reflects the high concentration of CT scanners within established hospital settings.
Key Drivers:
- Economic Policies: Government investment in healthcare infrastructure, favourable reimbursement policies.
- Infrastructure: High concentration of hospitals and diagnostic centers in urban areas.
- Technological Advancements: Continuous innovation driving demand for advanced CT technologies.
Computed Tomography Market in France Product Developments
Recent years have witnessed significant advancements in CT technology, primarily focusing on improved image quality, reduced radiation dose, and increased speed. The introduction of photon-counting CT scanners represents a major breakthrough, offering superior image quality and functional imaging capabilities. The development of AI-powered image analysis tools further enhances diagnostic efficiency and accuracy. These innovations are driving market growth and enhancing the competitive landscape, with companies competing on the basis of technology, image quality, and clinical workflow integration.
Key Drivers of Computed Tomography Market in France Growth
The growth of the French CT market is propelled by several interconnected factors. Technological advancements, such as multislice and spectral CT, significantly improve image quality and reduce scan times, driving demand. The rising prevalence of chronic diseases requiring timely and accurate diagnosis underscores the importance of CT technology in modern healthcare. Government initiatives focused on improving healthcare infrastructure and incentivizing adoption of advanced medical technologies also significantly bolster market expansion. Furthermore, continuous research and development into AI-powered image analysis tools further enhances diagnostic accuracy and efficiency.
Challenges in the Computed Tomography Market in France Market
The French CT market faces several challenges that may impede its growth trajectory. Stringent regulatory approvals and reimbursement processes can lead to delays in product launches and limit market access for some devices. High equipment costs and ongoing maintenance expenses can create financial barriers for smaller healthcare providers. Furthermore, competitive pressures from established players and the emergence of alternative imaging modalities necessitates a continuous investment in innovation and strategic partnerships. Supply chain disruptions related to global events can also influence the availability of CT equipment and its components.
Emerging Opportunities in Computed Tomography Market in France
Significant opportunities exist for market expansion in the French CT sector. The growing adoption of AI-powered image analysis tools offers the potential to further enhance diagnostic accuracy and efficiency. Strategic partnerships between CT manufacturers and healthcare providers can streamline workflow and optimize resource utilization. Expanding access to CT technology in under-served regions remains a significant growth catalyst. Furthermore, focus on developing more cost-effective CT systems is expected to expand the affordability and availability of the technology.
Leading Players in the Computed Tomography Market in France Sector
- GE Healthcare
- Koning corporation
- Siemens Healthineers AG
- Canon Medical Systems Corporation (Toshiba Corporation)
- Neusoft Medical Systems Co Ltd
- Carestream Health
- Koninklijke Philips NV
- J Morita Corporation
- Planmeca Group (Planmed OY)
- SAMSUNG ELECTRONICS CO LTD (SAMSUNG MEDISON)
- Fujifilm Holdings Corporation
Key Milestones in Computed Tomography Market in France Industry
- December 2020: Philips launched its next-generation Azurion platform with SmartCT in France, enhancing 3D imaging capabilities.
- November 2021: Siemens Healthineers launched the NAEOTOM Alpha, the world's first photon-counting CT scanner, expanding availability across Europe, including France.
Strategic Outlook for Computed Tomography Market in France Market
The future of the French CT market is promising, driven by technological advancements, increasing disease prevalence, and government support. Strategic partnerships, focused on integrating AI and cloud-based solutions, will shape market dynamics. Companies that invest in research and development, particularly in areas such as radiation dose reduction and AI-driven diagnostics, are poised for significant growth. Expansion into underserved regions and focusing on cost-effective solutions will unlock further market potential. The market is expected to maintain a healthy growth trajectory for the foreseeable future, driven by these key trends.
Computed Tomography Market in France Segmentation
-
1. Type
- 1.1. Low Slice
- 1.2. Medium Slice
- 1.3. High Slice
-
2. Application
- 2.1. Oncology
- 2.2. Neurology
- 2.3. Cardiovascular
- 2.4. Musculoskeletal
- 2.5. Other Applications
-
3. End User
- 3.1. Hospitals
- 3.2. Diagnostic Centers
- 3.3. Other End Users
Computed Tomography Market in France Segmentation By Geography
-
1. North America
- 1.1. United States
- 1.2. Canada
- 1.3. Mexico
-
2. South America
- 2.1. Brazil
- 2.2. Argentina
- 2.3. Rest of South America
-
3. Europe
- 3.1. United Kingdom
- 3.2. Germany
- 3.3. France
- 3.4. Italy
- 3.5. Spain
- 3.6. Russia
- 3.7. Benelux
- 3.8. Nordics
- 3.9. Rest of Europe
-
4. Middle East & Africa
- 4.1. Turkey
- 4.2. Israel
- 4.3. GCC
- 4.4. North Africa
- 4.5. South Africa
- 4.6. Rest of Middle East & Africa
-
5. Asia Pacific
- 5.1. China
- 5.2. India
- 5.3. Japan
- 5.4. South Korea
- 5.5. ASEAN
- 5.6. Oceania
- 5.7. Rest of Asia Pacific
Computed Tomography Market in France REPORT HIGHLIGHTS
| Aspects | Details |
|---|---|
| Study Period | 2019-2033 |
| Base Year | 2024 |
| Estimated Year | 2025 |
| Forecast Period | 2025-2033 |
| Historical Period | 2019-2024 |
| Growth Rate | CAGR of 6.08% from 2019-2033 |
| Segmentation |
|
Table of Contents
- 1. Introduction
- 1.1. Research Scope
- 1.2. Market Segmentation
- 1.3. Research Methodology
- 1.4. Definitions and Assumptions
- 2. Executive Summary
- 2.1. Introduction
- 3. Market Dynamics
- 3.1. Introduction
- 3.2. Market Drivers
- 3.2.1. Increasing Prevalence of Chronic Diseases; Rising Geriatric Population; Increasing Technological Advancements
- 3.3. Market Restrains
- 3.3.1. Lack Of Proper Reimbursement And Stringent Regulatory Approval Procedures; High Cost of Equipment
- 3.4. Market Trends
- 3.4.1. Oncology Segment is Expected to Hold a Significant Market Share Over the Forecast Period
- 4. Market Factor Analysis
- 4.1. Porters Five Forces
- 4.2. Supply/Value Chain
- 4.3. PESTEL analysis
- 4.4. Market Entropy
- 4.5. Patent/Trademark Analysis
- 5. Global Computed Tomography Market in France Analysis, Insights and Forecast, 2019-2031
- 5.1. Market Analysis, Insights and Forecast - by Type
- 5.1.1. Low Slice
- 5.1.2. Medium Slice
- 5.1.3. High Slice
- 5.2. Market Analysis, Insights and Forecast - by Application
- 5.2.1. Oncology
- 5.2.2. Neurology
- 5.2.3. Cardiovascular
- 5.2.4. Musculoskeletal
- 5.2.5. Other Applications
- 5.3. Market Analysis, Insights and Forecast - by End User
- 5.3.1. Hospitals
- 5.3.2. Diagnostic Centers
- 5.3.3. Other End Users
- 5.4. Market Analysis, Insights and Forecast - by Region
- 5.4.1. North America
- 5.4.2. South America
- 5.4.3. Europe
- 5.4.4. Middle East & Africa
- 5.4.5. Asia Pacific
- 5.1. Market Analysis, Insights and Forecast - by Type
- 6. North America Computed Tomography Market in France Analysis, Insights and Forecast, 2019-2031
- 6.1. Market Analysis, Insights and Forecast - by Type
- 6.1.1. Low Slice
- 6.1.2. Medium Slice
- 6.1.3. High Slice
- 6.2. Market Analysis, Insights and Forecast - by Application
- 6.2.1. Oncology
- 6.2.2. Neurology
- 6.2.3. Cardiovascular
- 6.2.4. Musculoskeletal
- 6.2.5. Other Applications
- 6.3. Market Analysis, Insights and Forecast - by End User
- 6.3.1. Hospitals
- 6.3.2. Diagnostic Centers
- 6.3.3. Other End Users
- 6.1. Market Analysis, Insights and Forecast - by Type
- 7. South America Computed Tomography Market in France Analysis, Insights and Forecast, 2019-2031
- 7.1. Market Analysis, Insights and Forecast - by Type
- 7.1.1. Low Slice
- 7.1.2. Medium Slice
- 7.1.3. High Slice
- 7.2. Market Analysis, Insights and Forecast - by Application
- 7.2.1. Oncology
- 7.2.2. Neurology
- 7.2.3. Cardiovascular
- 7.2.4. Musculoskeletal
- 7.2.5. Other Applications
- 7.3. Market Analysis, Insights and Forecast - by End User
- 7.3.1. Hospitals
- 7.3.2. Diagnostic Centers
- 7.3.3. Other End Users
- 7.1. Market Analysis, Insights and Forecast - by Type
- 8. Europe Computed Tomography Market in France Analysis, Insights and Forecast, 2019-2031
- 8.1. Market Analysis, Insights and Forecast - by Type
- 8.1.1. Low Slice
- 8.1.2. Medium Slice
- 8.1.3. High Slice
- 8.2. Market Analysis, Insights and Forecast - by Application
- 8.2.1. Oncology
- 8.2.2. Neurology
- 8.2.3. Cardiovascular
- 8.2.4. Musculoskeletal
- 8.2.5. Other Applications
- 8.3. Market Analysis, Insights and Forecast - by End User
- 8.3.1. Hospitals
- 8.3.2. Diagnostic Centers
- 8.3.3. Other End Users
- 8.1. Market Analysis, Insights and Forecast - by Type
- 9. Middle East & Africa Computed Tomography Market in France Analysis, Insights and Forecast, 2019-2031
- 9.1. Market Analysis, Insights and Forecast - by Type
- 9.1.1. Low Slice
- 9.1.2. Medium Slice
- 9.1.3. High Slice
- 9.2. Market Analysis, Insights and Forecast - by Application
- 9.2.1. Oncology
- 9.2.2. Neurology
- 9.2.3. Cardiovascular
- 9.2.4. Musculoskeletal
- 9.2.5. Other Applications
- 9.3. Market Analysis, Insights and Forecast - by End User
- 9.3.1. Hospitals
- 9.3.2. Diagnostic Centers
- 9.3.3. Other End Users
- 9.1. Market Analysis, Insights and Forecast - by Type
- 10. Asia Pacific Computed Tomography Market in France Analysis, Insights and Forecast, 2019-2031
- 10.1. Market Analysis, Insights and Forecast - by Type
- 10.1.1. Low Slice
- 10.1.2. Medium Slice
- 10.1.3. High Slice
- 10.2. Market Analysis, Insights and Forecast - by Application
- 10.2.1. Oncology
- 10.2.2. Neurology
- 10.2.3. Cardiovascular
- 10.2.4. Musculoskeletal
- 10.2.5. Other Applications
- 10.3. Market Analysis, Insights and Forecast - by End User
- 10.3.1. Hospitals
- 10.3.2. Diagnostic Centers
- 10.3.3. Other End Users
- 10.1. Market Analysis, Insights and Forecast - by Type
- 11. Competitive Analysis
- 11.1. Global Market Share Analysis 2024
- 11.2. Company Profiles
- 11.2.1 GE Healthcare
- 11.2.1.1. Overview
- 11.2.1.2. Products
- 11.2.1.3. SWOT Analysis
- 11.2.1.4. Recent Developments
- 11.2.1.5. Financials (Based on Availability)
- 11.2.2 Koning corporation
- 11.2.2.1. Overview
- 11.2.2.2. Products
- 11.2.2.3. SWOT Analysis
- 11.2.2.4. Recent Developments
- 11.2.2.5. Financials (Based on Availability)
- 11.2.3 Siemens Healthineers AG
- 11.2.3.1. Overview
- 11.2.3.2. Products
- 11.2.3.3. SWOT Analysis
- 11.2.3.4. Recent Developments
- 11.2.3.5. Financials (Based on Availability)
- 11.2.4 Canon Medical Systems Corporation (Toshiba Corporation)
- 11.2.4.1. Overview
- 11.2.4.2. Products
- 11.2.4.3. SWOT Analysis
- 11.2.4.4. Recent Developments
- 11.2.4.5. Financials (Based on Availability)
- 11.2.5 Neusoft Medical Systems Co Ltd
- 11.2.5.1. Overview
- 11.2.5.2. Products
- 11.2.5.3. SWOT Analysis
- 11.2.5.4. Recent Developments
- 11.2.5.5. Financials (Based on Availability)
- 11.2.6 Carestream Health
- 11.2.6.1. Overview
- 11.2.6.2. Products
- 11.2.6.3. SWOT Analysis
- 11.2.6.4. Recent Developments
- 11.2.6.5. Financials (Based on Availability)
- 11.2.7 Koninklijke Philips NV
- 11.2.7.1. Overview
- 11.2.7.2. Products
- 11.2.7.3. SWOT Analysis
- 11.2.7.4. Recent Developments
- 11.2.7.5. Financials (Based on Availability)
- 11.2.8 J Morita Corporation
- 11.2.8.1. Overview
- 11.2.8.2. Products
- 11.2.8.3. SWOT Analysis
- 11.2.8.4. Recent Developments
- 11.2.8.5. Financials (Based on Availability)
- 11.2.9 Planmeca Group (Planmed OY)
- 11.2.9.1. Overview
- 11.2.9.2. Products
- 11.2.9.3. SWOT Analysis
- 11.2.9.4. Recent Developments
- 11.2.9.5. Financials (Based on Availability)
- 11.2.10 SAMSUNG ELECTRONICS CO LTD (SAMSUNG MEDISON)
- 11.2.10.1. Overview
- 11.2.10.2. Products
- 11.2.10.3. SWOT Analysis
- 11.2.10.4. Recent Developments
- 11.2.10.5. Financials (Based on Availability)
- 11.2.11 Fujifilm Holdings Corporation
- 11.2.11.1. Overview
- 11.2.11.2. Products
- 11.2.11.3. SWOT Analysis
- 11.2.11.4. Recent Developments
- 11.2.11.5. Financials (Based on Availability)
- 11.2.1 GE Healthcare
List of Figures
- Figure 1: Global Computed Tomography Market in France Revenue Breakdown (Million, %) by Region 2024 & 2032
- Figure 2: France Computed Tomography Market in France Revenue (Million), by Country 2024 & 2032
- Figure 3: France Computed Tomography Market in France Revenue Share (%), by Country 2024 & 2032
- Figure 4: North America Computed Tomography Market in France Revenue (Million), by Type 2024 & 2032
- Figure 5: North America Computed Tomography Market in France Revenue Share (%), by Type 2024 & 2032
- Figure 6: North America Computed Tomography Market in France Revenue (Million), by Application 2024 & 2032
- Figure 7: North America Computed Tomography Market in France Revenue Share (%), by Application 2024 & 2032
- Figure 8: North America Computed Tomography Market in France Revenue (Million), by End User 2024 & 2032
- Figure 9: North America Computed Tomography Market in France Revenue Share (%), by End User 2024 & 2032
- Figure 10: North America Computed Tomography Market in France Revenue (Million), by Country 2024 & 2032
- Figure 11: North America Computed Tomography Market in France Revenue Share (%), by Country 2024 & 2032
- Figure 12: South America Computed Tomography Market in France Revenue (Million), by Type 2024 & 2032
- Figure 13: South America Computed Tomography Market in France Revenue Share (%), by Type 2024 & 2032
- Figure 14: South America Computed Tomography Market in France Revenue (Million), by Application 2024 & 2032
- Figure 15: South America Computed Tomography Market in France Revenue Share (%), by Application 2024 & 2032
- Figure 16: South America Computed Tomography Market in France Revenue (Million), by End User 2024 & 2032
- Figure 17: South America Computed Tomography Market in France Revenue Share (%), by End User 2024 & 2032
- Figure 18: South America Computed Tomography Market in France Revenue (Million), by Country 2024 & 2032
- Figure 19: South America Computed Tomography Market in France Revenue Share (%), by Country 2024 & 2032
- Figure 20: Europe Computed Tomography Market in France Revenue (Million), by Type 2024 & 2032
- Figure 21: Europe Computed Tomography Market in France Revenue Share (%), by Type 2024 & 2032
- Figure 22: Europe Computed Tomography Market in France Revenue (Million), by Application 2024 & 2032
- Figure 23: Europe Computed Tomography Market in France Revenue Share (%), by Application 2024 & 2032
- Figure 24: Europe Computed Tomography Market in France Revenue (Million), by End User 2024 & 2032
- Figure 25: Europe Computed Tomography Market in France Revenue Share (%), by End User 2024 & 2032
- Figure 26: Europe Computed Tomography Market in France Revenue (Million), by Country 2024 & 2032
- Figure 27: Europe Computed Tomography Market in France Revenue Share (%), by Country 2024 & 2032
- Figure 28: Middle East & Africa Computed Tomography Market in France Revenue (Million), by Type 2024 & 2032
- Figure 29: Middle East & Africa Computed Tomography Market in France Revenue Share (%), by Type 2024 & 2032
- Figure 30: Middle East & Africa Computed Tomography Market in France Revenue (Million), by Application 2024 & 2032
- Figure 31: Middle East & Africa Computed Tomography Market in France Revenue Share (%), by Application 2024 & 2032
- Figure 32: Middle East & Africa Computed Tomography Market in France Revenue (Million), by End User 2024 & 2032
- Figure 33: Middle East & Africa Computed Tomography Market in France Revenue Share (%), by End User 2024 & 2032
- Figure 34: Middle East & Africa Computed Tomography Market in France Revenue (Million), by Country 2024 & 2032
- Figure 35: Middle East & Africa Computed Tomography Market in France Revenue Share (%), by Country 2024 & 2032
- Figure 36: Asia Pacific Computed Tomography Market in France Revenue (Million), by Type 2024 & 2032
- Figure 37: Asia Pacific Computed Tomography Market in France Revenue Share (%), by Type 2024 & 2032
- Figure 38: Asia Pacific Computed Tomography Market in France Revenue (Million), by Application 2024 & 2032
- Figure 39: Asia Pacific Computed Tomography Market in France Revenue Share (%), by Application 2024 & 2032
- Figure 40: Asia Pacific Computed Tomography Market in France Revenue (Million), by End User 2024 & 2032
- Figure 41: Asia Pacific Computed Tomography Market in France Revenue Share (%), by End User 2024 & 2032
- Figure 42: Asia Pacific Computed Tomography Market in France Revenue (Million), by Country 2024 & 2032
- Figure 43: Asia Pacific Computed Tomography Market in France Revenue Share (%), by Country 2024 & 2032
List of Tables
- Table 1: Global Computed Tomography Market in France Revenue Million Forecast, by Region 2019 & 2032
- Table 2: Global Computed Tomography Market in France Revenue Million Forecast, by Type 2019 & 2032
- Table 3: Global Computed Tomography Market in France Revenue Million Forecast, by Application 2019 & 2032
- Table 4: Global Computed Tomography Market in France Revenue Million Forecast, by End User 2019 & 2032
- Table 5: Global Computed Tomography Market in France Revenue Million Forecast, by Region 2019 & 2032
- Table 6: Global Computed Tomography Market in France Revenue Million Forecast, by Country 2019 & 2032
- Table 7: Global Computed Tomography Market in France Revenue Million Forecast, by Type 2019 & 2032
- Table 8: Global Computed Tomography Market in France Revenue Million Forecast, by Application 2019 & 2032
- Table 9: Global Computed Tomography Market in France Revenue Million Forecast, by End User 2019 & 2032
- Table 10: Global Computed Tomography Market in France Revenue Million Forecast, by Country 2019 & 2032
- Table 11: United States Computed Tomography Market in France Revenue (Million) Forecast, by Application 2019 & 2032
- Table 12: Canada Computed Tomography Market in France Revenue (Million) Forecast, by Application 2019 & 2032
- Table 13: Mexico Computed Tomography Market in France Revenue (Million) Forecast, by Application 2019 & 2032
- Table 14: Global Computed Tomography Market in France Revenue Million Forecast, by Type 2019 & 2032
- Table 15: Global Computed Tomography Market in France Revenue Million Forecast, by Application 2019 & 2032
- Table 16: Global Computed Tomography Market in France Revenue Million Forecast, by End User 2019 & 2032
- Table 17: Global Computed Tomography Market in France Revenue Million Forecast, by Country 2019 & 2032
- Table 18: Brazil Computed Tomography Market in France Revenue (Million) Forecast, by Application 2019 & 2032
- Table 19: Argentina Computed Tomography Market in France Revenue (Million) Forecast, by Application 2019 & 2032
- Table 20: Rest of South America Computed Tomography Market in France Revenue (Million) Forecast, by Application 2019 & 2032
- Table 21: Global Computed Tomography Market in France Revenue Million Forecast, by Type 2019 & 2032
- Table 22: Global Computed Tomography Market in France Revenue Million Forecast, by Application 2019 & 2032
- Table 23: Global Computed Tomography Market in France Revenue Million Forecast, by End User 2019 & 2032
- Table 24: Global Computed Tomography Market in France Revenue Million Forecast, by Country 2019 & 2032
- Table 25: United Kingdom Computed Tomography Market in France Revenue (Million) Forecast, by Application 2019 & 2032
- Table 26: Germany Computed Tomography Market in France Revenue (Million) Forecast, by Application 2019 & 2032
- Table 27: France Computed Tomography Market in France Revenue (Million) Forecast, by Application 2019 & 2032
- Table 28: Italy Computed Tomography Market in France Revenue (Million) Forecast, by Application 2019 & 2032
- Table 29: Spain Computed Tomography Market in France Revenue (Million) Forecast, by Application 2019 & 2032
- Table 30: Russia Computed Tomography Market in France Revenue (Million) Forecast, by Application 2019 & 2032
- Table 31: Benelux Computed Tomography Market in France Revenue (Million) Forecast, by Application 2019 & 2032
- Table 32: Nordics Computed Tomography Market in France Revenue (Million) Forecast, by Application 2019 & 2032
- Table 33: Rest of Europe Computed Tomography Market in France Revenue (Million) Forecast, by Application 2019 & 2032
- Table 34: Global Computed Tomography Market in France Revenue Million Forecast, by Type 2019 & 2032
- Table 35: Global Computed Tomography Market in France Revenue Million Forecast, by Application 2019 & 2032
- Table 36: Global Computed Tomography Market in France Revenue Million Forecast, by End User 2019 & 2032
- Table 37: Global Computed Tomography Market in France Revenue Million Forecast, by Country 2019 & 2032
- Table 38: Turkey Computed Tomography Market in France Revenue (Million) Forecast, by Application 2019 & 2032
- Table 39: Israel Computed Tomography Market in France Revenue (Million) Forecast, by Application 2019 & 2032
- Table 40: GCC Computed Tomography Market in France Revenue (Million) Forecast, by Application 2019 & 2032
- Table 41: North Africa Computed Tomography Market in France Revenue (Million) Forecast, by Application 2019 & 2032
- Table 42: South Africa Computed Tomography Market in France Revenue (Million) Forecast, by Application 2019 & 2032
- Table 43: Rest of Middle East & Africa Computed Tomography Market in France Revenue (Million) Forecast, by Application 2019 & 2032
- Table 44: Global Computed Tomography Market in France Revenue Million Forecast, by Type 2019 & 2032
- Table 45: Global Computed Tomography Market in France Revenue Million Forecast, by Application 2019 & 2032
- Table 46: Global Computed Tomography Market in France Revenue Million Forecast, by End User 2019 & 2032
- Table 47: Global Computed Tomography Market in France Revenue Million Forecast, by Country 2019 & 2032
- Table 48: China Computed Tomography Market in France Revenue (Million) Forecast, by Application 2019 & 2032
- Table 49: India Computed Tomography Market in France Revenue (Million) Forecast, by Application 2019 & 2032
- Table 50: Japan Computed Tomography Market in France Revenue (Million) Forecast, by Application 2019 & 2032
- Table 51: South Korea Computed Tomography Market in France Revenue (Million) Forecast, by Application 2019 & 2032
- Table 52: ASEAN Computed Tomography Market in France Revenue (Million) Forecast, by Application 2019 & 2032
- Table 53: Oceania Computed Tomography Market in France Revenue (Million) Forecast, by Application 2019 & 2032
- Table 54: Rest of Asia Pacific Computed Tomography Market in France Revenue (Million) Forecast, by Application 2019 & 2032
Frequently Asked Questions
1. What is the projected Compound Annual Growth Rate (CAGR) of the Computed Tomography Market in France?
The projected CAGR is approximately 6.08%.
2. Which companies are prominent players in the Computed Tomography Market in France?
Key companies in the market include GE Healthcare, Koning corporation, Siemens Healthineers AG, Canon Medical Systems Corporation (Toshiba Corporation), Neusoft Medical Systems Co Ltd, Carestream Health, Koninklijke Philips NV, J Morita Corporation, Planmeca Group (Planmed OY), SAMSUNG ELECTRONICS CO LTD (SAMSUNG MEDISON), Fujifilm Holdings Corporation.
3. What are the main segments of the Computed Tomography Market in France?
The market segments include Type, Application, End User.
4. Can you provide details about the market size?
The market size is estimated to be USD 397.45 Million as of 2022.
5. What are some drivers contributing to market growth?
Increasing Prevalence of Chronic Diseases; Rising Geriatric Population; Increasing Technological Advancements.
6. What are the notable trends driving market growth?
Oncology Segment is Expected to Hold a Significant Market Share Over the Forecast Period.
7. Are there any restraints impacting market growth?
Lack Of Proper Reimbursement And Stringent Regulatory Approval Procedures; High Cost of Equipment.
8. Can you provide examples of recent developments in the market?
In November 2021, Siemens Healthineers launched the NAEOTOM Alpha, the world's first photon-counting CT scanner, and the device was made available across Europe.
9. What pricing options are available for accessing the report?
Pricing options include single-user, multi-user, and enterprise licenses priced at USD 3800, USD 4500, and USD 5800 respectively.
10. Is the market size provided in terms of value or volume?
The market size is provided in terms of value, measured in Million.
11. Are there any specific market keywords associated with the report?
Yes, the market keyword associated with the report is "Computed Tomography Market in France," which aids in identifying and referencing the specific market segment covered.
12. How do I determine which pricing option suits my needs best?
The pricing options vary based on user requirements and access needs. Individual users may opt for single-user licenses, while businesses requiring broader access may choose multi-user or enterprise licenses for cost-effective access to the report.
13. Are there any additional resources or data provided in the Computed Tomography Market in France report?
While the report offers comprehensive insights, it's advisable to review the specific contents or supplementary materials provided to ascertain if additional resources or data are available.
14. How can I stay updated on further developments or reports in the Computed Tomography Market in France?
To stay informed about further developments, trends, and reports in the Computed Tomography Market in France, consider subscribing to industry newsletters, following relevant companies and organizations, or regularly checking reputable industry news sources and publications.
Methodology
Step 1 - Identification of Relevant Samples Size from Population Database


Step 2 - Approaches for Defining Global Market Size (Value, Volume* & Price*)

Note*: In applicable scenarios
Step 3 - Data Sources
Primary Research
- Web Analytics
- Survey Reports
- Research Institute
- Latest Research Reports
- Opinion Leaders
Secondary Research
- Annual Reports
- White Paper
- Latest Press Release
- Industry Association
- Paid Database
- Investor Presentations

Step 4 - Data Triangulation
Involves using different sources of information in order to increase the validity of a study
These sources are likely to be stakeholders in a program - participants, other researchers, program staff, other community members, and so on.
Then we put all data in single framework & apply various statistical tools to find out the dynamic on the market.
During the analysis stage, feedback from the stakeholder groups would be compared to determine areas of agreement as well as areas of divergence
