

Key Insights
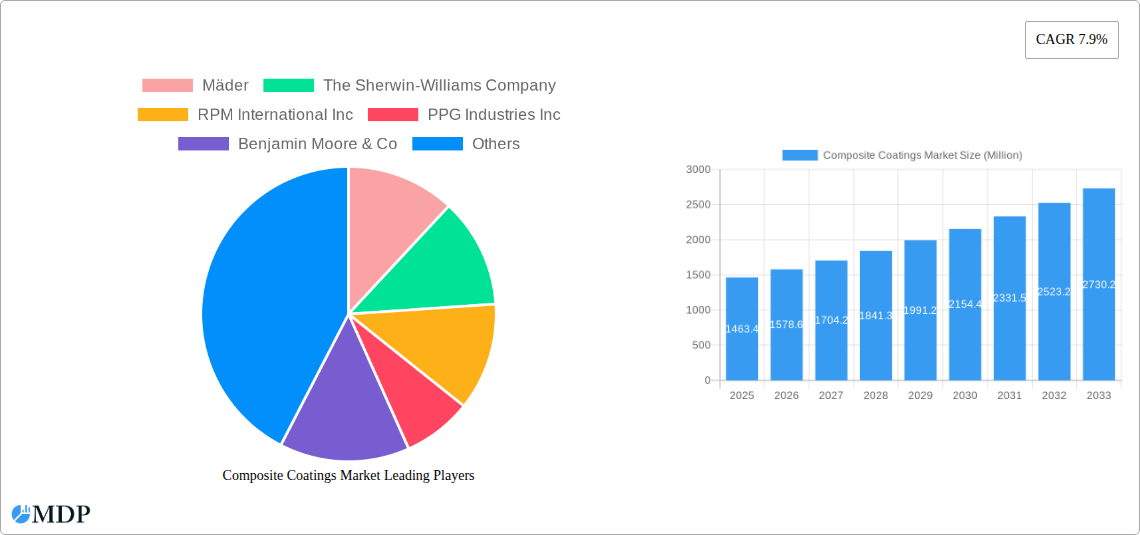
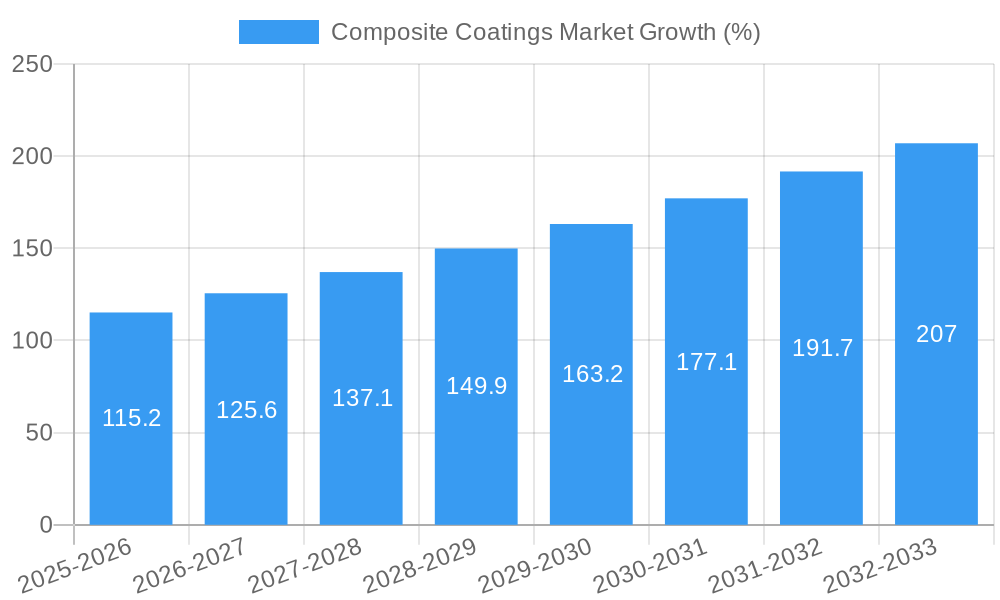
The global composite coatings market, valued at $1463.4 million in 2025, is projected to experience robust growth, driven by the increasing demand across diverse end-user industries. A Compound Annual Growth Rate (CAGR) of 7.9% from 2025 to 2033 indicates a significant expansion, reaching an estimated market value exceeding $2800 million by 2033. This growth is fueled by several key factors. The automotive and transportation sector's continuous adoption of lightweight and high-performance composite materials necessitates advanced coatings for protection and enhanced aesthetics. Similarly, the infrastructure sector's rising use of composites in construction and infrastructure projects is creating significant demand. The marine industry's need for corrosion-resistant coatings further contributes to market expansion. Technological advancements in coating techniques, such as laser-melt injection and electroless plating, are improving coating quality and efficiency, driving market growth. The prevalence of polyester resins in composite coatings currently dominates the market, while epoxy and polyamide resins are witnessing substantial growth due to their superior properties. However, the market faces some challenges, including the relatively high cost of certain composite materials and coatings, and concerns regarding the environmental impact of some coating processes. Nevertheless, ongoing research and development focusing on sustainable and cost-effective solutions are likely to mitigate these restraints.
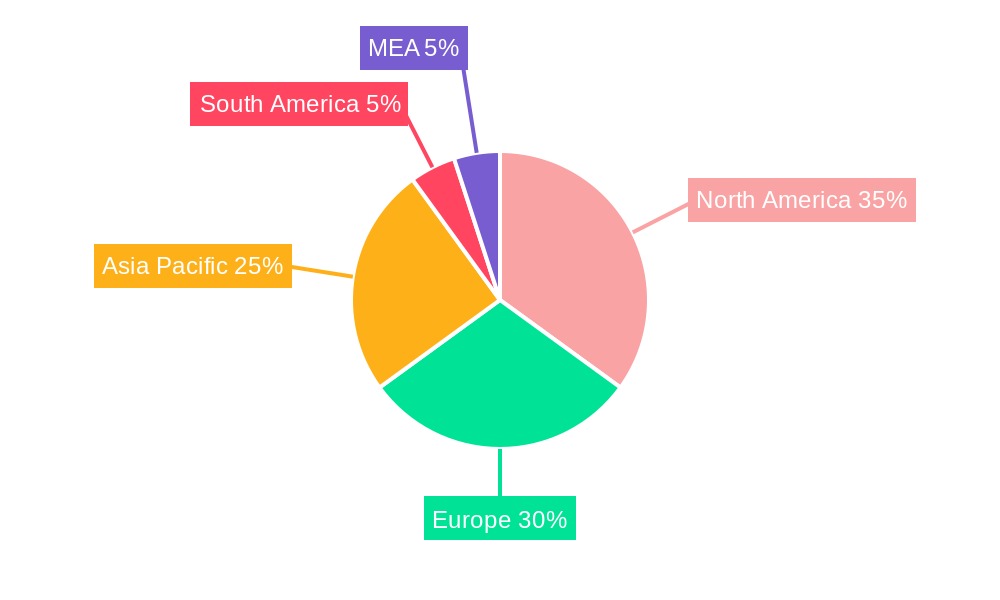
The market is geographically diverse, with North America and Europe holding significant market shares initially. However, the Asia-Pacific region is expected to experience the fastest growth during the forecast period, driven by rapid industrialization and infrastructure development in countries like China and India. Key players in the market, including Sherwin-Williams, PPG Industries, and AkzoNobel, are investing heavily in research and development to offer innovative products and expand their market presence. Competitive strategies such as mergers and acquisitions, product diversification, and strategic partnerships are expected to shape the market landscape in the coming years. The ongoing focus on improving the durability, performance, and sustainability of composite coatings will further propel market expansion throughout the forecast period.
Composite Coatings Market: A Comprehensive Analysis (2019-2033)
This comprehensive report provides an in-depth analysis of the global Composite Coatings Market, offering valuable insights for industry stakeholders, investors, and strategic decision-makers. The study covers the period from 2019 to 2033, with a focus on the forecast period of 2025-2033 and a base year of 2025. We project a market valued at xx Million in 2025, poised for significant growth driven by key technological advancements and expanding end-user applications. This report meticulously examines market dynamics, leading players, emerging trends, and future opportunities. High-impact keywords include: Composite Coatings, Polyester Resin, Epoxy Resin, Polyamide Resin, Laser-melt Injection, Electroless Plating, Marine Coatings, Automotive Coatings, Infrastructure Coatings, Market Growth, Market Share, CAGR, Industry Analysis.
Composite Coatings Market Market Dynamics & Concentration
The Composite Coatings market exhibits a moderately consolidated landscape, with several key players holding significant market share. The market share of the top five players is estimated at xx%, indicative of both competition and opportunities for smaller players to carve out niches. Innovation is a key driver, with companies continuously developing advanced coatings to improve performance characteristics like durability, corrosion resistance, and aesthetic appeal. Stringent regulatory frameworks, particularly concerning environmental concerns and worker safety, impact both production methods and material composition. The market sees ongoing M&A activity, with xx deals recorded between 2019 and 2024, largely driven by the desire to expand product portfolios and geographic reach. Product substitutes, such as traditional paint systems, still exist but face growing competition from the superior performance and longevity of composite coatings. End-user trends favor high-performance, sustainable, and cost-effective solutions, accelerating the demand for composite coatings in various sectors.
- Market Concentration: Top 5 players hold approximately xx% market share.
- M&A Activity: xx deals between 2019 and 2024.
- Regulatory Impact: Stringent environmental regulations driving innovation towards sustainable solutions.
- End-user trends: Growing preference for high-performance, durable, and eco-friendly coatings.
Composite Coatings Market Industry Trends & Analysis
The Composite Coatings market is experiencing robust growth, fueled by a CAGR of xx% during the forecast period (2025-2033). This expansion is driven by several factors: Increasing demand from the automotive and marine sectors for lightweight, high-strength materials; a growing focus on infrastructure development globally, requiring durable and protective coatings; and the rise of advanced coating technologies that enhance performance and aesthetics. Technological advancements in resin formulations and application techniques, like Laser-melt Injection and Electroless Plating, are transforming the industry. Consumer preference for aesthetically pleasing and sustainable products is also a key driver. The competitive landscape is dynamic, with companies focusing on innovation, strategic partnerships, and geographical expansion to gain a competitive edge. Market penetration is steadily increasing across various end-user industries, with particularly strong growth observed in the xx and xx sectors.
Leading Markets & Segments in Composite Coatings Market
The xx region dominates the global Composite Coatings market, accounting for approximately xx% of the total market revenue in 2025. This dominance is attributed to several factors:
- Key Drivers in xx Region:
- Robust infrastructure development projects.
- Strong growth in the automotive and marine sectors.
- Favorable government policies supporting industrial growth.
Within the segments, Polyester resin holds the largest market share in terms of resin type due to its cost-effectiveness and versatility. Electroless plating is the leading application technique, owing to its ability to produce uniform and high-quality coatings. The marine end-user industry currently shows the highest demand for composite coatings, followed by the automotive sector. This high demand is driven by the increasing need for corrosion protection and enhanced durability in harsh operating environments. The Infrastructure sector is poised for significant growth in the coming years due to large-scale infrastructure projects worldwide.
Composite Coatings Market Product Developments
Recent product innovations focus on developing environmentally friendly, high-performance coatings with enhanced durability, corrosion resistance, and UV protection. New resin formulations are being developed to improve adhesion, flexibility, and chemical resistance. Furthermore, advancements in application techniques, such as robotic spray systems and automated processes, are improving efficiency and consistency. These developments cater to the growing demand for sustainable, high-quality composite coatings across various industries.
Key Drivers of Composite Coatings Market Growth
The growth of the Composite Coatings market is driven by several factors: the rising demand for lightweight and high-strength materials in the automotive and aerospace sectors, the increasing need for corrosion protection and durability in infrastructure projects, and the expanding use of composite materials in the marine and oil & gas industries. Government regulations promoting sustainable and eco-friendly products are also boosting the demand for advanced composite coatings. Technological advancements in resin formulations and application techniques contribute to improved performance and efficiency.
Challenges in the Composite Coatings Market Market
The Composite Coatings market faces several challenges: Fluctuations in raw material prices can impact production costs and profitability. Stringent environmental regulations necessitate compliance with emission standards and waste management practices, adding to operational complexities. Intense competition from existing and new market entrants puts pressure on pricing and margins. Supply chain disruptions can hinder production and delivery timelines. The overall effect of these factors is estimated to restrain market growth by approximately xx% in 2025.
Emerging Opportunities in Composite Coatings Market
The Composite Coatings market presents significant growth opportunities. Technological breakthroughs in nano-coatings and bio-based resins offer avenues for developing superior and sustainable products. Strategic partnerships and collaborations between coating manufacturers and composite material suppliers can create synergistic benefits. Expanding into emerging markets with significant infrastructure development plans presents substantial market potential. These opportunities promise to drive long-term growth and innovation within the industry.
Leading Players in the Composite Coatings Market Sector
- Mäder
- The Sherwin-Williams Company
- RPM International Inc
- PPG Industries Inc
- Benjamin Moore & Co
- AkzoNobel NV
- FUSION MINERAL PAINT
- KEIM Mineral Coatings of America Inc
- K C Jones Plating Company
- BEECK Mineral Paints
Key Milestones in Composite Coatings Market Industry
- 2020: Introduction of a new, environmentally friendly epoxy resin by PPG Industries Inc.
- 2021: AkzoNobel NV acquires a smaller coating manufacturer, expanding its product portfolio.
- 2022: Development of a self-healing composite coating technology by a research institute.
- 2023: Implementation of stricter environmental regulations in the EU impacting composite coating production.
- 2024: Launch of a new laser-melt injection system by a leading equipment manufacturer.
Strategic Outlook for Composite Coatings Market Market
The Composite Coatings market is poised for sustained growth, driven by technological advancements, expanding applications, and robust demand from key end-user industries. Companies focusing on innovation, sustainability, and strategic partnerships will be well-positioned to capture significant market share. The development of new, high-performance coatings tailored to specific industry needs will be crucial for success. The market presents a compelling opportunity for both established players and new entrants to drive innovation and capture a share of the growing demand.
Composite Coatings Market Segmentation
-
1. Resin
- 1.1. Polyester
- 1.2. Polyamide
- 1.3. Epoxy
- 1.4. Others
-
2. Technique
- 2.1. Laser-melt Injection
- 2.2. Electroless Plating
- 2.3. Brazing
- 2.4. Others
-
3. End-User Industry
- 3.1. Marine
- 3.2. Automotive and Other Transportation
- 3.3. Infrastructure
- 3.4. Oil and Gas
- 3.5. Others (Including Medical)
Composite Coatings Market Segmentation By Geography
-
1. Asia Pacific
- 1.1. China
- 1.2. India
- 1.3. Japan
- 1.4. South Korea
- 1.5. Rest of Asia Pacific
-
2. North America
- 2.1. United States
- 2.2. Canada
- 2.3. Mexico
-
3. Europe
- 3.1. Germany
- 3.2. United Kingdom
- 3.3. Italy
- 3.4. France
- 3.5. Rest of Europe
-
4. South America
- 4.1. Brazil
- 4.2. Argentina
- 4.3. Rest of South America
- 5. Middle East
-
6. Saudi Arabia
- 6.1. South Africa
- 6.2. Rest of Middle East
Composite Coatings Market REPORT HIGHLIGHTS
| Aspects | Details |
|---|---|
| Study Period | 2019-2033 |
| Base Year | 2024 |
| Estimated Year | 2025 |
| Forecast Period | 2025-2033 |
| Historical Period | 2019-2024 |
| Growth Rate | CAGR of 7.9% from 2019-2033 |
| Segmentation |
|
Table of Contents
- 1. Introduction
- 1.1. Research Scope
- 1.2. Market Segmentation
- 1.3. Research Methodology
- 1.4. Definitions and Assumptions
- 2. Executive Summary
- 2.1. Introduction
- 3. Market Dynamics
- 3.1. Introduction
- 3.2. Market Drivers
- 3.2.1. ; Growth in Oil & Gas Exploration Activities; Others
- 3.3. Market Restrains
- 3.3.1. ; High Processing Cost
- 3.4. Market Trends
- 3.4.1. Increasing Demand for Oil and Gas
- 4. Market Factor Analysis
- 4.1. Porters Five Forces
- 4.2. Supply/Value Chain
- 4.3. PESTEL analysis
- 4.4. Market Entropy
- 4.5. Patent/Trademark Analysis
- 5. Global Composite Coatings Market Analysis, Insights and Forecast, 2019-2031
- 5.1. Market Analysis, Insights and Forecast - by Resin
- 5.1.1. Polyester
- 5.1.2. Polyamide
- 5.1.3. Epoxy
- 5.1.4. Others
- 5.2. Market Analysis, Insights and Forecast - by Technique
- 5.2.1. Laser-melt Injection
- 5.2.2. Electroless Plating
- 5.2.3. Brazing
- 5.2.4. Others
- 5.3. Market Analysis, Insights and Forecast - by End-User Industry
- 5.3.1. Marine
- 5.3.2. Automotive and Other Transportation
- 5.3.3. Infrastructure
- 5.3.4. Oil and Gas
- 5.3.5. Others (Including Medical)
- 5.4. Market Analysis, Insights and Forecast - by Region
- 5.4.1. Asia Pacific
- 5.4.2. North America
- 5.4.3. Europe
- 5.4.4. South America
- 5.4.5. Middle East
- 5.4.6. Saudi Arabia
- 5.1. Market Analysis, Insights and Forecast - by Resin
- 6. Asia Pacific Composite Coatings Market Analysis, Insights and Forecast, 2019-2031
- 6.1. Market Analysis, Insights and Forecast - by Resin
- 6.1.1. Polyester
- 6.1.2. Polyamide
- 6.1.3. Epoxy
- 6.1.4. Others
- 6.2. Market Analysis, Insights and Forecast - by Technique
- 6.2.1. Laser-melt Injection
- 6.2.2. Electroless Plating
- 6.2.3. Brazing
- 6.2.4. Others
- 6.3. Market Analysis, Insights and Forecast - by End-User Industry
- 6.3.1. Marine
- 6.3.2. Automotive and Other Transportation
- 6.3.3. Infrastructure
- 6.3.4. Oil and Gas
- 6.3.5. Others (Including Medical)
- 6.1. Market Analysis, Insights and Forecast - by Resin
- 7. North America Composite Coatings Market Analysis, Insights and Forecast, 2019-2031
- 7.1. Market Analysis, Insights and Forecast - by Resin
- 7.1.1. Polyester
- 7.1.2. Polyamide
- 7.1.3. Epoxy
- 7.1.4. Others
- 7.2. Market Analysis, Insights and Forecast - by Technique
- 7.2.1. Laser-melt Injection
- 7.2.2. Electroless Plating
- 7.2.3. Brazing
- 7.2.4. Others
- 7.3. Market Analysis, Insights and Forecast - by End-User Industry
- 7.3.1. Marine
- 7.3.2. Automotive and Other Transportation
- 7.3.3. Infrastructure
- 7.3.4. Oil and Gas
- 7.3.5. Others (Including Medical)
- 7.1. Market Analysis, Insights and Forecast - by Resin
- 8. Europe Composite Coatings Market Analysis, Insights and Forecast, 2019-2031
- 8.1. Market Analysis, Insights and Forecast - by Resin
- 8.1.1. Polyester
- 8.1.2. Polyamide
- 8.1.3. Epoxy
- 8.1.4. Others
- 8.2. Market Analysis, Insights and Forecast - by Technique
- 8.2.1. Laser-melt Injection
- 8.2.2. Electroless Plating
- 8.2.3. Brazing
- 8.2.4. Others
- 8.3. Market Analysis, Insights and Forecast - by End-User Industry
- 8.3.1. Marine
- 8.3.2. Automotive and Other Transportation
- 8.3.3. Infrastructure
- 8.3.4. Oil and Gas
- 8.3.5. Others (Including Medical)
- 8.1. Market Analysis, Insights and Forecast - by Resin
- 9. South America Composite Coatings Market Analysis, Insights and Forecast, 2019-2031
- 9.1. Market Analysis, Insights and Forecast - by Resin
- 9.1.1. Polyester
- 9.1.2. Polyamide
- 9.1.3. Epoxy
- 9.1.4. Others
- 9.2. Market Analysis, Insights and Forecast - by Technique
- 9.2.1. Laser-melt Injection
- 9.2.2. Electroless Plating
- 9.2.3. Brazing
- 9.2.4. Others
- 9.3. Market Analysis, Insights and Forecast - by End-User Industry
- 9.3.1. Marine
- 9.3.2. Automotive and Other Transportation
- 9.3.3. Infrastructure
- 9.3.4. Oil and Gas
- 9.3.5. Others (Including Medical)
- 9.1. Market Analysis, Insights and Forecast - by Resin
- 10. Middle East Composite Coatings Market Analysis, Insights and Forecast, 2019-2031
- 10.1. Market Analysis, Insights and Forecast - by Resin
- 10.1.1. Polyester
- 10.1.2. Polyamide
- 10.1.3. Epoxy
- 10.1.4. Others
- 10.2. Market Analysis, Insights and Forecast - by Technique
- 10.2.1. Laser-melt Injection
- 10.2.2. Electroless Plating
- 10.2.3. Brazing
- 10.2.4. Others
- 10.3. Market Analysis, Insights and Forecast - by End-User Industry
- 10.3.1. Marine
- 10.3.2. Automotive and Other Transportation
- 10.3.3. Infrastructure
- 10.3.4. Oil and Gas
- 10.3.5. Others (Including Medical)
- 10.1. Market Analysis, Insights and Forecast - by Resin
- 11. Saudi Arabia Composite Coatings Market Analysis, Insights and Forecast, 2019-2031
- 11.1. Market Analysis, Insights and Forecast - by Resin
- 11.1.1. Polyester
- 11.1.2. Polyamide
- 11.1.3. Epoxy
- 11.1.4. Others
- 11.2. Market Analysis, Insights and Forecast - by Technique
- 11.2.1. Laser-melt Injection
- 11.2.2. Electroless Plating
- 11.2.3. Brazing
- 11.2.4. Others
- 11.3. Market Analysis, Insights and Forecast - by End-User Industry
- 11.3.1. Marine
- 11.3.2. Automotive and Other Transportation
- 11.3.3. Infrastructure
- 11.3.4. Oil and Gas
- 11.3.5. Others (Including Medical)
- 11.1. Market Analysis, Insights and Forecast - by Resin
- 12. North America Composite Coatings Market Analysis, Insights and Forecast, 2019-2031
- 12.1. Market Analysis, Insights and Forecast - By Country/Sub-region
- 12.1.1 United States
- 12.1.2 Canada
- 12.1.3 Mexico
- 13. Europe Composite Coatings Market Analysis, Insights and Forecast, 2019-2031
- 13.1. Market Analysis, Insights and Forecast - By Country/Sub-region
- 13.1.1 Germany
- 13.1.2 France
- 13.1.3 Italy
- 13.1.4 United Kingdom
- 13.1.5 Netherlands
- 13.1.6 Rest of Europe
- 14. Asia Pacific Composite Coatings Market Analysis, Insights and Forecast, 2019-2031
- 14.1. Market Analysis, Insights and Forecast - By Country/Sub-region
- 14.1.1 China
- 14.1.2 Japan
- 14.1.3 India
- 14.1.4 South Korea
- 14.1.5 Taiwan
- 14.1.6 Australia
- 14.1.7 Rest of Asia-Pacific
- 15. South America Composite Coatings Market Analysis, Insights and Forecast, 2019-2031
- 15.1. Market Analysis, Insights and Forecast - By Country/Sub-region
- 15.1.1 Brazil
- 15.1.2 Argentina
- 15.1.3 Rest of South America
- 16. MEA Composite Coatings Market Analysis, Insights and Forecast, 2019-2031
- 16.1. Market Analysis, Insights and Forecast - By Country/Sub-region
- 16.1.1 Middle East
- 16.1.2 Africa
- 17. Competitive Analysis
- 17.1. Global Market Share Analysis 2024
- 17.2. Company Profiles
- 17.2.1 Mäder
- 17.2.1.1. Overview
- 17.2.1.2. Products
- 17.2.1.3. SWOT Analysis
- 17.2.1.4. Recent Developments
- 17.2.1.5. Financials (Based on Availability)
- 17.2.2 The Sherwin-Williams Company
- 17.2.2.1. Overview
- 17.2.2.2. Products
- 17.2.2.3. SWOT Analysis
- 17.2.2.4. Recent Developments
- 17.2.2.5. Financials (Based on Availability)
- 17.2.3 RPM International Inc
- 17.2.3.1. Overview
- 17.2.3.2. Products
- 17.2.3.3. SWOT Analysis
- 17.2.3.4. Recent Developments
- 17.2.3.5. Financials (Based on Availability)
- 17.2.4 PPG Industries Inc
- 17.2.4.1. Overview
- 17.2.4.2. Products
- 17.2.4.3. SWOT Analysis
- 17.2.4.4. Recent Developments
- 17.2.4.5. Financials (Based on Availability)
- 17.2.5 Benjamin Moore & Co
- 17.2.5.1. Overview
- 17.2.5.2. Products
- 17.2.5.3. SWOT Analysis
- 17.2.5.4. Recent Developments
- 17.2.5.5. Financials (Based on Availability)
- 17.2.6 AkzoNobel NV
- 17.2.6.1. Overview
- 17.2.6.2. Products
- 17.2.6.3. SWOT Analysis
- 17.2.6.4. Recent Developments
- 17.2.6.5. Financials (Based on Availability)
- 17.2.7 FUSION MINERAL PAINT
- 17.2.7.1. Overview
- 17.2.7.2. Products
- 17.2.7.3. SWOT Analysis
- 17.2.7.4. Recent Developments
- 17.2.7.5. Financials (Based on Availability)
- 17.2.8 KEIM Mineral Coatings of America Inc
- 17.2.8.1. Overview
- 17.2.8.2. Products
- 17.2.8.3. SWOT Analysis
- 17.2.8.4. Recent Developments
- 17.2.8.5. Financials (Based on Availability)
- 17.2.9 K C Jones Plating Company
- 17.2.9.1. Overview
- 17.2.9.2. Products
- 17.2.9.3. SWOT Analysis
- 17.2.9.4. Recent Developments
- 17.2.9.5. Financials (Based on Availability)
- 17.2.10 BEECK Mineral Paints
- 17.2.10.1. Overview
- 17.2.10.2. Products
- 17.2.10.3. SWOT Analysis
- 17.2.10.4. Recent Developments
- 17.2.10.5. Financials (Based on Availability)
- 17.2.1 Mäder
List of Figures
- Figure 1: Global Composite Coatings Market Revenue Breakdown (Million, %) by Region 2024 & 2032
- Figure 2: Global Composite Coatings Market Volume Breakdown (K Tons, %) by Region 2024 & 2032
- Figure 3: North America Composite Coatings Market Revenue (Million), by Country 2024 & 2032
- Figure 4: North America Composite Coatings Market Volume (K Tons), by Country 2024 & 2032
- Figure 5: North America Composite Coatings Market Revenue Share (%), by Country 2024 & 2032
- Figure 6: North America Composite Coatings Market Volume Share (%), by Country 2024 & 2032
- Figure 7: Europe Composite Coatings Market Revenue (Million), by Country 2024 & 2032
- Figure 8: Europe Composite Coatings Market Volume (K Tons), by Country 2024 & 2032
- Figure 9: Europe Composite Coatings Market Revenue Share (%), by Country 2024 & 2032
- Figure 10: Europe Composite Coatings Market Volume Share (%), by Country 2024 & 2032
- Figure 11: Asia Pacific Composite Coatings Market Revenue (Million), by Country 2024 & 2032
- Figure 12: Asia Pacific Composite Coatings Market Volume (K Tons), by Country 2024 & 2032
- Figure 13: Asia Pacific Composite Coatings Market Revenue Share (%), by Country 2024 & 2032
- Figure 14: Asia Pacific Composite Coatings Market Volume Share (%), by Country 2024 & 2032
- Figure 15: South America Composite Coatings Market Revenue (Million), by Country 2024 & 2032
- Figure 16: South America Composite Coatings Market Volume (K Tons), by Country 2024 & 2032
- Figure 17: South America Composite Coatings Market Revenue Share (%), by Country 2024 & 2032
- Figure 18: South America Composite Coatings Market Volume Share (%), by Country 2024 & 2032
- Figure 19: MEA Composite Coatings Market Revenue (Million), by Country 2024 & 2032
- Figure 20: MEA Composite Coatings Market Volume (K Tons), by Country 2024 & 2032
- Figure 21: MEA Composite Coatings Market Revenue Share (%), by Country 2024 & 2032
- Figure 22: MEA Composite Coatings Market Volume Share (%), by Country 2024 & 2032
- Figure 23: Asia Pacific Composite Coatings Market Revenue (Million), by Resin 2024 & 2032
- Figure 24: Asia Pacific Composite Coatings Market Volume (K Tons), by Resin 2024 & 2032
- Figure 25: Asia Pacific Composite Coatings Market Revenue Share (%), by Resin 2024 & 2032
- Figure 26: Asia Pacific Composite Coatings Market Volume Share (%), by Resin 2024 & 2032
- Figure 27: Asia Pacific Composite Coatings Market Revenue (Million), by Technique 2024 & 2032
- Figure 28: Asia Pacific Composite Coatings Market Volume (K Tons), by Technique 2024 & 2032
- Figure 29: Asia Pacific Composite Coatings Market Revenue Share (%), by Technique 2024 & 2032
- Figure 30: Asia Pacific Composite Coatings Market Volume Share (%), by Technique 2024 & 2032
- Figure 31: Asia Pacific Composite Coatings Market Revenue (Million), by End-User Industry 2024 & 2032
- Figure 32: Asia Pacific Composite Coatings Market Volume (K Tons), by End-User Industry 2024 & 2032
- Figure 33: Asia Pacific Composite Coatings Market Revenue Share (%), by End-User Industry 2024 & 2032
- Figure 34: Asia Pacific Composite Coatings Market Volume Share (%), by End-User Industry 2024 & 2032
- Figure 35: Asia Pacific Composite Coatings Market Revenue (Million), by Country 2024 & 2032
- Figure 36: Asia Pacific Composite Coatings Market Volume (K Tons), by Country 2024 & 2032
- Figure 37: Asia Pacific Composite Coatings Market Revenue Share (%), by Country 2024 & 2032
- Figure 38: Asia Pacific Composite Coatings Market Volume Share (%), by Country 2024 & 2032
- Figure 39: North America Composite Coatings Market Revenue (Million), by Resin 2024 & 2032
- Figure 40: North America Composite Coatings Market Volume (K Tons), by Resin 2024 & 2032
- Figure 41: North America Composite Coatings Market Revenue Share (%), by Resin 2024 & 2032
- Figure 42: North America Composite Coatings Market Volume Share (%), by Resin 2024 & 2032
- Figure 43: North America Composite Coatings Market Revenue (Million), by Technique 2024 & 2032
- Figure 44: North America Composite Coatings Market Volume (K Tons), by Technique 2024 & 2032
- Figure 45: North America Composite Coatings Market Revenue Share (%), by Technique 2024 & 2032
- Figure 46: North America Composite Coatings Market Volume Share (%), by Technique 2024 & 2032
- Figure 47: North America Composite Coatings Market Revenue (Million), by End-User Industry 2024 & 2032
- Figure 48: North America Composite Coatings Market Volume (K Tons), by End-User Industry 2024 & 2032
- Figure 49: North America Composite Coatings Market Revenue Share (%), by End-User Industry 2024 & 2032
- Figure 50: North America Composite Coatings Market Volume Share (%), by End-User Industry 2024 & 2032
- Figure 51: North America Composite Coatings Market Revenue (Million), by Country 2024 & 2032
- Figure 52: North America Composite Coatings Market Volume (K Tons), by Country 2024 & 2032
- Figure 53: North America Composite Coatings Market Revenue Share (%), by Country 2024 & 2032
- Figure 54: North America Composite Coatings Market Volume Share (%), by Country 2024 & 2032
- Figure 55: Europe Composite Coatings Market Revenue (Million), by Resin 2024 & 2032
- Figure 56: Europe Composite Coatings Market Volume (K Tons), by Resin 2024 & 2032
- Figure 57: Europe Composite Coatings Market Revenue Share (%), by Resin 2024 & 2032
- Figure 58: Europe Composite Coatings Market Volume Share (%), by Resin 2024 & 2032
- Figure 59: Europe Composite Coatings Market Revenue (Million), by Technique 2024 & 2032
- Figure 60: Europe Composite Coatings Market Volume (K Tons), by Technique 2024 & 2032
- Figure 61: Europe Composite Coatings Market Revenue Share (%), by Technique 2024 & 2032
- Figure 62: Europe Composite Coatings Market Volume Share (%), by Technique 2024 & 2032
- Figure 63: Europe Composite Coatings Market Revenue (Million), by End-User Industry 2024 & 2032
- Figure 64: Europe Composite Coatings Market Volume (K Tons), by End-User Industry 2024 & 2032
- Figure 65: Europe Composite Coatings Market Revenue Share (%), by End-User Industry 2024 & 2032
- Figure 66: Europe Composite Coatings Market Volume Share (%), by End-User Industry 2024 & 2032
- Figure 67: Europe Composite Coatings Market Revenue (Million), by Country 2024 & 2032
- Figure 68: Europe Composite Coatings Market Volume (K Tons), by Country 2024 & 2032
- Figure 69: Europe Composite Coatings Market Revenue Share (%), by Country 2024 & 2032
- Figure 70: Europe Composite Coatings Market Volume Share (%), by Country 2024 & 2032
- Figure 71: South America Composite Coatings Market Revenue (Million), by Resin 2024 & 2032
- Figure 72: South America Composite Coatings Market Volume (K Tons), by Resin 2024 & 2032
- Figure 73: South America Composite Coatings Market Revenue Share (%), by Resin 2024 & 2032
- Figure 74: South America Composite Coatings Market Volume Share (%), by Resin 2024 & 2032
- Figure 75: South America Composite Coatings Market Revenue (Million), by Technique 2024 & 2032
- Figure 76: South America Composite Coatings Market Volume (K Tons), by Technique 2024 & 2032
- Figure 77: South America Composite Coatings Market Revenue Share (%), by Technique 2024 & 2032
- Figure 78: South America Composite Coatings Market Volume Share (%), by Technique 2024 & 2032
- Figure 79: South America Composite Coatings Market Revenue (Million), by End-User Industry 2024 & 2032
- Figure 80: South America Composite Coatings Market Volume (K Tons), by End-User Industry 2024 & 2032
- Figure 81: South America Composite Coatings Market Revenue Share (%), by End-User Industry 2024 & 2032
- Figure 82: South America Composite Coatings Market Volume Share (%), by End-User Industry 2024 & 2032
- Figure 83: South America Composite Coatings Market Revenue (Million), by Country 2024 & 2032
- Figure 84: South America Composite Coatings Market Volume (K Tons), by Country 2024 & 2032
- Figure 85: South America Composite Coatings Market Revenue Share (%), by Country 2024 & 2032
- Figure 86: South America Composite Coatings Market Volume Share (%), by Country 2024 & 2032
- Figure 87: Middle East Composite Coatings Market Revenue (Million), by Resin 2024 & 2032
- Figure 88: Middle East Composite Coatings Market Volume (K Tons), by Resin 2024 & 2032
- Figure 89: Middle East Composite Coatings Market Revenue Share (%), by Resin 2024 & 2032
- Figure 90: Middle East Composite Coatings Market Volume Share (%), by Resin 2024 & 2032
- Figure 91: Middle East Composite Coatings Market Revenue (Million), by Technique 2024 & 2032
- Figure 92: Middle East Composite Coatings Market Volume (K Tons), by Technique 2024 & 2032
- Figure 93: Middle East Composite Coatings Market Revenue Share (%), by Technique 2024 & 2032
- Figure 94: Middle East Composite Coatings Market Volume Share (%), by Technique 2024 & 2032
- Figure 95: Middle East Composite Coatings Market Revenue (Million), by End-User Industry 2024 & 2032
- Figure 96: Middle East Composite Coatings Market Volume (K Tons), by End-User Industry 2024 & 2032
- Figure 97: Middle East Composite Coatings Market Revenue Share (%), by End-User Industry 2024 & 2032
- Figure 98: Middle East Composite Coatings Market Volume Share (%), by End-User Industry 2024 & 2032
- Figure 99: Middle East Composite Coatings Market Revenue (Million), by Country 2024 & 2032
- Figure 100: Middle East Composite Coatings Market Volume (K Tons), by Country 2024 & 2032
- Figure 101: Middle East Composite Coatings Market Revenue Share (%), by Country 2024 & 2032
- Figure 102: Middle East Composite Coatings Market Volume Share (%), by Country 2024 & 2032
- Figure 103: Saudi Arabia Composite Coatings Market Revenue (Million), by Resin 2024 & 2032
- Figure 104: Saudi Arabia Composite Coatings Market Volume (K Tons), by Resin 2024 & 2032
- Figure 105: Saudi Arabia Composite Coatings Market Revenue Share (%), by Resin 2024 & 2032
- Figure 106: Saudi Arabia Composite Coatings Market Volume Share (%), by Resin 2024 & 2032
- Figure 107: Saudi Arabia Composite Coatings Market Revenue (Million), by Technique 2024 & 2032
- Figure 108: Saudi Arabia Composite Coatings Market Volume (K Tons), by Technique 2024 & 2032
- Figure 109: Saudi Arabia Composite Coatings Market Revenue Share (%), by Technique 2024 & 2032
- Figure 110: Saudi Arabia Composite Coatings Market Volume Share (%), by Technique 2024 & 2032
- Figure 111: Saudi Arabia Composite Coatings Market Revenue (Million), by End-User Industry 2024 & 2032
- Figure 112: Saudi Arabia Composite Coatings Market Volume (K Tons), by End-User Industry 2024 & 2032
- Figure 113: Saudi Arabia Composite Coatings Market Revenue Share (%), by End-User Industry 2024 & 2032
- Figure 114: Saudi Arabia Composite Coatings Market Volume Share (%), by End-User Industry 2024 & 2032
- Figure 115: Saudi Arabia Composite Coatings Market Revenue (Million), by Country 2024 & 2032
- Figure 116: Saudi Arabia Composite Coatings Market Volume (K Tons), by Country 2024 & 2032
- Figure 117: Saudi Arabia Composite Coatings Market Revenue Share (%), by Country 2024 & 2032
- Figure 118: Saudi Arabia Composite Coatings Market Volume Share (%), by Country 2024 & 2032
List of Tables
- Table 1: Global Composite Coatings Market Revenue Million Forecast, by Region 2019 & 2032
- Table 2: Global Composite Coatings Market Volume K Tons Forecast, by Region 2019 & 2032
- Table 3: Global Composite Coatings Market Revenue Million Forecast, by Resin 2019 & 2032
- Table 4: Global Composite Coatings Market Volume K Tons Forecast, by Resin 2019 & 2032
- Table 5: Global Composite Coatings Market Revenue Million Forecast, by Technique 2019 & 2032
- Table 6: Global Composite Coatings Market Volume K Tons Forecast, by Technique 2019 & 2032
- Table 7: Global Composite Coatings Market Revenue Million Forecast, by End-User Industry 2019 & 2032
- Table 8: Global Composite Coatings Market Volume K Tons Forecast, by End-User Industry 2019 & 2032
- Table 9: Global Composite Coatings Market Revenue Million Forecast, by Region 2019 & 2032
- Table 10: Global Composite Coatings Market Volume K Tons Forecast, by Region 2019 & 2032
- Table 11: Global Composite Coatings Market Revenue Million Forecast, by Country 2019 & 2032
- Table 12: Global Composite Coatings Market Volume K Tons Forecast, by Country 2019 & 2032
- Table 13: United States Composite Coatings Market Revenue (Million) Forecast, by Application 2019 & 2032
- Table 14: United States Composite Coatings Market Volume (K Tons) Forecast, by Application 2019 & 2032
- Table 15: Canada Composite Coatings Market Revenue (Million) Forecast, by Application 2019 & 2032
- Table 16: Canada Composite Coatings Market Volume (K Tons) Forecast, by Application 2019 & 2032
- Table 17: Mexico Composite Coatings Market Revenue (Million) Forecast, by Application 2019 & 2032
- Table 18: Mexico Composite Coatings Market Volume (K Tons) Forecast, by Application 2019 & 2032
- Table 19: Global Composite Coatings Market Revenue Million Forecast, by Country 2019 & 2032
- Table 20: Global Composite Coatings Market Volume K Tons Forecast, by Country 2019 & 2032
- Table 21: Germany Composite Coatings Market Revenue (Million) Forecast, by Application 2019 & 2032
- Table 22: Germany Composite Coatings Market Volume (K Tons) Forecast, by Application 2019 & 2032
- Table 23: France Composite Coatings Market Revenue (Million) Forecast, by Application 2019 & 2032
- Table 24: France Composite Coatings Market Volume (K Tons) Forecast, by Application 2019 & 2032
- Table 25: Italy Composite Coatings Market Revenue (Million) Forecast, by Application 2019 & 2032
- Table 26: Italy Composite Coatings Market Volume (K Tons) Forecast, by Application 2019 & 2032
- Table 27: United Kingdom Composite Coatings Market Revenue (Million) Forecast, by Application 2019 & 2032
- Table 28: United Kingdom Composite Coatings Market Volume (K Tons) Forecast, by Application 2019 & 2032
- Table 29: Netherlands Composite Coatings Market Revenue (Million) Forecast, by Application 2019 & 2032
- Table 30: Netherlands Composite Coatings Market Volume (K Tons) Forecast, by Application 2019 & 2032
- Table 31: Rest of Europe Composite Coatings Market Revenue (Million) Forecast, by Application 2019 & 2032
- Table 32: Rest of Europe Composite Coatings Market Volume (K Tons) Forecast, by Application 2019 & 2032
- Table 33: Global Composite Coatings Market Revenue Million Forecast, by Country 2019 & 2032
- Table 34: Global Composite Coatings Market Volume K Tons Forecast, by Country 2019 & 2032
- Table 35: China Composite Coatings Market Revenue (Million) Forecast, by Application 2019 & 2032
- Table 36: China Composite Coatings Market Volume (K Tons) Forecast, by Application 2019 & 2032
- Table 37: Japan Composite Coatings Market Revenue (Million) Forecast, by Application 2019 & 2032
- Table 38: Japan Composite Coatings Market Volume (K Tons) Forecast, by Application 2019 & 2032
- Table 39: India Composite Coatings Market Revenue (Million) Forecast, by Application 2019 & 2032
- Table 40: India Composite Coatings Market Volume (K Tons) Forecast, by Application 2019 & 2032
- Table 41: South Korea Composite Coatings Market Revenue (Million) Forecast, by Application 2019 & 2032
- Table 42: South Korea Composite Coatings Market Volume (K Tons) Forecast, by Application 2019 & 2032
- Table 43: Taiwan Composite Coatings Market Revenue (Million) Forecast, by Application 2019 & 2032
- Table 44: Taiwan Composite Coatings Market Volume (K Tons) Forecast, by Application 2019 & 2032
- Table 45: Australia Composite Coatings Market Revenue (Million) Forecast, by Application 2019 & 2032
- Table 46: Australia Composite Coatings Market Volume (K Tons) Forecast, by Application 2019 & 2032
- Table 47: Rest of Asia-Pacific Composite Coatings Market Revenue (Million) Forecast, by Application 2019 & 2032
- Table 48: Rest of Asia-Pacific Composite Coatings Market Volume (K Tons) Forecast, by Application 2019 & 2032
- Table 49: Global Composite Coatings Market Revenue Million Forecast, by Country 2019 & 2032
- Table 50: Global Composite Coatings Market Volume K Tons Forecast, by Country 2019 & 2032
- Table 51: Brazil Composite Coatings Market Revenue (Million) Forecast, by Application 2019 & 2032
- Table 52: Brazil Composite Coatings Market Volume (K Tons) Forecast, by Application 2019 & 2032
- Table 53: Argentina Composite Coatings Market Revenue (Million) Forecast, by Application 2019 & 2032
- Table 54: Argentina Composite Coatings Market Volume (K Tons) Forecast, by Application 2019 & 2032
- Table 55: Rest of South America Composite Coatings Market Revenue (Million) Forecast, by Application 2019 & 2032
- Table 56: Rest of South America Composite Coatings Market Volume (K Tons) Forecast, by Application 2019 & 2032
- Table 57: Global Composite Coatings Market Revenue Million Forecast, by Country 2019 & 2032
- Table 58: Global Composite Coatings Market Volume K Tons Forecast, by Country 2019 & 2032
- Table 59: Middle East Composite Coatings Market Revenue (Million) Forecast, by Application 2019 & 2032
- Table 60: Middle East Composite Coatings Market Volume (K Tons) Forecast, by Application 2019 & 2032
- Table 61: Africa Composite Coatings Market Revenue (Million) Forecast, by Application 2019 & 2032
- Table 62: Africa Composite Coatings Market Volume (K Tons) Forecast, by Application 2019 & 2032
- Table 63: Global Composite Coatings Market Revenue Million Forecast, by Resin 2019 & 2032
- Table 64: Global Composite Coatings Market Volume K Tons Forecast, by Resin 2019 & 2032
- Table 65: Global Composite Coatings Market Revenue Million Forecast, by Technique 2019 & 2032
- Table 66: Global Composite Coatings Market Volume K Tons Forecast, by Technique 2019 & 2032
- Table 67: Global Composite Coatings Market Revenue Million Forecast, by End-User Industry 2019 & 2032
- Table 68: Global Composite Coatings Market Volume K Tons Forecast, by End-User Industry 2019 & 2032
- Table 69: Global Composite Coatings Market Revenue Million Forecast, by Country 2019 & 2032
- Table 70: Global Composite Coatings Market Volume K Tons Forecast, by Country 2019 & 2032
- Table 71: China Composite Coatings Market Revenue (Million) Forecast, by Application 2019 & 2032
- Table 72: China Composite Coatings Market Volume (K Tons) Forecast, by Application 2019 & 2032
- Table 73: India Composite Coatings Market Revenue (Million) Forecast, by Application 2019 & 2032
- Table 74: India Composite Coatings Market Volume (K Tons) Forecast, by Application 2019 & 2032
- Table 75: Japan Composite Coatings Market Revenue (Million) Forecast, by Application 2019 & 2032
- Table 76: Japan Composite Coatings Market Volume (K Tons) Forecast, by Application 2019 & 2032
- Table 77: South Korea Composite Coatings Market Revenue (Million) Forecast, by Application 2019 & 2032
- Table 78: South Korea Composite Coatings Market Volume (K Tons) Forecast, by Application 2019 & 2032
- Table 79: Rest of Asia Pacific Composite Coatings Market Revenue (Million) Forecast, by Application 2019 & 2032
- Table 80: Rest of Asia Pacific Composite Coatings Market Volume (K Tons) Forecast, by Application 2019 & 2032
- Table 81: Global Composite Coatings Market Revenue Million Forecast, by Resin 2019 & 2032
- Table 82: Global Composite Coatings Market Volume K Tons Forecast, by Resin 2019 & 2032
- Table 83: Global Composite Coatings Market Revenue Million Forecast, by Technique 2019 & 2032
- Table 84: Global Composite Coatings Market Volume K Tons Forecast, by Technique 2019 & 2032
- Table 85: Global Composite Coatings Market Revenue Million Forecast, by End-User Industry 2019 & 2032
- Table 86: Global Composite Coatings Market Volume K Tons Forecast, by End-User Industry 2019 & 2032
- Table 87: Global Composite Coatings Market Revenue Million Forecast, by Country 2019 & 2032
- Table 88: Global Composite Coatings Market Volume K Tons Forecast, by Country 2019 & 2032
- Table 89: United States Composite Coatings Market Revenue (Million) Forecast, by Application 2019 & 2032
- Table 90: United States Composite Coatings Market Volume (K Tons) Forecast, by Application 2019 & 2032
- Table 91: Canada Composite Coatings Market Revenue (Million) Forecast, by Application 2019 & 2032
- Table 92: Canada Composite Coatings Market Volume (K Tons) Forecast, by Application 2019 & 2032
- Table 93: Mexico Composite Coatings Market Revenue (Million) Forecast, by Application 2019 & 2032
- Table 94: Mexico Composite Coatings Market Volume (K Tons) Forecast, by Application 2019 & 2032
- Table 95: Global Composite Coatings Market Revenue Million Forecast, by Resin 2019 & 2032
- Table 96: Global Composite Coatings Market Volume K Tons Forecast, by Resin 2019 & 2032
- Table 97: Global Composite Coatings Market Revenue Million Forecast, by Technique 2019 & 2032
- Table 98: Global Composite Coatings Market Volume K Tons Forecast, by Technique 2019 & 2032
- Table 99: Global Composite Coatings Market Revenue Million Forecast, by End-User Industry 2019 & 2032
- Table 100: Global Composite Coatings Market Volume K Tons Forecast, by End-User Industry 2019 & 2032
- Table 101: Global Composite Coatings Market Revenue Million Forecast, by Country 2019 & 2032
- Table 102: Global Composite Coatings Market Volume K Tons Forecast, by Country 2019 & 2032
- Table 103: Germany Composite Coatings Market Revenue (Million) Forecast, by Application 2019 & 2032
- Table 104: Germany Composite Coatings Market Volume (K Tons) Forecast, by Application 2019 & 2032
- Table 105: United Kingdom Composite Coatings Market Revenue (Million) Forecast, by Application 2019 & 2032
- Table 106: United Kingdom Composite Coatings Market Volume (K Tons) Forecast, by Application 2019 & 2032
- Table 107: Italy Composite Coatings Market Revenue (Million) Forecast, by Application 2019 & 2032
- Table 108: Italy Composite Coatings Market Volume (K Tons) Forecast, by Application 2019 & 2032
- Table 109: France Composite Coatings Market Revenue (Million) Forecast, by Application 2019 & 2032
- Table 110: France Composite Coatings Market Volume (K Tons) Forecast, by Application 2019 & 2032
- Table 111: Rest of Europe Composite Coatings Market Revenue (Million) Forecast, by Application 2019 & 2032
- Table 112: Rest of Europe Composite Coatings Market Volume (K Tons) Forecast, by Application 2019 & 2032
- Table 113: Global Composite Coatings Market Revenue Million Forecast, by Resin 2019 & 2032
- Table 114: Global Composite Coatings Market Volume K Tons Forecast, by Resin 2019 & 2032
- Table 115: Global Composite Coatings Market Revenue Million Forecast, by Technique 2019 & 2032
- Table 116: Global Composite Coatings Market Volume K Tons Forecast, by Technique 2019 & 2032
- Table 117: Global Composite Coatings Market Revenue Million Forecast, by End-User Industry 2019 & 2032
- Table 118: Global Composite Coatings Market Volume K Tons Forecast, by End-User Industry 2019 & 2032
- Table 119: Global Composite Coatings Market Revenue Million Forecast, by Country 2019 & 2032
- Table 120: Global Composite Coatings Market Volume K Tons Forecast, by Country 2019 & 2032
- Table 121: Brazil Composite Coatings Market Revenue (Million) Forecast, by Application 2019 & 2032
- Table 122: Brazil Composite Coatings Market Volume (K Tons) Forecast, by Application 2019 & 2032
- Table 123: Argentina Composite Coatings Market Revenue (Million) Forecast, by Application 2019 & 2032
- Table 124: Argentina Composite Coatings Market Volume (K Tons) Forecast, by Application 2019 & 2032
- Table 125: Rest of South America Composite Coatings Market Revenue (Million) Forecast, by Application 2019 & 2032
- Table 126: Rest of South America Composite Coatings Market Volume (K Tons) Forecast, by Application 2019 & 2032
- Table 127: Global Composite Coatings Market Revenue Million Forecast, by Resin 2019 & 2032
- Table 128: Global Composite Coatings Market Volume K Tons Forecast, by Resin 2019 & 2032
- Table 129: Global Composite Coatings Market Revenue Million Forecast, by Technique 2019 & 2032
- Table 130: Global Composite Coatings Market Volume K Tons Forecast, by Technique 2019 & 2032
- Table 131: Global Composite Coatings Market Revenue Million Forecast, by End-User Industry 2019 & 2032
- Table 132: Global Composite Coatings Market Volume K Tons Forecast, by End-User Industry 2019 & 2032
- Table 133: Global Composite Coatings Market Revenue Million Forecast, by Country 2019 & 2032
- Table 134: Global Composite Coatings Market Volume K Tons Forecast, by Country 2019 & 2032
- Table 135: Global Composite Coatings Market Revenue Million Forecast, by Resin 2019 & 2032
- Table 136: Global Composite Coatings Market Volume K Tons Forecast, by Resin 2019 & 2032
- Table 137: Global Composite Coatings Market Revenue Million Forecast, by Technique 2019 & 2032
- Table 138: Global Composite Coatings Market Volume K Tons Forecast, by Technique 2019 & 2032
- Table 139: Global Composite Coatings Market Revenue Million Forecast, by End-User Industry 2019 & 2032
- Table 140: Global Composite Coatings Market Volume K Tons Forecast, by End-User Industry 2019 & 2032
- Table 141: Global Composite Coatings Market Revenue Million Forecast, by Country 2019 & 2032
- Table 142: Global Composite Coatings Market Volume K Tons Forecast, by Country 2019 & 2032
- Table 143: South Africa Composite Coatings Market Revenue (Million) Forecast, by Application 2019 & 2032
- Table 144: South Africa Composite Coatings Market Volume (K Tons) Forecast, by Application 2019 & 2032
- Table 145: Rest of Middle East Composite Coatings Market Revenue (Million) Forecast, by Application 2019 & 2032
- Table 146: Rest of Middle East Composite Coatings Market Volume (K Tons) Forecast, by Application 2019 & 2032
Frequently Asked Questions
1. What is the projected Compound Annual Growth Rate (CAGR) of the Composite Coatings Market?
The projected CAGR is approximately 7.9%.
2. Which companies are prominent players in the Composite Coatings Market?
Key companies in the market include Mäder, The Sherwin-Williams Company, RPM International Inc, PPG Industries Inc, Benjamin Moore & Co, AkzoNobel NV, FUSION MINERAL PAINT, KEIM Mineral Coatings of America Inc, K C Jones Plating Company, BEECK Mineral Paints.
3. What are the main segments of the Composite Coatings Market?
The market segments include Resin, Technique, End-User Industry.
4. Can you provide details about the market size?
The market size is estimated to be USD 1463.4 Million as of 2022.
5. What are some drivers contributing to market growth?
; Growth in Oil & Gas Exploration Activities; Others.
6. What are the notable trends driving market growth?
Increasing Demand for Oil and Gas.
7. Are there any restraints impacting market growth?
; High Processing Cost.
8. Can you provide examples of recent developments in the market?
N/A
9. What pricing options are available for accessing the report?
Pricing options include single-user, multi-user, and enterprise licenses priced at USD 3,950, USD 4,950, and USD 6,950 respectively.
10. Is the market size provided in terms of value or volume?
The market size is provided in terms of value, measured in Million and volume, measured in K Tons.
11. Are there any specific market keywords associated with the report?
Yes, the market keyword associated with the report is "Composite Coatings Market," which aids in identifying and referencing the specific market segment covered.
12. How do I determine which pricing option suits my needs best?
The pricing options vary based on user requirements and access needs. Individual users may opt for single-user licenses, while businesses requiring broader access may choose multi-user or enterprise licenses for cost-effective access to the report.
13. Are there any additional resources or data provided in the Composite Coatings Market report?
While the report offers comprehensive insights, it's advisable to review the specific contents or supplementary materials provided to ascertain if additional resources or data are available.
14. How can I stay updated on further developments or reports in the Composite Coatings Market?
To stay informed about further developments, trends, and reports in the Composite Coatings Market, consider subscribing to industry newsletters, following relevant companies and organizations, or regularly checking reputable industry news sources and publications.
Methodology
Step 1 - Identification of Relevant Samples Size from Population Database


Step 2 - Approaches for Defining Global Market Size (Value, Volume* & Price*)

Note*: In applicable scenarios
Step 3 - Data Sources
Primary Research
- Web Analytics
- Survey Reports
- Research Institute
- Latest Research Reports
- Opinion Leaders
Secondary Research
- Annual Reports
- White Paper
- Latest Press Release
- Industry Association
- Paid Database
- Investor Presentations

Step 4 - Data Triangulation
Involves using different sources of information in order to increase the validity of a study
These sources are likely to be stakeholders in a program - participants, other researchers, program staff, other community members, and so on.
Then we put all data in single framework & apply various statistical tools to find out the dynamic on the market.
During the analysis stage, feedback from the stakeholder groups would be compared to determine areas of agreement as well as areas of divergence
