

Key Insights
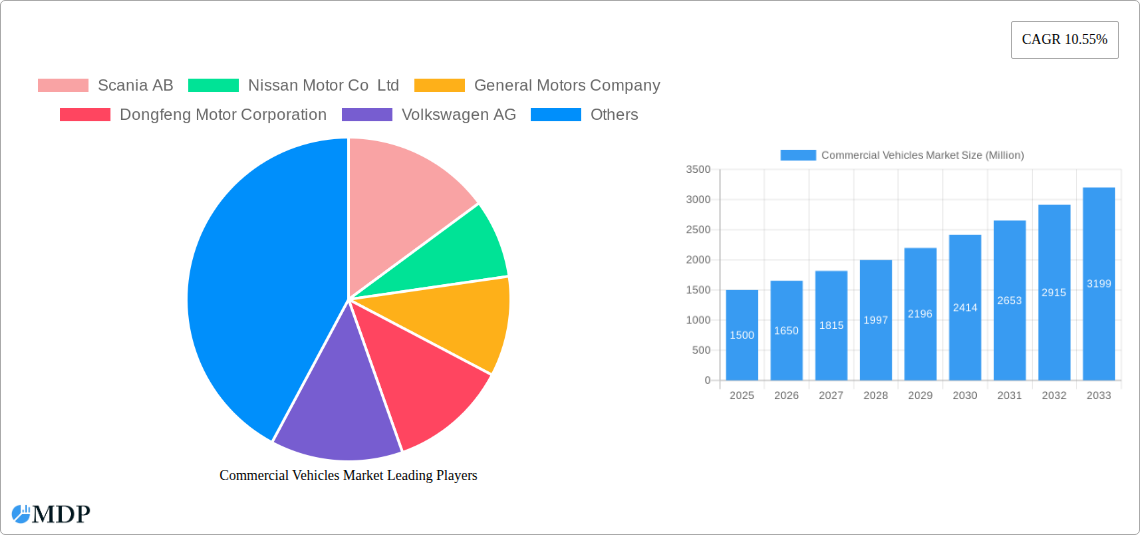
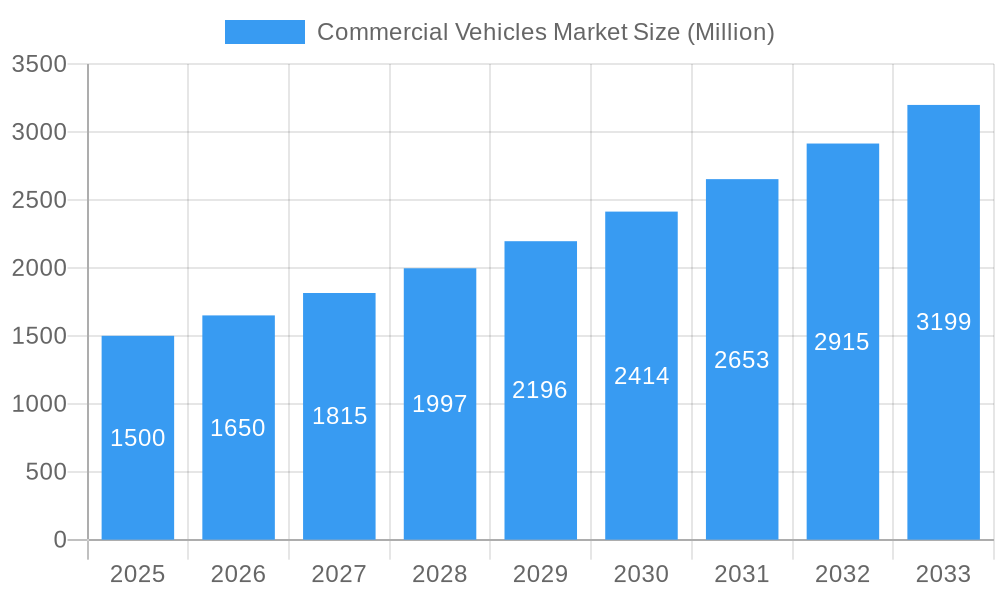
The global commercial vehicle market is projected for significant expansion, driven by escalating global trade, e-commerce demand, and a strong push towards sustainable transportation. The market is anticipated to reach a size of 839.97 billion by 2025, with a Compound Annual Growth Rate (CAGR) of 5.74% from the base year 2024. The increasing adoption of hybrid and electric commercial vehicles, propelled by stringent emission regulations and environmental consciousness, is a key trend. Manufacturers are heavily investing in electric and hybrid drivetrain technologies for trucks and buses. The market is segmented by fuel type, including LPG and alternative fuels, and by vehicle type, such as heavy-duty trucks, light commercial vehicles, and buses. Intense competition exists between established players and emerging EV technology leaders.
Commercial Vehicles Market Market Size (In Billion)
Regional market dynamics show considerable variation, with rapid economic growth, urbanization, and infrastructure development fueling higher adoption rates. Asia-Pacific is projected for substantial growth, supported by industrialization and expanding logistics in key economies like China and India, while North America and Europe remain significant markets. Manufacturer success will depend on innovation, adaptation to regulatory changes, and effective supply chain management. Strategic partnerships and M&A activities are on the rise to enhance market positions and accelerate innovation. Continued adoption of sustainable technologies, economic stability, and effective management of supply chain and production costs will shape the market's future growth.
Commercial Vehicles Market Company Market Share
Global Commercial Vehicles Market Analysis: 2024-2033
This comprehensive report offers an in-depth analysis of the global Commercial Vehicles Market from 2024 to 2033. It examines market dynamics, industry trends, key players, and future growth opportunities, providing valuable insights for stakeholders. The analysis incorporates historical data from 2024, utilizes 2024 as the base year, and provides forecasts through 2033. Key segments analyzed include LPG, Hybrid, and Electric Vehicles across various commercial vehicle categories.
Commercial Vehicles Market Dynamics & Concentration
The global commercial vehicles market is characterized by a moderately concentrated landscape, with a few major players holding significant market share. Market concentration is influenced by factors such as economies of scale, technological advancements, and regulatory frameworks. Innovation is a key driver, particularly in areas like electrification, automation, and connectivity. Stringent emission regulations globally are reshaping the industry, pushing manufacturers towards cleaner propulsion systems. Product substitutes, such as rail and maritime transport, exert competitive pressure. End-user trends, such as the shift towards e-commerce and last-mile delivery, are driving demand for specific vehicle types. The market has witnessed notable M&A activity in recent years, with xx major deals recorded between 2019 and 2024. This activity reflects consolidation efforts and the pursuit of strategic advantages in a rapidly evolving market.
- Market Share: Top 5 players hold approximately xx% of the global market share in 2024.
- M&A Activity: An estimated xx M&A deals occurred between 2019 and 2024, primarily driven by consolidation and technological acquisition.
- Innovation Drivers: Electrification, automation, and connectivity are major drivers shaping market competition and product differentiation.
- Regulatory Impact: Stringent emission norms and safety standards are significantly affecting vehicle design and manufacturing processes.
Commercial Vehicles Market Industry Trends & Analysis
The Commercial Vehicles market exhibits a robust growth trajectory, projected to achieve a CAGR of xx% during the forecast period (2025-2033). This growth is fueled by several key factors. The increasing demand for efficient and sustainable transportation solutions is a primary driver. Technological advancements, particularly in electric and hybrid vehicles, are disrupting the market, offering enhanced fuel efficiency and reduced emissions. Consumer preferences are shifting towards advanced safety features and connectivity options. Intense competition among established players and new entrants drives innovation and price optimization. Market penetration of electric commercial vehicles is expected to reach xx% by 2033, driven by government incentives and environmental concerns. Significant infrastructure investments in developing economies also contribute significantly to overall market growth.
Leading Markets & Segments in Commercial Vehicles Market
The Asia-Pacific region currently dominates the global commercial vehicle market, driven by robust economic growth, increasing urbanization, and expanding infrastructure projects. Within this region, China and India are particularly significant, exhibiting high demand for various vehicle types. The LPG segment shows steady growth, primarily driven by cost considerations in specific geographic regions. However, the Hybrid and Electric Vehicles (HEV) segment is experiencing the most rapid growth, owing to environmental regulations and technological advancements.
Key Drivers in Asia-Pacific:
- Rapid economic growth and industrialization.
- Growing e-commerce and last-mile delivery needs.
- Significant investments in infrastructure development.
- Favorable government policies supporting commercial vehicle adoption.
LPG Segment: While experiencing steady growth, it's facing pressure from stricter emission regulations and the rising popularity of alternative fuel options.
Hybrid and Electric Vehicles Segment: Demonstrates the highest growth potential, fueled by environmental concerns and technological breakthroughs, with a market penetration exceeding xx% by 2033 in developed nations.
Commercial Vehicles Market Product Developments
Recent product innovations focus heavily on enhancing fuel efficiency, safety, and connectivity. Manufacturers are introducing advanced driver-assistance systems (ADAS), telematics solutions, and alternative fuel options (electric, hybrid, LPG) to cater to evolving market demands and stricter regulations. This emphasis on technological integration provides competitive advantages, especially for vehicles offering improved operational efficiency and reduced environmental impact. The focus is on creating vehicles with superior safety, reduced operating costs, and enhanced driver comfort.
Key Drivers of Commercial Vehicles Market Growth
Several factors contribute to the market's sustained growth. Technological advancements like electric and hybrid powertrains are pushing environmental sustainability and reducing operating costs. Economic growth, particularly in emerging markets, fuels demand for transportation and logistics solutions. Favorable government policies, including subsidies and tax incentives for cleaner vehicles, further accelerate market expansion. The ongoing development of supporting infrastructure (charging stations, etc.) also enhances the long-term growth prospects.
Challenges in the Commercial Vehicles Market
The industry faces several challenges. Stringent emission regulations impose significant costs on manufacturers, requiring substantial investments in R&D and technological upgrades. Supply chain disruptions and fluctuating raw material prices impact production costs and profitability. Intense competition, particularly from new entrants with disruptive technologies, exerts pressure on pricing and market share. These factors collectively affect the overall market's growth trajectory, albeit only temporarily.
Emerging Opportunities in Commercial Vehicles Market
The long-term growth of the commercial vehicle market is fueled by several opportunities. Technological breakthroughs in battery technology, autonomous driving, and connected vehicle solutions are creating new possibilities. Strategic partnerships and collaborations between manufacturers, technology providers, and logistics companies are fostering innovation and market expansion. The expansion into new and developing markets with growing infrastructure needs presents significant opportunities for sustained market growth in the coming years.
Leading Players in the Commercial Vehicles Market Sector
- Scania AB
- Nissan Motor Co Ltd
- General Motors Company
- Dongfeng Motor Corporation
- Volkswagen AG
- Daimler AG (Mercedes-Benz AG)
- Tata Motors Limited
- BAIC Motor Corporation Ltd
- Volvo Group
- Mahindra & Mahindra Limited
- BYD Auto Co Ltd
- Saic General Motors Corporation Limited
- Groupe Renault
- Toyota Motor Corporation
- Rivian Automotive Inc
- Ford Motor Company
Key Milestones in Commercial Vehicles Market Industry
- August 2023: General Motors announces the launch of an all-electric Cadillac Escalade in late 2024, signaling a significant commitment to electric vehicle technology in the luxury commercial vehicle segment.
- August 2023: General Motors reinforces its dedication to an electric future in the Middle East, indicating a focus on expanding its electric vehicle presence in key global markets.
- August 2023: Toyota Kirloskar Motor launches the all-new MPV Vellfire strong hybrid electric vehicle (SHEV), priced between INR 11.99 million and INR 12.99 million, marking a step towards increased hybrid vehicle adoption in the commercial vehicle sector. These developments underscore the ongoing industry shift towards electrification and the increasing focus on sustainable transportation solutions.
Strategic Outlook for Commercial Vehicles Market Market
The Commercial Vehicles market is poised for significant growth, driven by technological innovation, sustainable transportation trends, and expanding global infrastructure development. Strategic opportunities lie in focusing on electric and hybrid powertrains, advanced driver-assistance systems, and connected vehicle technologies. Companies that effectively adapt to evolving regulations and consumer preferences, while fostering strategic partnerships and expanding into new markets, are likely to achieve significant success in the coming years. The emphasis on sustainable and efficient transportation will further define the market's future trajectory.
Commercial Vehicles Market Segmentation
-
1. Vehicle Type
-
1.1. Commercial Vehicles
- 1.1.1. Heavy-duty Commercial Trucks
- 1.1.2. Light Commercial Pick-up Trucks
- 1.1.3. Light Commercial Vans
- 1.1.4. Medium-duty Commercial Trucks
-
1.1. Commercial Vehicles
-
2. Propulsion Type
-
2.1. Hybrid and Electric Vehicles
-
2.1.1. By Fuel Category
- 2.1.1.1. BEV
- 2.1.1.2. FCEV
- 2.1.1.3. HEV
- 2.1.1.4. PHEV
-
2.1.1. By Fuel Category
-
2.2. ICE
- 2.2.1. CNG
- 2.2.2. Diesel
- 2.2.3. Gasoline
- 2.2.4. LPG
-
2.1. Hybrid and Electric Vehicles
Commercial Vehicles Market Segmentation By Geography
-
1. North America
- 1.1. United States
- 1.2. Canada
- 1.3. Mexico
-
2. South America
- 2.1. Brazil
- 2.2. Argentina
- 2.3. Rest of South America
-
3. Europe
- 3.1. United Kingdom
- 3.2. Germany
- 3.3. France
- 3.4. Italy
- 3.5. Spain
- 3.6. Russia
- 3.7. Benelux
- 3.8. Nordics
- 3.9. Rest of Europe
-
4. Middle East & Africa
- 4.1. Turkey
- 4.2. Israel
- 4.3. GCC
- 4.4. North Africa
- 4.5. South Africa
- 4.6. Rest of Middle East & Africa
-
5. Asia Pacific
- 5.1. China
- 5.2. India
- 5.3. Japan
- 5.4. South Korea
- 5.5. ASEAN
- 5.6. Oceania
- 5.7. Rest of Asia Pacific
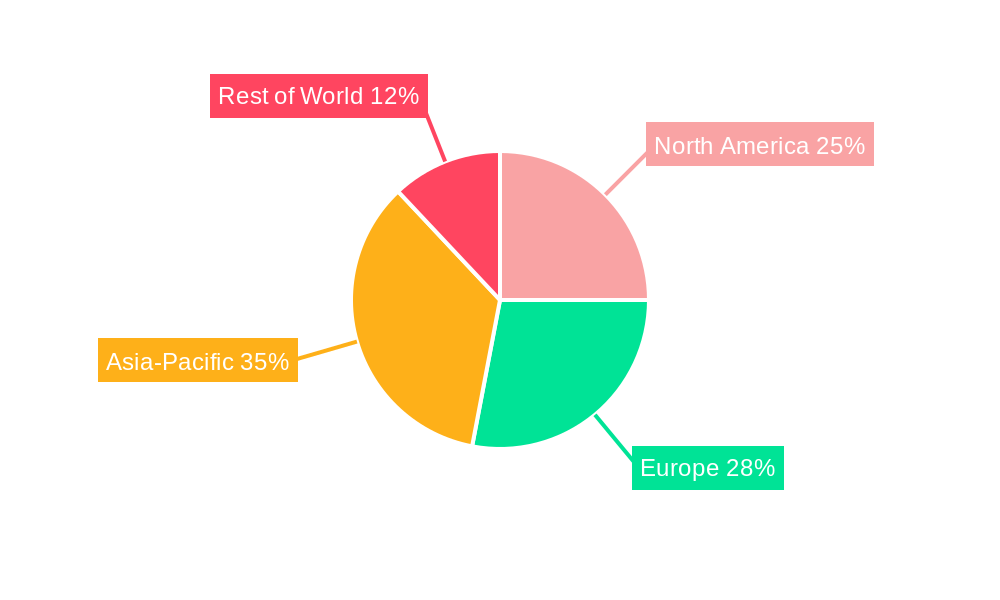
Commercial Vehicles Market Regional Market Share
Geographic Coverage of Commercial Vehicles Market
Commercial Vehicles Market REPORT HIGHLIGHTS
| Aspects | Details |
|---|---|
| Study Period | 2020-2034 |
| Base Year | 2025 |
| Estimated Year | 2026 |
| Forecast Period | 2026-2034 |
| Historical Period | 2020-2025 |
| Growth Rate | CAGR of 5.74% from 2020-2034 |
| Segmentation |
|
Table of Contents
- 1. Introduction
- 1.1. Research Scope
- 1.2. Market Segmentation
- 1.3. Research Methodology
- 1.4. Definitions and Assumptions
- 2. Executive Summary
- 2.1. Introduction
- 3. Market Dynamics
- 3.1. Introduction
- 3.2. Market Drivers
- 3.2.1. Growing Travel and Tourism Industry is Driving the Car Rental Market
- 3.3. Market Restrains
- 3.3.1. Increasing Popularity of Ride-Sharing Services Pose Challenges for the Conventional Car Rental Market
- 3.4. Market Trends
- 3.4.1. OTHER KEY INDUSTRY TRENDS COVERED IN THE REPORT
- 4. Market Factor Analysis
- 4.1. Porters Five Forces
- 4.2. Supply/Value Chain
- 4.3. PESTEL analysis
- 4.4. Market Entropy
- 4.5. Patent/Trademark Analysis
- 5. Global Commercial Vehicles Market Analysis, Insights and Forecast, 2020-2032
- 5.1. Market Analysis, Insights and Forecast - by Vehicle Type
- 5.1.1. Commercial Vehicles
- 5.1.1.1. Heavy-duty Commercial Trucks
- 5.1.1.2. Light Commercial Pick-up Trucks
- 5.1.1.3. Light Commercial Vans
- 5.1.1.4. Medium-duty Commercial Trucks
- 5.1.1. Commercial Vehicles
- 5.2. Market Analysis, Insights and Forecast - by Propulsion Type
- 5.2.1. Hybrid and Electric Vehicles
- 5.2.1.1. By Fuel Category
- 5.2.1.1.1. BEV
- 5.2.1.1.2. FCEV
- 5.2.1.1.3. HEV
- 5.2.1.1.4. PHEV
- 5.2.1.1. By Fuel Category
- 5.2.2. ICE
- 5.2.2.1. CNG
- 5.2.2.2. Diesel
- 5.2.2.3. Gasoline
- 5.2.2.4. LPG
- 5.2.1. Hybrid and Electric Vehicles
- 5.3. Market Analysis, Insights and Forecast - by Region
- 5.3.1. North America
- 5.3.2. South America
- 5.3.3. Europe
- 5.3.4. Middle East & Africa
- 5.3.5. Asia Pacific
- 5.1. Market Analysis, Insights and Forecast - by Vehicle Type
- 6. North America Commercial Vehicles Market Analysis, Insights and Forecast, 2020-2032
- 6.1. Market Analysis, Insights and Forecast - by Vehicle Type
- 6.1.1. Commercial Vehicles
- 6.1.1.1. Heavy-duty Commercial Trucks
- 6.1.1.2. Light Commercial Pick-up Trucks
- 6.1.1.3. Light Commercial Vans
- 6.1.1.4. Medium-duty Commercial Trucks
- 6.1.1. Commercial Vehicles
- 6.2. Market Analysis, Insights and Forecast - by Propulsion Type
- 6.2.1. Hybrid and Electric Vehicles
- 6.2.1.1. By Fuel Category
- 6.2.1.1.1. BEV
- 6.2.1.1.2. FCEV
- 6.2.1.1.3. HEV
- 6.2.1.1.4. PHEV
- 6.2.1.1. By Fuel Category
- 6.2.2. ICE
- 6.2.2.1. CNG
- 6.2.2.2. Diesel
- 6.2.2.3. Gasoline
- 6.2.2.4. LPG
- 6.2.1. Hybrid and Electric Vehicles
- 6.1. Market Analysis, Insights and Forecast - by Vehicle Type
- 7. South America Commercial Vehicles Market Analysis, Insights and Forecast, 2020-2032
- 7.1. Market Analysis, Insights and Forecast - by Vehicle Type
- 7.1.1. Commercial Vehicles
- 7.1.1.1. Heavy-duty Commercial Trucks
- 7.1.1.2. Light Commercial Pick-up Trucks
- 7.1.1.3. Light Commercial Vans
- 7.1.1.4. Medium-duty Commercial Trucks
- 7.1.1. Commercial Vehicles
- 7.2. Market Analysis, Insights and Forecast - by Propulsion Type
- 7.2.1. Hybrid and Electric Vehicles
- 7.2.1.1. By Fuel Category
- 7.2.1.1.1. BEV
- 7.2.1.1.2. FCEV
- 7.2.1.1.3. HEV
- 7.2.1.1.4. PHEV
- 7.2.1.1. By Fuel Category
- 7.2.2. ICE
- 7.2.2.1. CNG
- 7.2.2.2. Diesel
- 7.2.2.3. Gasoline
- 7.2.2.4. LPG
- 7.2.1. Hybrid and Electric Vehicles
- 7.1. Market Analysis, Insights and Forecast - by Vehicle Type
- 8. Europe Commercial Vehicles Market Analysis, Insights and Forecast, 2020-2032
- 8.1. Market Analysis, Insights and Forecast - by Vehicle Type
- 8.1.1. Commercial Vehicles
- 8.1.1.1. Heavy-duty Commercial Trucks
- 8.1.1.2. Light Commercial Pick-up Trucks
- 8.1.1.3. Light Commercial Vans
- 8.1.1.4. Medium-duty Commercial Trucks
- 8.1.1. Commercial Vehicles
- 8.2. Market Analysis, Insights and Forecast - by Propulsion Type
- 8.2.1. Hybrid and Electric Vehicles
- 8.2.1.1. By Fuel Category
- 8.2.1.1.1. BEV
- 8.2.1.1.2. FCEV
- 8.2.1.1.3. HEV
- 8.2.1.1.4. PHEV
- 8.2.1.1. By Fuel Category
- 8.2.2. ICE
- 8.2.2.1. CNG
- 8.2.2.2. Diesel
- 8.2.2.3. Gasoline
- 8.2.2.4. LPG
- 8.2.1. Hybrid and Electric Vehicles
- 8.1. Market Analysis, Insights and Forecast - by Vehicle Type
- 9. Middle East & Africa Commercial Vehicles Market Analysis, Insights and Forecast, 2020-2032
- 9.1. Market Analysis, Insights and Forecast - by Vehicle Type
- 9.1.1. Commercial Vehicles
- 9.1.1.1. Heavy-duty Commercial Trucks
- 9.1.1.2. Light Commercial Pick-up Trucks
- 9.1.1.3. Light Commercial Vans
- 9.1.1.4. Medium-duty Commercial Trucks
- 9.1.1. Commercial Vehicles
- 9.2. Market Analysis, Insights and Forecast - by Propulsion Type
- 9.2.1. Hybrid and Electric Vehicles
- 9.2.1.1. By Fuel Category
- 9.2.1.1.1. BEV
- 9.2.1.1.2. FCEV
- 9.2.1.1.3. HEV
- 9.2.1.1.4. PHEV
- 9.2.1.1. By Fuel Category
- 9.2.2. ICE
- 9.2.2.1. CNG
- 9.2.2.2. Diesel
- 9.2.2.3. Gasoline
- 9.2.2.4. LPG
- 9.2.1. Hybrid and Electric Vehicles
- 9.1. Market Analysis, Insights and Forecast - by Vehicle Type
- 10. Asia Pacific Commercial Vehicles Market Analysis, Insights and Forecast, 2020-2032
- 10.1. Market Analysis, Insights and Forecast - by Vehicle Type
- 10.1.1. Commercial Vehicles
- 10.1.1.1. Heavy-duty Commercial Trucks
- 10.1.1.2. Light Commercial Pick-up Trucks
- 10.1.1.3. Light Commercial Vans
- 10.1.1.4. Medium-duty Commercial Trucks
- 10.1.1. Commercial Vehicles
- 10.2. Market Analysis, Insights and Forecast - by Propulsion Type
- 10.2.1. Hybrid and Electric Vehicles
- 10.2.1.1. By Fuel Category
- 10.2.1.1.1. BEV
- 10.2.1.1.2. FCEV
- 10.2.1.1.3. HEV
- 10.2.1.1.4. PHEV
- 10.2.1.1. By Fuel Category
- 10.2.2. ICE
- 10.2.2.1. CNG
- 10.2.2.2. Diesel
- 10.2.2.3. Gasoline
- 10.2.2.4. LPG
- 10.2.1. Hybrid and Electric Vehicles
- 10.1. Market Analysis, Insights and Forecast - by Vehicle Type
- 11. Competitive Analysis
- 11.1. Global Market Share Analysis 2025
- 11.2. Company Profiles
- 11.2.1 Scania AB
- 11.2.1.1. Overview
- 11.2.1.2. Products
- 11.2.1.3. SWOT Analysis
- 11.2.1.4. Recent Developments
- 11.2.1.5. Financials (Based on Availability)
- 11.2.2 Nissan Motor Co Ltd
- 11.2.2.1. Overview
- 11.2.2.2. Products
- 11.2.2.3. SWOT Analysis
- 11.2.2.4. Recent Developments
- 11.2.2.5. Financials (Based on Availability)
- 11.2.3 General Motors Company
- 11.2.3.1. Overview
- 11.2.3.2. Products
- 11.2.3.3. SWOT Analysis
- 11.2.3.4. Recent Developments
- 11.2.3.5. Financials (Based on Availability)
- 11.2.4 Dongfeng Motor Corporation
- 11.2.4.1. Overview
- 11.2.4.2. Products
- 11.2.4.3. SWOT Analysis
- 11.2.4.4. Recent Developments
- 11.2.4.5. Financials (Based on Availability)
- 11.2.5 Volkswagen AG
- 11.2.5.1. Overview
- 11.2.5.2. Products
- 11.2.5.3. SWOT Analysis
- 11.2.5.4. Recent Developments
- 11.2.5.5. Financials (Based on Availability)
- 11.2.6 Daimler AG (Mercedes-Benz AG)
- 11.2.6.1. Overview
- 11.2.6.2. Products
- 11.2.6.3. SWOT Analysis
- 11.2.6.4. Recent Developments
- 11.2.6.5. Financials (Based on Availability)
- 11.2.7 Tata Motors Limited
- 11.2.7.1. Overview
- 11.2.7.2. Products
- 11.2.7.3. SWOT Analysis
- 11.2.7.4. Recent Developments
- 11.2.7.5. Financials (Based on Availability)
- 11.2.8 BAIC Motor Corporation Ltd
- 11.2.8.1. Overview
- 11.2.8.2. Products
- 11.2.8.3. SWOT Analysis
- 11.2.8.4. Recent Developments
- 11.2.8.5. Financials (Based on Availability)
- 11.2.9 Volvo Grou
- 11.2.9.1. Overview
- 11.2.9.2. Products
- 11.2.9.3. SWOT Analysis
- 11.2.9.4. Recent Developments
- 11.2.9.5. Financials (Based on Availability)
- 11.2.10 Mahindra & Mahindra Limited
- 11.2.10.1. Overview
- 11.2.10.2. Products
- 11.2.10.3. SWOT Analysis
- 11.2.10.4. Recent Developments
- 11.2.10.5. Financials (Based on Availability)
- 11.2.11 BYD Auto Co Ltd
- 11.2.11.1. Overview
- 11.2.11.2. Products
- 11.2.11.3. SWOT Analysis
- 11.2.11.4. Recent Developments
- 11.2.11.5. Financials (Based on Availability)
- 11.2.12 Saic General Motors Corporation Limited
- 11.2.12.1. Overview
- 11.2.12.2. Products
- 11.2.12.3. SWOT Analysis
- 11.2.12.4. Recent Developments
- 11.2.12.5. Financials (Based on Availability)
- 11.2.13 Groupe Renault
- 11.2.13.1. Overview
- 11.2.13.2. Products
- 11.2.13.3. SWOT Analysis
- 11.2.13.4. Recent Developments
- 11.2.13.5. Financials (Based on Availability)
- 11.2.14 Toyota Motor Corporation
- 11.2.14.1. Overview
- 11.2.14.2. Products
- 11.2.14.3. SWOT Analysis
- 11.2.14.4. Recent Developments
- 11.2.14.5. Financials (Based on Availability)
- 11.2.15 Rivian Automotive Inc
- 11.2.15.1. Overview
- 11.2.15.2. Products
- 11.2.15.3. SWOT Analysis
- 11.2.15.4. Recent Developments
- 11.2.15.5. Financials (Based on Availability)
- 11.2.16 Ford Motor Company
- 11.2.16.1. Overview
- 11.2.16.2. Products
- 11.2.16.3. SWOT Analysis
- 11.2.16.4. Recent Developments
- 11.2.16.5. Financials (Based on Availability)
- 11.2.1 Scania AB
List of Figures
- Figure 1: Global Commercial Vehicles Market Revenue Breakdown (billion, %) by Region 2025 & 2033
- Figure 2: North America Commercial Vehicles Market Revenue (billion), by Vehicle Type 2025 & 2033
- Figure 3: North America Commercial Vehicles Market Revenue Share (%), by Vehicle Type 2025 & 2033
- Figure 4: North America Commercial Vehicles Market Revenue (billion), by Propulsion Type 2025 & 2033
- Figure 5: North America Commercial Vehicles Market Revenue Share (%), by Propulsion Type 2025 & 2033
- Figure 6: North America Commercial Vehicles Market Revenue (billion), by Country 2025 & 2033
- Figure 7: North America Commercial Vehicles Market Revenue Share (%), by Country 2025 & 2033
- Figure 8: South America Commercial Vehicles Market Revenue (billion), by Vehicle Type 2025 & 2033
- Figure 9: South America Commercial Vehicles Market Revenue Share (%), by Vehicle Type 2025 & 2033
- Figure 10: South America Commercial Vehicles Market Revenue (billion), by Propulsion Type 2025 & 2033
- Figure 11: South America Commercial Vehicles Market Revenue Share (%), by Propulsion Type 2025 & 2033
- Figure 12: South America Commercial Vehicles Market Revenue (billion), by Country 2025 & 2033
- Figure 13: South America Commercial Vehicles Market Revenue Share (%), by Country 2025 & 2033
- Figure 14: Europe Commercial Vehicles Market Revenue (billion), by Vehicle Type 2025 & 2033
- Figure 15: Europe Commercial Vehicles Market Revenue Share (%), by Vehicle Type 2025 & 2033
- Figure 16: Europe Commercial Vehicles Market Revenue (billion), by Propulsion Type 2025 & 2033
- Figure 17: Europe Commercial Vehicles Market Revenue Share (%), by Propulsion Type 2025 & 2033
- Figure 18: Europe Commercial Vehicles Market Revenue (billion), by Country 2025 & 2033
- Figure 19: Europe Commercial Vehicles Market Revenue Share (%), by Country 2025 & 2033
- Figure 20: Middle East & Africa Commercial Vehicles Market Revenue (billion), by Vehicle Type 2025 & 2033
- Figure 21: Middle East & Africa Commercial Vehicles Market Revenue Share (%), by Vehicle Type 2025 & 2033
- Figure 22: Middle East & Africa Commercial Vehicles Market Revenue (billion), by Propulsion Type 2025 & 2033
- Figure 23: Middle East & Africa Commercial Vehicles Market Revenue Share (%), by Propulsion Type 2025 & 2033
- Figure 24: Middle East & Africa Commercial Vehicles Market Revenue (billion), by Country 2025 & 2033
- Figure 25: Middle East & Africa Commercial Vehicles Market Revenue Share (%), by Country 2025 & 2033
- Figure 26: Asia Pacific Commercial Vehicles Market Revenue (billion), by Vehicle Type 2025 & 2033
- Figure 27: Asia Pacific Commercial Vehicles Market Revenue Share (%), by Vehicle Type 2025 & 2033
- Figure 28: Asia Pacific Commercial Vehicles Market Revenue (billion), by Propulsion Type 2025 & 2033
- Figure 29: Asia Pacific Commercial Vehicles Market Revenue Share (%), by Propulsion Type 2025 & 2033
- Figure 30: Asia Pacific Commercial Vehicles Market Revenue (billion), by Country 2025 & 2033
- Figure 31: Asia Pacific Commercial Vehicles Market Revenue Share (%), by Country 2025 & 2033
List of Tables
- Table 1: Global Commercial Vehicles Market Revenue billion Forecast, by Vehicle Type 2020 & 2033
- Table 2: Global Commercial Vehicles Market Revenue billion Forecast, by Propulsion Type 2020 & 2033
- Table 3: Global Commercial Vehicles Market Revenue billion Forecast, by Region 2020 & 2033
- Table 4: Global Commercial Vehicles Market Revenue billion Forecast, by Vehicle Type 2020 & 2033
- Table 5: Global Commercial Vehicles Market Revenue billion Forecast, by Propulsion Type 2020 & 2033
- Table 6: Global Commercial Vehicles Market Revenue billion Forecast, by Country 2020 & 2033
- Table 7: United States Commercial Vehicles Market Revenue (billion) Forecast, by Application 2020 & 2033
- Table 8: Canada Commercial Vehicles Market Revenue (billion) Forecast, by Application 2020 & 2033
- Table 9: Mexico Commercial Vehicles Market Revenue (billion) Forecast, by Application 2020 & 2033
- Table 10: Global Commercial Vehicles Market Revenue billion Forecast, by Vehicle Type 2020 & 2033
- Table 11: Global Commercial Vehicles Market Revenue billion Forecast, by Propulsion Type 2020 & 2033
- Table 12: Global Commercial Vehicles Market Revenue billion Forecast, by Country 2020 & 2033
- Table 13: Brazil Commercial Vehicles Market Revenue (billion) Forecast, by Application 2020 & 2033
- Table 14: Argentina Commercial Vehicles Market Revenue (billion) Forecast, by Application 2020 & 2033
- Table 15: Rest of South America Commercial Vehicles Market Revenue (billion) Forecast, by Application 2020 & 2033
- Table 16: Global Commercial Vehicles Market Revenue billion Forecast, by Vehicle Type 2020 & 2033
- Table 17: Global Commercial Vehicles Market Revenue billion Forecast, by Propulsion Type 2020 & 2033
- Table 18: Global Commercial Vehicles Market Revenue billion Forecast, by Country 2020 & 2033
- Table 19: United Kingdom Commercial Vehicles Market Revenue (billion) Forecast, by Application 2020 & 2033
- Table 20: Germany Commercial Vehicles Market Revenue (billion) Forecast, by Application 2020 & 2033
- Table 21: France Commercial Vehicles Market Revenue (billion) Forecast, by Application 2020 & 2033
- Table 22: Italy Commercial Vehicles Market Revenue (billion) Forecast, by Application 2020 & 2033
- Table 23: Spain Commercial Vehicles Market Revenue (billion) Forecast, by Application 2020 & 2033
- Table 24: Russia Commercial Vehicles Market Revenue (billion) Forecast, by Application 2020 & 2033
- Table 25: Benelux Commercial Vehicles Market Revenue (billion) Forecast, by Application 2020 & 2033
- Table 26: Nordics Commercial Vehicles Market Revenue (billion) Forecast, by Application 2020 & 2033
- Table 27: Rest of Europe Commercial Vehicles Market Revenue (billion) Forecast, by Application 2020 & 2033
- Table 28: Global Commercial Vehicles Market Revenue billion Forecast, by Vehicle Type 2020 & 2033
- Table 29: Global Commercial Vehicles Market Revenue billion Forecast, by Propulsion Type 2020 & 2033
- Table 30: Global Commercial Vehicles Market Revenue billion Forecast, by Country 2020 & 2033
- Table 31: Turkey Commercial Vehicles Market Revenue (billion) Forecast, by Application 2020 & 2033
- Table 32: Israel Commercial Vehicles Market Revenue (billion) Forecast, by Application 2020 & 2033
- Table 33: GCC Commercial Vehicles Market Revenue (billion) Forecast, by Application 2020 & 2033
- Table 34: North Africa Commercial Vehicles Market Revenue (billion) Forecast, by Application 2020 & 2033
- Table 35: South Africa Commercial Vehicles Market Revenue (billion) Forecast, by Application 2020 & 2033
- Table 36: Rest of Middle East & Africa Commercial Vehicles Market Revenue (billion) Forecast, by Application 2020 & 2033
- Table 37: Global Commercial Vehicles Market Revenue billion Forecast, by Vehicle Type 2020 & 2033
- Table 38: Global Commercial Vehicles Market Revenue billion Forecast, by Propulsion Type 2020 & 2033
- Table 39: Global Commercial Vehicles Market Revenue billion Forecast, by Country 2020 & 2033
- Table 40: China Commercial Vehicles Market Revenue (billion) Forecast, by Application 2020 & 2033
- Table 41: India Commercial Vehicles Market Revenue (billion) Forecast, by Application 2020 & 2033
- Table 42: Japan Commercial Vehicles Market Revenue (billion) Forecast, by Application 2020 & 2033
- Table 43: South Korea Commercial Vehicles Market Revenue (billion) Forecast, by Application 2020 & 2033
- Table 44: ASEAN Commercial Vehicles Market Revenue (billion) Forecast, by Application 2020 & 2033
- Table 45: Oceania Commercial Vehicles Market Revenue (billion) Forecast, by Application 2020 & 2033
- Table 46: Rest of Asia Pacific Commercial Vehicles Market Revenue (billion) Forecast, by Application 2020 & 2033
Frequently Asked Questions
1. What is the projected Compound Annual Growth Rate (CAGR) of the Commercial Vehicles Market?
The projected CAGR is approximately 5.74%.
2. Which companies are prominent players in the Commercial Vehicles Market?
Key companies in the market include Scania AB, Nissan Motor Co Ltd, General Motors Company, Dongfeng Motor Corporation, Volkswagen AG, Daimler AG (Mercedes-Benz AG), Tata Motors Limited, BAIC Motor Corporation Ltd, Volvo Grou, Mahindra & Mahindra Limited, BYD Auto Co Ltd, Saic General Motors Corporation Limited, Groupe Renault, Toyota Motor Corporation, Rivian Automotive Inc, Ford Motor Company.
3. What are the main segments of the Commercial Vehicles Market?
The market segments include Vehicle Type, Propulsion Type.
4. Can you provide details about the market size?
The market size is estimated to be USD 839.97 billion as of 2022.
5. What are some drivers contributing to market growth?
Growing Travel and Tourism Industry is Driving the Car Rental Market.
6. What are the notable trends driving market growth?
OTHER KEY INDUSTRY TRENDS COVERED IN THE REPORT.
7. Are there any restraints impacting market growth?
Increasing Popularity of Ride-Sharing Services Pose Challenges for the Conventional Car Rental Market.
8. Can you provide examples of recent developments in the market?
August 2023: General Motors will launch an all-electric Cadillac Escalade in late 2024August 2023: General Motors doubles down on plans for an electric future in the Middle East.August 2023: Toyota Kirloskar Motor launched the all-new MPV Vellfire strong hybrid electric vehicle (SHEV) for a starting price of INR 11.99 million and going to INR 12.99 million.
9. What pricing options are available for accessing the report?
Pricing options include single-user, multi-user, and enterprise licenses priced at USD 3800, USD 4500, and USD 5800 respectively.
10. Is the market size provided in terms of value or volume?
The market size is provided in terms of value, measured in billion.
11. Are there any specific market keywords associated with the report?
Yes, the market keyword associated with the report is "Commercial Vehicles Market," which aids in identifying and referencing the specific market segment covered.
12. How do I determine which pricing option suits my needs best?
The pricing options vary based on user requirements and access needs. Individual users may opt for single-user licenses, while businesses requiring broader access may choose multi-user or enterprise licenses for cost-effective access to the report.
13. Are there any additional resources or data provided in the Commercial Vehicles Market report?
While the report offers comprehensive insights, it's advisable to review the specific contents or supplementary materials provided to ascertain if additional resources or data are available.
14. How can I stay updated on further developments or reports in the Commercial Vehicles Market?
To stay informed about further developments, trends, and reports in the Commercial Vehicles Market, consider subscribing to industry newsletters, following relevant companies and organizations, or regularly checking reputable industry news sources and publications.
Methodology
Step 1 - Identification of Relevant Samples Size from Population Database


Step 2 - Approaches for Defining Global Market Size (Value, Volume* & Price*)

Note*: In applicable scenarios
Step 3 - Data Sources
Primary Research
- Web Analytics
- Survey Reports
- Research Institute
- Latest Research Reports
- Opinion Leaders
Secondary Research
- Annual Reports
- White Paper
- Latest Press Release
- Industry Association
- Paid Database
- Investor Presentations

Step 4 - Data Triangulation
Involves using different sources of information in order to increase the validity of a study
These sources are likely to be stakeholders in a program - participants, other researchers, program staff, other community members, and so on.
Then we put all data in single framework & apply various statistical tools to find out the dynamic on the market.
During the analysis stage, feedback from the stakeholder groups would be compared to determine areas of agreement as well as areas of divergence