

Key Insights
The CLIA (Chemiluminescence Immunoassay) immunoassay market is experiencing robust growth, driven by the increasing prevalence of chronic diseases like oncology, autoimmune disorders, and cardiovascular diseases. The market's expansion is fueled by technological advancements leading to higher sensitivity and specificity of CLIA tests, coupled with the rising demand for faster and more accurate diagnostic tools. Automated and semi-automated analyzers are significantly contributing to market growth, offering increased throughput and reduced manual labor in clinical laboratories. The pharmaceutical and biotechnology industries are key end-users, utilizing CLIA assays extensively in drug development and research. While the high cost of equipment and reagents can act as a restraint, the overall market trajectory remains positive, particularly in regions with well-established healthcare infrastructures and growing investments in diagnostics. Consumables, including reagents and enzymatic markers, represent a substantial segment within the market, driven by the increasing volume of tests performed globally. The market is segmented by product type (analyzers, reagents, consumables), application (oncology, autoimmune disorders, infectious diseases, etc.), and end-user (pharmaceutical companies, hospitals, etc.). Competitive landscape analysis reveals key players like Randox Laboratories, BioMerieux, and Roche, actively engaged in innovation and market expansion through product launches and strategic collaborations. The Asia-Pacific region is projected to witness substantial growth, owing to expanding healthcare infrastructure and rising healthcare expenditure. North America and Europe continue to hold significant market shares due to high adoption rates and advanced healthcare systems. The overall market is expected to maintain a healthy CAGR over the forecast period (2025-2033).
The market's future growth is projected to be influenced by factors such as the development of point-of-care CLIA testing devices, personalized medicine advancements driving demand for specific and sensitive assays, and the increasing adoption of telemedicine and remote patient monitoring. Stringent regulatory approvals and the need for skilled technicians remain challenges. However, continuous innovation in CLIA technology, coupled with the growing prevalence of chronic diseases worldwide, is expected to outweigh these challenges, resulting in consistent market expansion across all major segments and geographical regions. The integration of artificial intelligence and machine learning into CLIA systems also promises to further enhance the efficiency and accuracy of diagnostic testing, driving future market growth.
Comprehensive Analysis of the CLIA Immunoassay Industry: 2019-2033
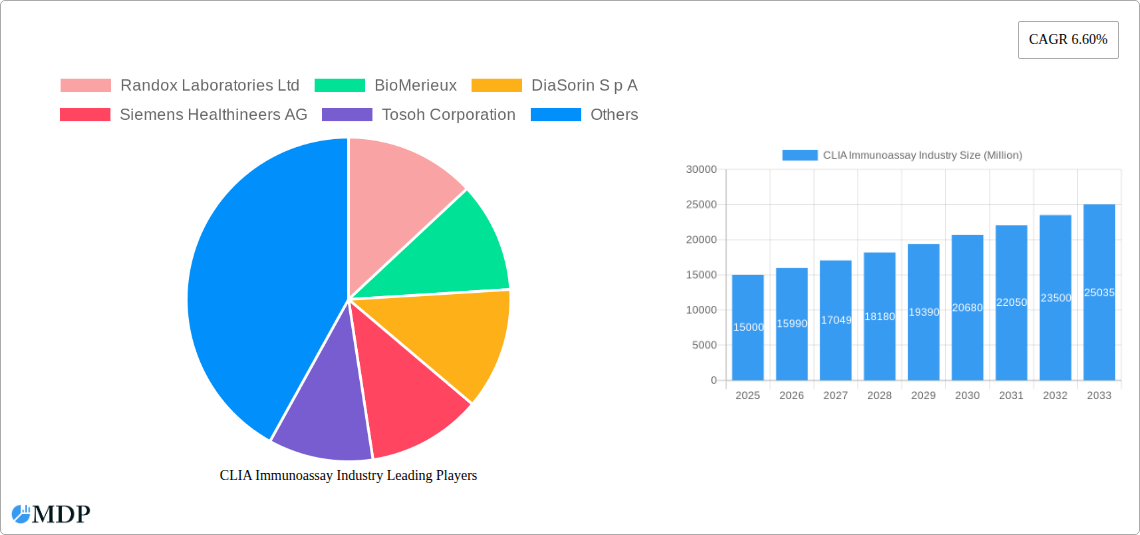
This comprehensive report provides a detailed analysis of the CLIA Immunoassay industry, offering invaluable insights for stakeholders seeking to navigate this dynamic market. From market size and growth projections to competitive landscapes and emerging trends, this report covers all crucial aspects, enabling informed decision-making and strategic planning. The study period spans 2019-2033, with a base year of 2025 and a forecast period of 2025-2033. Key players like Randox Laboratories Ltd, BioMerieux, DiaSorin S.p.A, Siemens Healthineers AG, and Roche are analyzed, offering a clear view of the competitive landscape. The report also delves into various segments by product type (analyzers, reagents, consumables), application (oncology, infectious disease, etc.), and end-user (hospitals, pharmaceutical companies).
CLIA Immunoassay Industry Market Dynamics & Concentration
The CLIA immunoassay market is characterized by a moderately concentrated landscape, with key players holding significant market share. The market's dynamism is driven by continuous innovation in assay technology, stringent regulatory frameworks governing IVD devices, and the emergence of substitute technologies. End-user trends, particularly increased adoption of automated systems in high-throughput labs and a growing preference for point-of-care (POC) testing, are reshaping market demand. Mergers and acquisitions (M&A) activity is frequent, with xx M&A deals recorded between 2019 and 2024, further consolidating the industry. The top five players likely hold a combined market share of approximately xx%, reflecting the oligopolistic nature of the market.
- Market Concentration: Moderately concentrated, with top players holding significant shares.
- Innovation Drivers: Technological advancements in assay platforms and automation.
- Regulatory Frameworks: Stringent regulations impacting product approvals and market access.
- Product Substitutes: Emergence of alternative diagnostic technologies posing competitive pressures.
- End-User Trends: Growing demand for automated analyzers and point-of-care testing.
- M&A Activity: Significant consolidation through mergers and acquisitions (xx deals 2019-2024).
CLIA Immunoassay Industry Industry Trends & Analysis
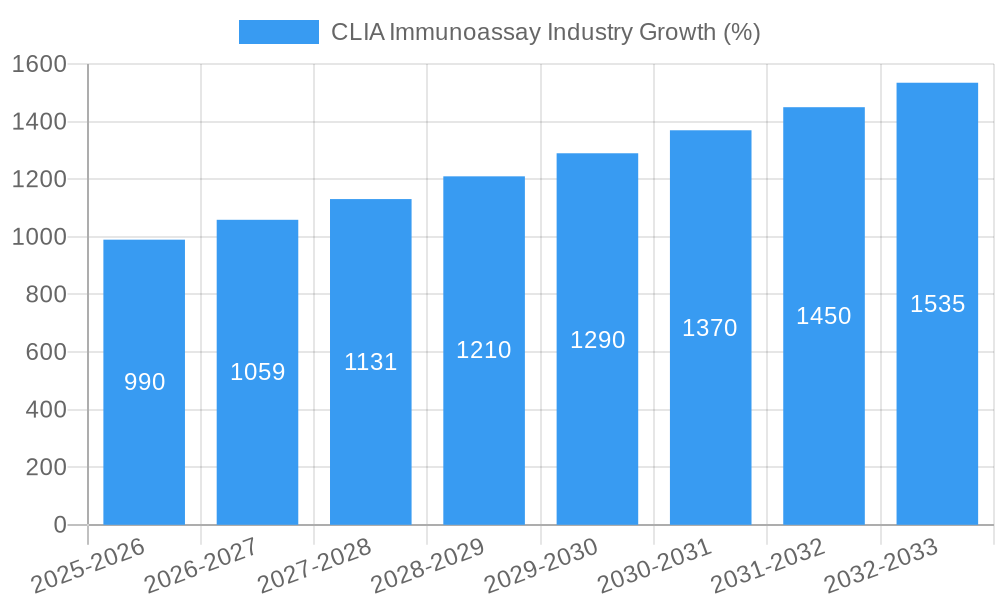
The CLIA immunoassay market is experiencing robust growth, projected to reach xx Million by 2033. This expansion is fueled by several key factors. The increasing prevalence of chronic diseases like cancer and autoimmune disorders is driving demand for accurate and timely diagnostics. Technological advancements, including the development of highly sensitive and specific assays, miniaturized platforms, and improved automation, are significantly enhancing efficiency and accessibility. Changing consumer preferences towards personalized medicine and faster turnaround times further fuel market growth. The competitive landscape is characterized by intense rivalry among established players and the emergence of new entrants offering innovative solutions. The market’s Compound Annual Growth Rate (CAGR) during the forecast period is estimated at xx%. Market penetration is highest in developed regions and is steadily increasing in developing nations.
Leading Markets & Segments in CLIA Immunoassay Industry
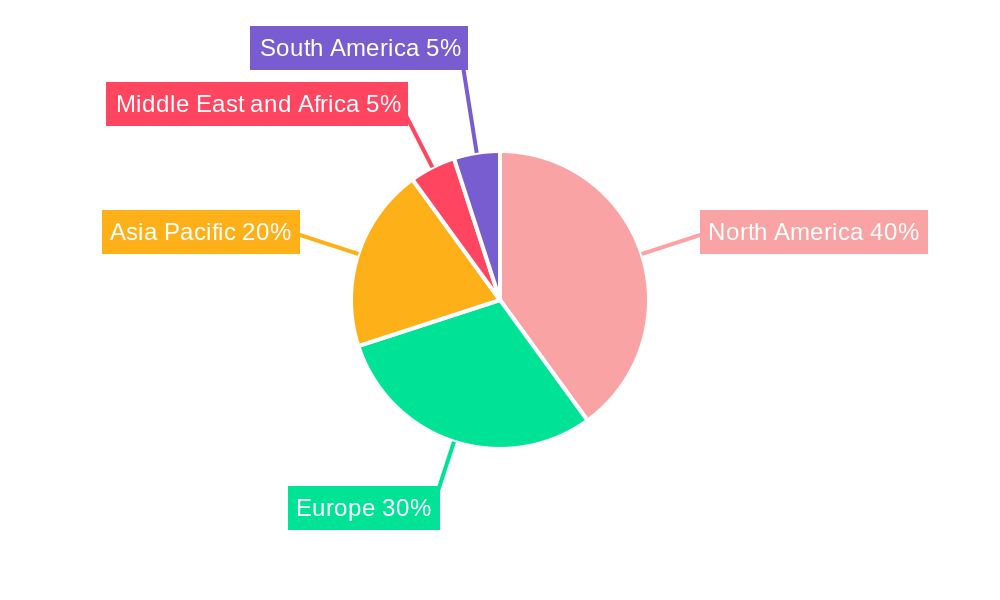
North America currently holds the dominant position in the CLIA immunoassay market, driven by robust healthcare infrastructure, high adoption rates of advanced technologies, and a large pool of patients with chronic diseases. The Oncology segment is expected to witness significant growth, owing to rising cancer incidence rates and the need for precise diagnostic tools. Within product types, analyzers command the largest market share due to their high throughput capabilities and automation potential. However, the reagents segment is also experiencing substantial growth, fuelled by the increasing demand for testing. Hospital and clinical laboratories form the primary end-user segment.
- Key Drivers in North America: Advanced healthcare infrastructure, high technological adoption, large patient base.
- Oncology Segment Dominance: Driven by rising cancer incidence and demand for accurate diagnosis.
- Analyzers Segment Leadership: High throughput and automation drive market share.
- Reagents Segment Growth: Driven by increasing testing demand.
- Hospital and Clinical Laboratories: The primary end-user segment.
CLIA Immunoassay Industry Product Developments
Recent product innovations focus on enhancing assay sensitivity, specificity, and speed. Miniaturization of platforms and integration of advanced analytical technologies are key technological trends. These innovations improve workflow efficiency, reduce turnaround times, and enable point-of-care testing, thus catering to the growing need for faster and more accessible diagnostics. The development of multiplexed assays that can simultaneously measure multiple analytes further enhances the value proposition. These advancements are fostering stronger competitive advantages for companies that invest in R&D and innovation.
Key Drivers of CLIA Immunoassay Industry Growth
Several factors are propelling the growth of the CLIA immunoassay market. Technological advancements are constantly improving assay performance and efficiency. Rising prevalence of chronic diseases necessitates increased diagnostic testing. Favorable regulatory environments in several regions are streamlining market access for new products. Government initiatives aimed at improving healthcare infrastructure and access further contribute to market expansion. Finally, increased investment in R&D within the industry is leading to the development of innovative diagnostic solutions.
Challenges in the CLIA Immunoassay Industry Market
The CLIA immunoassay market faces several challenges. Stringent regulatory requirements for IVD products can increase time-to-market and development costs. Supply chain disruptions, particularly concerning reagents and consumables, can impact production and availability. Intense competition among established players and the emergence of new entrants exert pressure on pricing and margins. These factors can collectively affect the market's growth trajectory.
Emerging Opportunities in CLIA Immunoassay Industry
The CLIA immunoassay market presents numerous opportunities for growth. Technological breakthroughs, such as the development of AI-powered diagnostic tools and advanced biosensors, hold immense potential. Strategic partnerships between manufacturers and healthcare providers can improve market access and distribution. Expanding into emerging markets with growing healthcare expenditure presents substantial opportunities for market expansion. These factors can significantly shape the future of the industry.
Leading Players in the CLIA Immunoassay Industry Sector
- Randox Laboratories Ltd
- BioMerieux
- DiaSorin S.p.A
- Siemens Healthineers AG
- Tosoh Corporation
- F. Hoffmann-La Roche AG
- Sysmex Corporation
- Shenzhen New Industries Biomedical Engineering Co Ltd
- Shenzhen Mindray Bio-Medical Electronics Co Ltd
- Danaher (Beckman Coulter Inc)
Key Milestones in CLIA Immunoassay Industry Industry
- June 2022: Roche launched the BenchMark ULTRA PLUS system, a new advanced tissue staining platform for IVD use. This significantly improved the efficiency and capabilities of immunohistochemistry testing.
- January 2022: Wondfo launched the Tisenc PoC chemiluminescence immunoassay product, expanding its presence in CLIA diagnostics and demonstrating increasing interest in point-of-care solutions.
Strategic Outlook for CLIA Immunoassay Industry Market
The CLIA immunoassay market is poised for continued expansion, driven by technological advancements and the growing need for precise and timely diagnostics. Strategic opportunities lie in developing innovative assay platforms, expanding into emerging markets, and forging strategic partnerships to enhance market penetration and distribution. Focusing on personalized medicine and point-of-care diagnostics will be key to maximizing future market potential. The market’s future growth will depend heavily on the ongoing innovation, regulatory landscape, and the ability of companies to adapt to evolving end-user needs.
CLIA Immunoassay Industry Segmentation
-
1. Product Type
-
1.1. Analyzers
- 1.1.1. Automated
- 1.1.2. Semi-Automated
-
1.2. Reagents
- 1.2.1. Luminophore Markers
- 1.2.2. Enzymatic Markers
- 1.3. Consumables
-
1.1. Analyzers
-
2. Application
- 2.1. Oncology
- 2.2. Autoimmune Disorder
- 2.3. Infectious Disease
- 2.4. Cardiovascular Disease
- 2.5. Endocrine Disorders
- 2.6. Others
-
3. End User
- 3.1. Pharmaceutical and Biotechnology Companies
- 3.2. Hospital and Clinical Laboratories
- 3.3. Others
CLIA Immunoassay Industry Segmentation By Geography
-
1. North America
- 1.1. United States
- 1.2. Canada
- 1.3. Mexico
-
2. Europe
- 2.1. Germany
- 2.2. United Kingdom
- 2.3. France
- 2.4. Italy
- 2.5. Spain
- 2.6. Rest of Europe
-
3. Asia Pacific
- 3.1. China
- 3.2. Japan
- 3.3. India
- 3.4. Australia
- 3.5. South Korea
- 3.6. Rest of Asia Pacific
-
4. Middle East and Africa
- 4.1. GCC
- 4.2. South Africa
- 4.3. Rest of Middle East and Africa
-
5. South America
- 5.1. Brazil
- 5.2. Argentina
- 5.3. Rest of South America
CLIA Immunoassay Industry REPORT HIGHLIGHTS
| Aspects | Details |
|---|---|
| Study Period | 2019-2033 |
| Base Year | 2024 |
| Estimated Year | 2025 |
| Forecast Period | 2025-2033 |
| Historical Period | 2019-2024 |
| Growth Rate | CAGR of 6.60% from 2019-2033 |
| Segmentation |
|
Table of Contents
- 1. Introduction
- 1.1. Research Scope
- 1.2. Market Segmentation
- 1.3. Research Methodology
- 1.4. Definitions and Assumptions
- 2. Executive Summary
- 2.1. Introduction
- 3. Market Dynamics
- 3.1. Introduction
- 3.2. Market Drivers
- 3.2.1. Rising Incidence of Chronic Diseases; Increasing Technological Advancements
- 3.3. Market Restrains
- 3.3.1. Lack of Skilled Professionals
- 3.4. Market Trends
- 3.4.1. Oncology Segment is Expected to Hold the Largest Market Share
- 4. Market Factor Analysis
- 4.1. Porters Five Forces
- 4.2. Supply/Value Chain
- 4.3. PESTEL analysis
- 4.4. Market Entropy
- 4.5. Patent/Trademark Analysis
- 5. Global CLIA Immunoassay Industry Analysis, Insights and Forecast, 2019-2031
- 5.1. Market Analysis, Insights and Forecast - by Product Type
- 5.1.1. Analyzers
- 5.1.1.1. Automated
- 5.1.1.2. Semi-Automated
- 5.1.2. Reagents
- 5.1.2.1. Luminophore Markers
- 5.1.2.2. Enzymatic Markers
- 5.1.3. Consumables
- 5.1.1. Analyzers
- 5.2. Market Analysis, Insights and Forecast - by Application
- 5.2.1. Oncology
- 5.2.2. Autoimmune Disorder
- 5.2.3. Infectious Disease
- 5.2.4. Cardiovascular Disease
- 5.2.5. Endocrine Disorders
- 5.2.6. Others
- 5.3. Market Analysis, Insights and Forecast - by End User
- 5.3.1. Pharmaceutical and Biotechnology Companies
- 5.3.2. Hospital and Clinical Laboratories
- 5.3.3. Others
- 5.4. Market Analysis, Insights and Forecast - by Region
- 5.4.1. North America
- 5.4.2. Europe
- 5.4.3. Asia Pacific
- 5.4.4. Middle East and Africa
- 5.4.5. South America
- 5.1. Market Analysis, Insights and Forecast - by Product Type
- 6. North America CLIA Immunoassay Industry Analysis, Insights and Forecast, 2019-2031
- 6.1. Market Analysis, Insights and Forecast - by Product Type
- 6.1.1. Analyzers
- 6.1.1.1. Automated
- 6.1.1.2. Semi-Automated
- 6.1.2. Reagents
- 6.1.2.1. Luminophore Markers
- 6.1.2.2. Enzymatic Markers
- 6.1.3. Consumables
- 6.1.1. Analyzers
- 6.2. Market Analysis, Insights and Forecast - by Application
- 6.2.1. Oncology
- 6.2.2. Autoimmune Disorder
- 6.2.3. Infectious Disease
- 6.2.4. Cardiovascular Disease
- 6.2.5. Endocrine Disorders
- 6.2.6. Others
- 6.3. Market Analysis, Insights and Forecast - by End User
- 6.3.1. Pharmaceutical and Biotechnology Companies
- 6.3.2. Hospital and Clinical Laboratories
- 6.3.3. Others
- 6.1. Market Analysis, Insights and Forecast - by Product Type
- 7. Europe CLIA Immunoassay Industry Analysis, Insights and Forecast, 2019-2031
- 7.1. Market Analysis, Insights and Forecast - by Product Type
- 7.1.1. Analyzers
- 7.1.1.1. Automated
- 7.1.1.2. Semi-Automated
- 7.1.2. Reagents
- 7.1.2.1. Luminophore Markers
- 7.1.2.2. Enzymatic Markers
- 7.1.3. Consumables
- 7.1.1. Analyzers
- 7.2. Market Analysis, Insights and Forecast - by Application
- 7.2.1. Oncology
- 7.2.2. Autoimmune Disorder
- 7.2.3. Infectious Disease
- 7.2.4. Cardiovascular Disease
- 7.2.5. Endocrine Disorders
- 7.2.6. Others
- 7.3. Market Analysis, Insights and Forecast - by End User
- 7.3.1. Pharmaceutical and Biotechnology Companies
- 7.3.2. Hospital and Clinical Laboratories
- 7.3.3. Others
- 7.1. Market Analysis, Insights and Forecast - by Product Type
- 8. Asia Pacific CLIA Immunoassay Industry Analysis, Insights and Forecast, 2019-2031
- 8.1. Market Analysis, Insights and Forecast - by Product Type
- 8.1.1. Analyzers
- 8.1.1.1. Automated
- 8.1.1.2. Semi-Automated
- 8.1.2. Reagents
- 8.1.2.1. Luminophore Markers
- 8.1.2.2. Enzymatic Markers
- 8.1.3. Consumables
- 8.1.1. Analyzers
- 8.2. Market Analysis, Insights and Forecast - by Application
- 8.2.1. Oncology
- 8.2.2. Autoimmune Disorder
- 8.2.3. Infectious Disease
- 8.2.4. Cardiovascular Disease
- 8.2.5. Endocrine Disorders
- 8.2.6. Others
- 8.3. Market Analysis, Insights and Forecast - by End User
- 8.3.1. Pharmaceutical and Biotechnology Companies
- 8.3.2. Hospital and Clinical Laboratories
- 8.3.3. Others
- 8.1. Market Analysis, Insights and Forecast - by Product Type
- 9. Middle East and Africa CLIA Immunoassay Industry Analysis, Insights and Forecast, 2019-2031
- 9.1. Market Analysis, Insights and Forecast - by Product Type
- 9.1.1. Analyzers
- 9.1.1.1. Automated
- 9.1.1.2. Semi-Automated
- 9.1.2. Reagents
- 9.1.2.1. Luminophore Markers
- 9.1.2.2. Enzymatic Markers
- 9.1.3. Consumables
- 9.1.1. Analyzers
- 9.2. Market Analysis, Insights and Forecast - by Application
- 9.2.1. Oncology
- 9.2.2. Autoimmune Disorder
- 9.2.3. Infectious Disease
- 9.2.4. Cardiovascular Disease
- 9.2.5. Endocrine Disorders
- 9.2.6. Others
- 9.3. Market Analysis, Insights and Forecast - by End User
- 9.3.1. Pharmaceutical and Biotechnology Companies
- 9.3.2. Hospital and Clinical Laboratories
- 9.3.3. Others
- 9.1. Market Analysis, Insights and Forecast - by Product Type
- 10. South America CLIA Immunoassay Industry Analysis, Insights and Forecast, 2019-2031
- 10.1. Market Analysis, Insights and Forecast - by Product Type
- 10.1.1. Analyzers
- 10.1.1.1. Automated
- 10.1.1.2. Semi-Automated
- 10.1.2. Reagents
- 10.1.2.1. Luminophore Markers
- 10.1.2.2. Enzymatic Markers
- 10.1.3. Consumables
- 10.1.1. Analyzers
- 10.2. Market Analysis, Insights and Forecast - by Application
- 10.2.1. Oncology
- 10.2.2. Autoimmune Disorder
- 10.2.3. Infectious Disease
- 10.2.4. Cardiovascular Disease
- 10.2.5. Endocrine Disorders
- 10.2.6. Others
- 10.3. Market Analysis, Insights and Forecast - by End User
- 10.3.1. Pharmaceutical and Biotechnology Companies
- 10.3.2. Hospital and Clinical Laboratories
- 10.3.3. Others
- 10.1. Market Analysis, Insights and Forecast - by Product Type
- 11. North America CLIA Immunoassay Industry Analysis, Insights and Forecast, 2019-2031
- 11.1. Market Analysis, Insights and Forecast - By Country/Sub-region
- 11.1.1 United States
- 11.1.2 Canada
- 11.1.3 Mexico
- 12. Europe CLIA Immunoassay Industry Analysis, Insights and Forecast, 2019-2031
- 12.1. Market Analysis, Insights and Forecast - By Country/Sub-region
- 12.1.1 Germany
- 12.1.2 United Kingdom
- 12.1.3 France
- 12.1.4 Italy
- 12.1.5 Spain
- 12.1.6 Rest of Europe
- 13. Asia Pacific CLIA Immunoassay Industry Analysis, Insights and Forecast, 2019-2031
- 13.1. Market Analysis, Insights and Forecast - By Country/Sub-region
- 13.1.1 China
- 13.1.2 Japan
- 13.1.3 India
- 13.1.4 Australia
- 13.1.5 South Korea
- 13.1.6 Rest of Asia Pacific
- 14. Middle East and Africa CLIA Immunoassay Industry Analysis, Insights and Forecast, 2019-2031
- 14.1. Market Analysis, Insights and Forecast - By Country/Sub-region
- 14.1.1 GCC
- 14.1.2 South Africa
- 14.1.3 Rest of Middle East and Africa
- 15. South America CLIA Immunoassay Industry Analysis, Insights and Forecast, 2019-2031
- 15.1. Market Analysis, Insights and Forecast - By Country/Sub-region
- 15.1.1 Brazil
- 15.1.2 Argentina
- 15.1.3 Rest of South America
- 16. Competitive Analysis
- 16.1. Global Market Share Analysis 2024
- 16.2. Company Profiles
- 16.2.1 Randox Laboratories Ltd
- 16.2.1.1. Overview
- 16.2.1.2. Products
- 16.2.1.3. SWOT Analysis
- 16.2.1.4. Recent Developments
- 16.2.1.5. Financials (Based on Availability)
- 16.2.2 BioMerieux
- 16.2.2.1. Overview
- 16.2.2.2. Products
- 16.2.2.3. SWOT Analysis
- 16.2.2.4. Recent Developments
- 16.2.2.5. Financials (Based on Availability)
- 16.2.3 DiaSorin S p A
- 16.2.3.1. Overview
- 16.2.3.2. Products
- 16.2.3.3. SWOT Analysis
- 16.2.3.4. Recent Developments
- 16.2.3.5. Financials (Based on Availability)
- 16.2.4 Siemens Healthineers AG
- 16.2.4.1. Overview
- 16.2.4.2. Products
- 16.2.4.3. SWOT Analysis
- 16.2.4.4. Recent Developments
- 16.2.4.5. Financials (Based on Availability)
- 16.2.5 Tosoh Corporation
- 16.2.5.1. Overview
- 16.2.5.2. Products
- 16.2.5.3. SWOT Analysis
- 16.2.5.4. Recent Developments
- 16.2.5.5. Financials (Based on Availability)
- 16.2.6 F Hoffmann-La Roche AG
- 16.2.6.1. Overview
- 16.2.6.2. Products
- 16.2.6.3. SWOT Analysis
- 16.2.6.4. Recent Developments
- 16.2.6.5. Financials (Based on Availability)
- 16.2.7 Sysmex Corporation
- 16.2.7.1. Overview
- 16.2.7.2. Products
- 16.2.7.3. SWOT Analysis
- 16.2.7.4. Recent Developments
- 16.2.7.5. Financials (Based on Availability)
- 16.2.8 Shenzhen New Industries Biomedical Engineering Co Ltd
- 16.2.8.1. Overview
- 16.2.8.2. Products
- 16.2.8.3. SWOT Analysis
- 16.2.8.4. Recent Developments
- 16.2.8.5. Financials (Based on Availability)
- 16.2.9 Shenzhen Mindray Bio-Medical Electronics Co Ltd
- 16.2.9.1. Overview
- 16.2.9.2. Products
- 16.2.9.3. SWOT Analysis
- 16.2.9.4. Recent Developments
- 16.2.9.5. Financials (Based on Availability)
- 16.2.10 Danaher (Beckman Coulter Inc )
- 16.2.10.1. Overview
- 16.2.10.2. Products
- 16.2.10.3. SWOT Analysis
- 16.2.10.4. Recent Developments
- 16.2.10.5. Financials (Based on Availability)
- 16.2.1 Randox Laboratories Ltd
List of Figures
- Figure 1: Global CLIA Immunoassay Industry Revenue Breakdown (Million, %) by Region 2024 & 2032
- Figure 2: Global CLIA Immunoassay Industry Volume Breakdown (K Unit, %) by Region 2024 & 2032
- Figure 3: North America CLIA Immunoassay Industry Revenue (Million), by Country 2024 & 2032
- Figure 4: North America CLIA Immunoassay Industry Volume (K Unit), by Country 2024 & 2032
- Figure 5: North America CLIA Immunoassay Industry Revenue Share (%), by Country 2024 & 2032
- Figure 6: North America CLIA Immunoassay Industry Volume Share (%), by Country 2024 & 2032
- Figure 7: Europe CLIA Immunoassay Industry Revenue (Million), by Country 2024 & 2032
- Figure 8: Europe CLIA Immunoassay Industry Volume (K Unit), by Country 2024 & 2032
- Figure 9: Europe CLIA Immunoassay Industry Revenue Share (%), by Country 2024 & 2032
- Figure 10: Europe CLIA Immunoassay Industry Volume Share (%), by Country 2024 & 2032
- Figure 11: Asia Pacific CLIA Immunoassay Industry Revenue (Million), by Country 2024 & 2032
- Figure 12: Asia Pacific CLIA Immunoassay Industry Volume (K Unit), by Country 2024 & 2032
- Figure 13: Asia Pacific CLIA Immunoassay Industry Revenue Share (%), by Country 2024 & 2032
- Figure 14: Asia Pacific CLIA Immunoassay Industry Volume Share (%), by Country 2024 & 2032
- Figure 15: Middle East and Africa CLIA Immunoassay Industry Revenue (Million), by Country 2024 & 2032
- Figure 16: Middle East and Africa CLIA Immunoassay Industry Volume (K Unit), by Country 2024 & 2032
- Figure 17: Middle East and Africa CLIA Immunoassay Industry Revenue Share (%), by Country 2024 & 2032
- Figure 18: Middle East and Africa CLIA Immunoassay Industry Volume Share (%), by Country 2024 & 2032
- Figure 19: South America CLIA Immunoassay Industry Revenue (Million), by Country 2024 & 2032
- Figure 20: South America CLIA Immunoassay Industry Volume (K Unit), by Country 2024 & 2032
- Figure 21: South America CLIA Immunoassay Industry Revenue Share (%), by Country 2024 & 2032
- Figure 22: South America CLIA Immunoassay Industry Volume Share (%), by Country 2024 & 2032
- Figure 23: North America CLIA Immunoassay Industry Revenue (Million), by Product Type 2024 & 2032
- Figure 24: North America CLIA Immunoassay Industry Volume (K Unit), by Product Type 2024 & 2032
- Figure 25: North America CLIA Immunoassay Industry Revenue Share (%), by Product Type 2024 & 2032
- Figure 26: North America CLIA Immunoassay Industry Volume Share (%), by Product Type 2024 & 2032
- Figure 27: North America CLIA Immunoassay Industry Revenue (Million), by Application 2024 & 2032
- Figure 28: North America CLIA Immunoassay Industry Volume (K Unit), by Application 2024 & 2032
- Figure 29: North America CLIA Immunoassay Industry Revenue Share (%), by Application 2024 & 2032
- Figure 30: North America CLIA Immunoassay Industry Volume Share (%), by Application 2024 & 2032
- Figure 31: North America CLIA Immunoassay Industry Revenue (Million), by End User 2024 & 2032
- Figure 32: North America CLIA Immunoassay Industry Volume (K Unit), by End User 2024 & 2032
- Figure 33: North America CLIA Immunoassay Industry Revenue Share (%), by End User 2024 & 2032
- Figure 34: North America CLIA Immunoassay Industry Volume Share (%), by End User 2024 & 2032
- Figure 35: North America CLIA Immunoassay Industry Revenue (Million), by Country 2024 & 2032
- Figure 36: North America CLIA Immunoassay Industry Volume (K Unit), by Country 2024 & 2032
- Figure 37: North America CLIA Immunoassay Industry Revenue Share (%), by Country 2024 & 2032
- Figure 38: North America CLIA Immunoassay Industry Volume Share (%), by Country 2024 & 2032
- Figure 39: Europe CLIA Immunoassay Industry Revenue (Million), by Product Type 2024 & 2032
- Figure 40: Europe CLIA Immunoassay Industry Volume (K Unit), by Product Type 2024 & 2032
- Figure 41: Europe CLIA Immunoassay Industry Revenue Share (%), by Product Type 2024 & 2032
- Figure 42: Europe CLIA Immunoassay Industry Volume Share (%), by Product Type 2024 & 2032
- Figure 43: Europe CLIA Immunoassay Industry Revenue (Million), by Application 2024 & 2032
- Figure 44: Europe CLIA Immunoassay Industry Volume (K Unit), by Application 2024 & 2032
- Figure 45: Europe CLIA Immunoassay Industry Revenue Share (%), by Application 2024 & 2032
- Figure 46: Europe CLIA Immunoassay Industry Volume Share (%), by Application 2024 & 2032
- Figure 47: Europe CLIA Immunoassay Industry Revenue (Million), by End User 2024 & 2032
- Figure 48: Europe CLIA Immunoassay Industry Volume (K Unit), by End User 2024 & 2032
- Figure 49: Europe CLIA Immunoassay Industry Revenue Share (%), by End User 2024 & 2032
- Figure 50: Europe CLIA Immunoassay Industry Volume Share (%), by End User 2024 & 2032
- Figure 51: Europe CLIA Immunoassay Industry Revenue (Million), by Country 2024 & 2032
- Figure 52: Europe CLIA Immunoassay Industry Volume (K Unit), by Country 2024 & 2032
- Figure 53: Europe CLIA Immunoassay Industry Revenue Share (%), by Country 2024 & 2032
- Figure 54: Europe CLIA Immunoassay Industry Volume Share (%), by Country 2024 & 2032
- Figure 55: Asia Pacific CLIA Immunoassay Industry Revenue (Million), by Product Type 2024 & 2032
- Figure 56: Asia Pacific CLIA Immunoassay Industry Volume (K Unit), by Product Type 2024 & 2032
- Figure 57: Asia Pacific CLIA Immunoassay Industry Revenue Share (%), by Product Type 2024 & 2032
- Figure 58: Asia Pacific CLIA Immunoassay Industry Volume Share (%), by Product Type 2024 & 2032
- Figure 59: Asia Pacific CLIA Immunoassay Industry Revenue (Million), by Application 2024 & 2032
- Figure 60: Asia Pacific CLIA Immunoassay Industry Volume (K Unit), by Application 2024 & 2032
- Figure 61: Asia Pacific CLIA Immunoassay Industry Revenue Share (%), by Application 2024 & 2032
- Figure 62: Asia Pacific CLIA Immunoassay Industry Volume Share (%), by Application 2024 & 2032
- Figure 63: Asia Pacific CLIA Immunoassay Industry Revenue (Million), by End User 2024 & 2032
- Figure 64: Asia Pacific CLIA Immunoassay Industry Volume (K Unit), by End User 2024 & 2032
- Figure 65: Asia Pacific CLIA Immunoassay Industry Revenue Share (%), by End User 2024 & 2032
- Figure 66: Asia Pacific CLIA Immunoassay Industry Volume Share (%), by End User 2024 & 2032
- Figure 67: Asia Pacific CLIA Immunoassay Industry Revenue (Million), by Country 2024 & 2032
- Figure 68: Asia Pacific CLIA Immunoassay Industry Volume (K Unit), by Country 2024 & 2032
- Figure 69: Asia Pacific CLIA Immunoassay Industry Revenue Share (%), by Country 2024 & 2032
- Figure 70: Asia Pacific CLIA Immunoassay Industry Volume Share (%), by Country 2024 & 2032
- Figure 71: Middle East and Africa CLIA Immunoassay Industry Revenue (Million), by Product Type 2024 & 2032
- Figure 72: Middle East and Africa CLIA Immunoassay Industry Volume (K Unit), by Product Type 2024 & 2032
- Figure 73: Middle East and Africa CLIA Immunoassay Industry Revenue Share (%), by Product Type 2024 & 2032
- Figure 74: Middle East and Africa CLIA Immunoassay Industry Volume Share (%), by Product Type 2024 & 2032
- Figure 75: Middle East and Africa CLIA Immunoassay Industry Revenue (Million), by Application 2024 & 2032
- Figure 76: Middle East and Africa CLIA Immunoassay Industry Volume (K Unit), by Application 2024 & 2032
- Figure 77: Middle East and Africa CLIA Immunoassay Industry Revenue Share (%), by Application 2024 & 2032
- Figure 78: Middle East and Africa CLIA Immunoassay Industry Volume Share (%), by Application 2024 & 2032
- Figure 79: Middle East and Africa CLIA Immunoassay Industry Revenue (Million), by End User 2024 & 2032
- Figure 80: Middle East and Africa CLIA Immunoassay Industry Volume (K Unit), by End User 2024 & 2032
- Figure 81: Middle East and Africa CLIA Immunoassay Industry Revenue Share (%), by End User 2024 & 2032
- Figure 82: Middle East and Africa CLIA Immunoassay Industry Volume Share (%), by End User 2024 & 2032
- Figure 83: Middle East and Africa CLIA Immunoassay Industry Revenue (Million), by Country 2024 & 2032
- Figure 84: Middle East and Africa CLIA Immunoassay Industry Volume (K Unit), by Country 2024 & 2032
- Figure 85: Middle East and Africa CLIA Immunoassay Industry Revenue Share (%), by Country 2024 & 2032
- Figure 86: Middle East and Africa CLIA Immunoassay Industry Volume Share (%), by Country 2024 & 2032
- Figure 87: South America CLIA Immunoassay Industry Revenue (Million), by Product Type 2024 & 2032
- Figure 88: South America CLIA Immunoassay Industry Volume (K Unit), by Product Type 2024 & 2032
- Figure 89: South America CLIA Immunoassay Industry Revenue Share (%), by Product Type 2024 & 2032
- Figure 90: South America CLIA Immunoassay Industry Volume Share (%), by Product Type 2024 & 2032
- Figure 91: South America CLIA Immunoassay Industry Revenue (Million), by Application 2024 & 2032
- Figure 92: South America CLIA Immunoassay Industry Volume (K Unit), by Application 2024 & 2032
- Figure 93: South America CLIA Immunoassay Industry Revenue Share (%), by Application 2024 & 2032
- Figure 94: South America CLIA Immunoassay Industry Volume Share (%), by Application 2024 & 2032
- Figure 95: South America CLIA Immunoassay Industry Revenue (Million), by End User 2024 & 2032
- Figure 96: South America CLIA Immunoassay Industry Volume (K Unit), by End User 2024 & 2032
- Figure 97: South America CLIA Immunoassay Industry Revenue Share (%), by End User 2024 & 2032
- Figure 98: South America CLIA Immunoassay Industry Volume Share (%), by End User 2024 & 2032
- Figure 99: South America CLIA Immunoassay Industry Revenue (Million), by Country 2024 & 2032
- Figure 100: South America CLIA Immunoassay Industry Volume (K Unit), by Country 2024 & 2032
- Figure 101: South America CLIA Immunoassay Industry Revenue Share (%), by Country 2024 & 2032
- Figure 102: South America CLIA Immunoassay Industry Volume Share (%), by Country 2024 & 2032
List of Tables
- Table 1: Global CLIA Immunoassay Industry Revenue Million Forecast, by Region 2019 & 2032
- Table 2: Global CLIA Immunoassay Industry Volume K Unit Forecast, by Region 2019 & 2032
- Table 3: Global CLIA Immunoassay Industry Revenue Million Forecast, by Product Type 2019 & 2032
- Table 4: Global CLIA Immunoassay Industry Volume K Unit Forecast, by Product Type 2019 & 2032
- Table 5: Global CLIA Immunoassay Industry Revenue Million Forecast, by Application 2019 & 2032
- Table 6: Global CLIA Immunoassay Industry Volume K Unit Forecast, by Application 2019 & 2032
- Table 7: Global CLIA Immunoassay Industry Revenue Million Forecast, by End User 2019 & 2032
- Table 8: Global CLIA Immunoassay Industry Volume K Unit Forecast, by End User 2019 & 2032
- Table 9: Global CLIA Immunoassay Industry Revenue Million Forecast, by Region 2019 & 2032
- Table 10: Global CLIA Immunoassay Industry Volume K Unit Forecast, by Region 2019 & 2032
- Table 11: Global CLIA Immunoassay Industry Revenue Million Forecast, by Country 2019 & 2032
- Table 12: Global CLIA Immunoassay Industry Volume K Unit Forecast, by Country 2019 & 2032
- Table 13: United States CLIA Immunoassay Industry Revenue (Million) Forecast, by Application 2019 & 2032
- Table 14: United States CLIA Immunoassay Industry Volume (K Unit) Forecast, by Application 2019 & 2032
- Table 15: Canada CLIA Immunoassay Industry Revenue (Million) Forecast, by Application 2019 & 2032
- Table 16: Canada CLIA Immunoassay Industry Volume (K Unit) Forecast, by Application 2019 & 2032
- Table 17: Mexico CLIA Immunoassay Industry Revenue (Million) Forecast, by Application 2019 & 2032
- Table 18: Mexico CLIA Immunoassay Industry Volume (K Unit) Forecast, by Application 2019 & 2032
- Table 19: Global CLIA Immunoassay Industry Revenue Million Forecast, by Country 2019 & 2032
- Table 20: Global CLIA Immunoassay Industry Volume K Unit Forecast, by Country 2019 & 2032
- Table 21: Germany CLIA Immunoassay Industry Revenue (Million) Forecast, by Application 2019 & 2032
- Table 22: Germany CLIA Immunoassay Industry Volume (K Unit) Forecast, by Application 2019 & 2032
- Table 23: United Kingdom CLIA Immunoassay Industry Revenue (Million) Forecast, by Application 2019 & 2032
- Table 24: United Kingdom CLIA Immunoassay Industry Volume (K Unit) Forecast, by Application 2019 & 2032
- Table 25: France CLIA Immunoassay Industry Revenue (Million) Forecast, by Application 2019 & 2032
- Table 26: France CLIA Immunoassay Industry Volume (K Unit) Forecast, by Application 2019 & 2032
- Table 27: Italy CLIA Immunoassay Industry Revenue (Million) Forecast, by Application 2019 & 2032
- Table 28: Italy CLIA Immunoassay Industry Volume (K Unit) Forecast, by Application 2019 & 2032
- Table 29: Spain CLIA Immunoassay Industry Revenue (Million) Forecast, by Application 2019 & 2032
- Table 30: Spain CLIA Immunoassay Industry Volume (K Unit) Forecast, by Application 2019 & 2032
- Table 31: Rest of Europe CLIA Immunoassay Industry Revenue (Million) Forecast, by Application 2019 & 2032
- Table 32: Rest of Europe CLIA Immunoassay Industry Volume (K Unit) Forecast, by Application 2019 & 2032
- Table 33: Global CLIA Immunoassay Industry Revenue Million Forecast, by Country 2019 & 2032
- Table 34: Global CLIA Immunoassay Industry Volume K Unit Forecast, by Country 2019 & 2032
- Table 35: China CLIA Immunoassay Industry Revenue (Million) Forecast, by Application 2019 & 2032
- Table 36: China CLIA Immunoassay Industry Volume (K Unit) Forecast, by Application 2019 & 2032
- Table 37: Japan CLIA Immunoassay Industry Revenue (Million) Forecast, by Application 2019 & 2032
- Table 38: Japan CLIA Immunoassay Industry Volume (K Unit) Forecast, by Application 2019 & 2032
- Table 39: India CLIA Immunoassay Industry Revenue (Million) Forecast, by Application 2019 & 2032
- Table 40: India CLIA Immunoassay Industry Volume (K Unit) Forecast, by Application 2019 & 2032
- Table 41: Australia CLIA Immunoassay Industry Revenue (Million) Forecast, by Application 2019 & 2032
- Table 42: Australia CLIA Immunoassay Industry Volume (K Unit) Forecast, by Application 2019 & 2032
- Table 43: South Korea CLIA Immunoassay Industry Revenue (Million) Forecast, by Application 2019 & 2032
- Table 44: South Korea CLIA Immunoassay Industry Volume (K Unit) Forecast, by Application 2019 & 2032
- Table 45: Rest of Asia Pacific CLIA Immunoassay Industry Revenue (Million) Forecast, by Application 2019 & 2032
- Table 46: Rest of Asia Pacific CLIA Immunoassay Industry Volume (K Unit) Forecast, by Application 2019 & 2032
- Table 47: Global CLIA Immunoassay Industry Revenue Million Forecast, by Country 2019 & 2032
- Table 48: Global CLIA Immunoassay Industry Volume K Unit Forecast, by Country 2019 & 2032
- Table 49: GCC CLIA Immunoassay Industry Revenue (Million) Forecast, by Application 2019 & 2032
- Table 50: GCC CLIA Immunoassay Industry Volume (K Unit) Forecast, by Application 2019 & 2032
- Table 51: South Africa CLIA Immunoassay Industry Revenue (Million) Forecast, by Application 2019 & 2032
- Table 52: South Africa CLIA Immunoassay Industry Volume (K Unit) Forecast, by Application 2019 & 2032
- Table 53: Rest of Middle East and Africa CLIA Immunoassay Industry Revenue (Million) Forecast, by Application 2019 & 2032
- Table 54: Rest of Middle East and Africa CLIA Immunoassay Industry Volume (K Unit) Forecast, by Application 2019 & 2032
- Table 55: Global CLIA Immunoassay Industry Revenue Million Forecast, by Country 2019 & 2032
- Table 56: Global CLIA Immunoassay Industry Volume K Unit Forecast, by Country 2019 & 2032
- Table 57: Brazil CLIA Immunoassay Industry Revenue (Million) Forecast, by Application 2019 & 2032
- Table 58: Brazil CLIA Immunoassay Industry Volume (K Unit) Forecast, by Application 2019 & 2032
- Table 59: Argentina CLIA Immunoassay Industry Revenue (Million) Forecast, by Application 2019 & 2032
- Table 60: Argentina CLIA Immunoassay Industry Volume (K Unit) Forecast, by Application 2019 & 2032
- Table 61: Rest of South America CLIA Immunoassay Industry Revenue (Million) Forecast, by Application 2019 & 2032
- Table 62: Rest of South America CLIA Immunoassay Industry Volume (K Unit) Forecast, by Application 2019 & 2032
- Table 63: Global CLIA Immunoassay Industry Revenue Million Forecast, by Product Type 2019 & 2032
- Table 64: Global CLIA Immunoassay Industry Volume K Unit Forecast, by Product Type 2019 & 2032
- Table 65: Global CLIA Immunoassay Industry Revenue Million Forecast, by Application 2019 & 2032
- Table 66: Global CLIA Immunoassay Industry Volume K Unit Forecast, by Application 2019 & 2032
- Table 67: Global CLIA Immunoassay Industry Revenue Million Forecast, by End User 2019 & 2032
- Table 68: Global CLIA Immunoassay Industry Volume K Unit Forecast, by End User 2019 & 2032
- Table 69: Global CLIA Immunoassay Industry Revenue Million Forecast, by Country 2019 & 2032
- Table 70: Global CLIA Immunoassay Industry Volume K Unit Forecast, by Country 2019 & 2032
- Table 71: United States CLIA Immunoassay Industry Revenue (Million) Forecast, by Application 2019 & 2032
- Table 72: United States CLIA Immunoassay Industry Volume (K Unit) Forecast, by Application 2019 & 2032
- Table 73: Canada CLIA Immunoassay Industry Revenue (Million) Forecast, by Application 2019 & 2032
- Table 74: Canada CLIA Immunoassay Industry Volume (K Unit) Forecast, by Application 2019 & 2032
- Table 75: Mexico CLIA Immunoassay Industry Revenue (Million) Forecast, by Application 2019 & 2032
- Table 76: Mexico CLIA Immunoassay Industry Volume (K Unit) Forecast, by Application 2019 & 2032
- Table 77: Global CLIA Immunoassay Industry Revenue Million Forecast, by Product Type 2019 & 2032
- Table 78: Global CLIA Immunoassay Industry Volume K Unit Forecast, by Product Type 2019 & 2032
- Table 79: Global CLIA Immunoassay Industry Revenue Million Forecast, by Application 2019 & 2032
- Table 80: Global CLIA Immunoassay Industry Volume K Unit Forecast, by Application 2019 & 2032
- Table 81: Global CLIA Immunoassay Industry Revenue Million Forecast, by End User 2019 & 2032
- Table 82: Global CLIA Immunoassay Industry Volume K Unit Forecast, by End User 2019 & 2032
- Table 83: Global CLIA Immunoassay Industry Revenue Million Forecast, by Country 2019 & 2032
- Table 84: Global CLIA Immunoassay Industry Volume K Unit Forecast, by Country 2019 & 2032
- Table 85: Germany CLIA Immunoassay Industry Revenue (Million) Forecast, by Application 2019 & 2032
- Table 86: Germany CLIA Immunoassay Industry Volume (K Unit) Forecast, by Application 2019 & 2032
- Table 87: United Kingdom CLIA Immunoassay Industry Revenue (Million) Forecast, by Application 2019 & 2032
- Table 88: United Kingdom CLIA Immunoassay Industry Volume (K Unit) Forecast, by Application 2019 & 2032
- Table 89: France CLIA Immunoassay Industry Revenue (Million) Forecast, by Application 2019 & 2032
- Table 90: France CLIA Immunoassay Industry Volume (K Unit) Forecast, by Application 2019 & 2032
- Table 91: Italy CLIA Immunoassay Industry Revenue (Million) Forecast, by Application 2019 & 2032
- Table 92: Italy CLIA Immunoassay Industry Volume (K Unit) Forecast, by Application 2019 & 2032
- Table 93: Spain CLIA Immunoassay Industry Revenue (Million) Forecast, by Application 2019 & 2032
- Table 94: Spain CLIA Immunoassay Industry Volume (K Unit) Forecast, by Application 2019 & 2032
- Table 95: Rest of Europe CLIA Immunoassay Industry Revenue (Million) Forecast, by Application 2019 & 2032
- Table 96: Rest of Europe CLIA Immunoassay Industry Volume (K Unit) Forecast, by Application 2019 & 2032
- Table 97: Global CLIA Immunoassay Industry Revenue Million Forecast, by Product Type 2019 & 2032
- Table 98: Global CLIA Immunoassay Industry Volume K Unit Forecast, by Product Type 2019 & 2032
- Table 99: Global CLIA Immunoassay Industry Revenue Million Forecast, by Application 2019 & 2032
- Table 100: Global CLIA Immunoassay Industry Volume K Unit Forecast, by Application 2019 & 2032
- Table 101: Global CLIA Immunoassay Industry Revenue Million Forecast, by End User 2019 & 2032
- Table 102: Global CLIA Immunoassay Industry Volume K Unit Forecast, by End User 2019 & 2032
- Table 103: Global CLIA Immunoassay Industry Revenue Million Forecast, by Country 2019 & 2032
- Table 104: Global CLIA Immunoassay Industry Volume K Unit Forecast, by Country 2019 & 2032
- Table 105: China CLIA Immunoassay Industry Revenue (Million) Forecast, by Application 2019 & 2032
- Table 106: China CLIA Immunoassay Industry Volume (K Unit) Forecast, by Application 2019 & 2032
- Table 107: Japan CLIA Immunoassay Industry Revenue (Million) Forecast, by Application 2019 & 2032
- Table 108: Japan CLIA Immunoassay Industry Volume (K Unit) Forecast, by Application 2019 & 2032
- Table 109: India CLIA Immunoassay Industry Revenue (Million) Forecast, by Application 2019 & 2032
- Table 110: India CLIA Immunoassay Industry Volume (K Unit) Forecast, by Application 2019 & 2032
- Table 111: Australia CLIA Immunoassay Industry Revenue (Million) Forecast, by Application 2019 & 2032
- Table 112: Australia CLIA Immunoassay Industry Volume (K Unit) Forecast, by Application 2019 & 2032
- Table 113: South Korea CLIA Immunoassay Industry Revenue (Million) Forecast, by Application 2019 & 2032
- Table 114: South Korea CLIA Immunoassay Industry Volume (K Unit) Forecast, by Application 2019 & 2032
- Table 115: Rest of Asia Pacific CLIA Immunoassay Industry Revenue (Million) Forecast, by Application 2019 & 2032
- Table 116: Rest of Asia Pacific CLIA Immunoassay Industry Volume (K Unit) Forecast, by Application 2019 & 2032
- Table 117: Global CLIA Immunoassay Industry Revenue Million Forecast, by Product Type 2019 & 2032
- Table 118: Global CLIA Immunoassay Industry Volume K Unit Forecast, by Product Type 2019 & 2032
- Table 119: Global CLIA Immunoassay Industry Revenue Million Forecast, by Application 2019 & 2032
- Table 120: Global CLIA Immunoassay Industry Volume K Unit Forecast, by Application 2019 & 2032
- Table 121: Global CLIA Immunoassay Industry Revenue Million Forecast, by End User 2019 & 2032
- Table 122: Global CLIA Immunoassay Industry Volume K Unit Forecast, by End User 2019 & 2032
- Table 123: Global CLIA Immunoassay Industry Revenue Million Forecast, by Country 2019 & 2032
- Table 124: Global CLIA Immunoassay Industry Volume K Unit Forecast, by Country 2019 & 2032
- Table 125: GCC CLIA Immunoassay Industry Revenue (Million) Forecast, by Application 2019 & 2032
- Table 126: GCC CLIA Immunoassay Industry Volume (K Unit) Forecast, by Application 2019 & 2032
- Table 127: South Africa CLIA Immunoassay Industry Revenue (Million) Forecast, by Application 2019 & 2032
- Table 128: South Africa CLIA Immunoassay Industry Volume (K Unit) Forecast, by Application 2019 & 2032
- Table 129: Rest of Middle East and Africa CLIA Immunoassay Industry Revenue (Million) Forecast, by Application 2019 & 2032
- Table 130: Rest of Middle East and Africa CLIA Immunoassay Industry Volume (K Unit) Forecast, by Application 2019 & 2032
- Table 131: Global CLIA Immunoassay Industry Revenue Million Forecast, by Product Type 2019 & 2032
- Table 132: Global CLIA Immunoassay Industry Volume K Unit Forecast, by Product Type 2019 & 2032
- Table 133: Global CLIA Immunoassay Industry Revenue Million Forecast, by Application 2019 & 2032
- Table 134: Global CLIA Immunoassay Industry Volume K Unit Forecast, by Application 2019 & 2032
- Table 135: Global CLIA Immunoassay Industry Revenue Million Forecast, by End User 2019 & 2032
- Table 136: Global CLIA Immunoassay Industry Volume K Unit Forecast, by End User 2019 & 2032
- Table 137: Global CLIA Immunoassay Industry Revenue Million Forecast, by Country 2019 & 2032
- Table 138: Global CLIA Immunoassay Industry Volume K Unit Forecast, by Country 2019 & 2032
- Table 139: Brazil CLIA Immunoassay Industry Revenue (Million) Forecast, by Application 2019 & 2032
- Table 140: Brazil CLIA Immunoassay Industry Volume (K Unit) Forecast, by Application 2019 & 2032
- Table 141: Argentina CLIA Immunoassay Industry Revenue (Million) Forecast, by Application 2019 & 2032
- Table 142: Argentina CLIA Immunoassay Industry Volume (K Unit) Forecast, by Application 2019 & 2032
- Table 143: Rest of South America CLIA Immunoassay Industry Revenue (Million) Forecast, by Application 2019 & 2032
- Table 144: Rest of South America CLIA Immunoassay Industry Volume (K Unit) Forecast, by Application 2019 & 2032
Frequently Asked Questions
1. What is the projected Compound Annual Growth Rate (CAGR) of the CLIA Immunoassay Industry?
The projected CAGR is approximately 6.60%.
2. Which companies are prominent players in the CLIA Immunoassay Industry?
Key companies in the market include Randox Laboratories Ltd, BioMerieux, DiaSorin S p A, Siemens Healthineers AG, Tosoh Corporation, F Hoffmann-La Roche AG, Sysmex Corporation, Shenzhen New Industries Biomedical Engineering Co Ltd, Shenzhen Mindray Bio-Medical Electronics Co Ltd, Danaher (Beckman Coulter Inc ).
3. What are the main segments of the CLIA Immunoassay Industry?
The market segments include Product Type, Application, End User.
4. Can you provide details about the market size?
The market size is estimated to be USD XX Million as of 2022.
5. What are some drivers contributing to market growth?
Rising Incidence of Chronic Diseases; Increasing Technological Advancements.
6. What are the notable trends driving market growth?
Oncology Segment is Expected to Hold the Largest Market Share.
7. Are there any restraints impacting market growth?
Lack of Skilled Professionals.
8. Can you provide examples of recent developments in the market?
In June 2022, Roche launched the BenchMark ULTRA PLUS system, the newest advanced tissue staining platform. The BenchMark ULTRA PLUS instrument is intended to automatically stain histological or cytological specimens on microscopic slides with specific immunohistochemistry, immunocytochemistry, or in situ hybridization reagents for in vitro diagnostic (IVD) use.
9. What pricing options are available for accessing the report?
Pricing options include single-user, multi-user, and enterprise licenses priced at USD 4750, USD 5250, and USD 8750 respectively.
10. Is the market size provided in terms of value or volume?
The market size is provided in terms of value, measured in Million and volume, measured in K Unit.
11. Are there any specific market keywords associated with the report?
Yes, the market keyword associated with the report is "CLIA Immunoassay Industry," which aids in identifying and referencing the specific market segment covered.
12. How do I determine which pricing option suits my needs best?
The pricing options vary based on user requirements and access needs. Individual users may opt for single-user licenses, while businesses requiring broader access may choose multi-user or enterprise licenses for cost-effective access to the report.
13. Are there any additional resources or data provided in the CLIA Immunoassay Industry report?
While the report offers comprehensive insights, it's advisable to review the specific contents or supplementary materials provided to ascertain if additional resources or data are available.
14. How can I stay updated on further developments or reports in the CLIA Immunoassay Industry?
To stay informed about further developments, trends, and reports in the CLIA Immunoassay Industry, consider subscribing to industry newsletters, following relevant companies and organizations, or regularly checking reputable industry news sources and publications.
Methodology
Step 1 - Identification of Relevant Samples Size from Population Database


Step 2 - Approaches for Defining Global Market Size (Value, Volume* & Price*)

Note*: In applicable scenarios
Step 3 - Data Sources
Primary Research
- Web Analytics
- Survey Reports
- Research Institute
- Latest Research Reports
- Opinion Leaders
Secondary Research
- Annual Reports
- White Paper
- Latest Press Release
- Industry Association
- Paid Database
- Investor Presentations

Step 4 - Data Triangulation
Involves using different sources of information in order to increase the validity of a study
These sources are likely to be stakeholders in a program - participants, other researchers, program staff, other community members, and so on.
Then we put all data in single framework & apply various statistical tools to find out the dynamic on the market.
During the analysis stage, feedback from the stakeholder groups would be compared to determine areas of agreement as well as areas of divergence
