

Key Insights
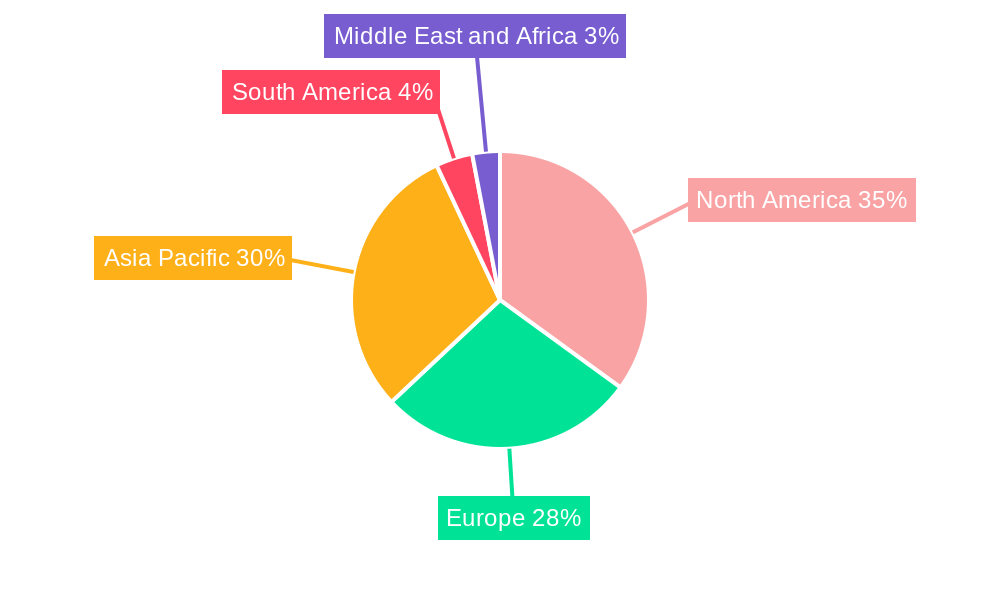
The Ceramic Matrix Composites (CMC) market is experiencing robust growth, driven by increasing demand across diverse sectors. A CAGR exceeding 10% indicates a significant expansion, projected to reach substantial value in the coming years. Key drivers include the aerospace industry's need for lightweight, high-temperature materials in aircraft engines and other components, the automotive sector's pursuit of fuel efficiency improvements through lighter vehicle parts, and the energy sector's demand for advanced materials in power generation and transmission systems. Furthermore, advancements in manufacturing techniques are reducing production costs and improving the performance of CMCs, further fueling market expansion. The market segmentation reveals a strong presence of C/C and C/SiC composites, which are particularly well-suited for high-temperature applications. Geographically, the Asia-Pacific region, particularly China and India, is expected to lead growth due to significant investments in infrastructure development and manufacturing, closely followed by North America and Europe, driven by strong aerospace and defense sectors. While challenges such as high production costs and the need for specialized manufacturing processes exist, ongoing technological advancements and the rising demand for high-performance materials are expected to outweigh these restraints, ensuring continued market growth through 2033.
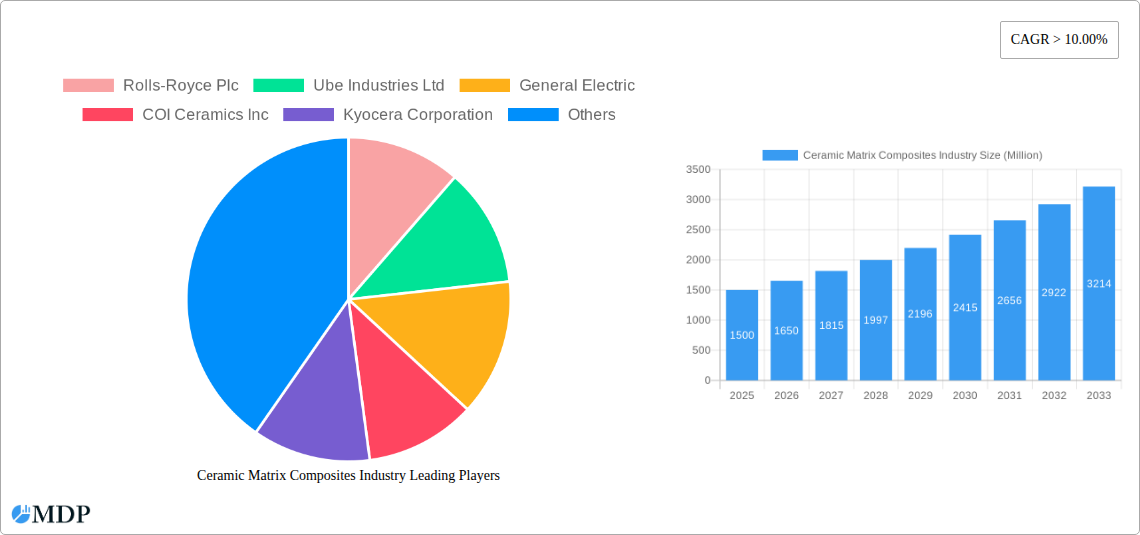
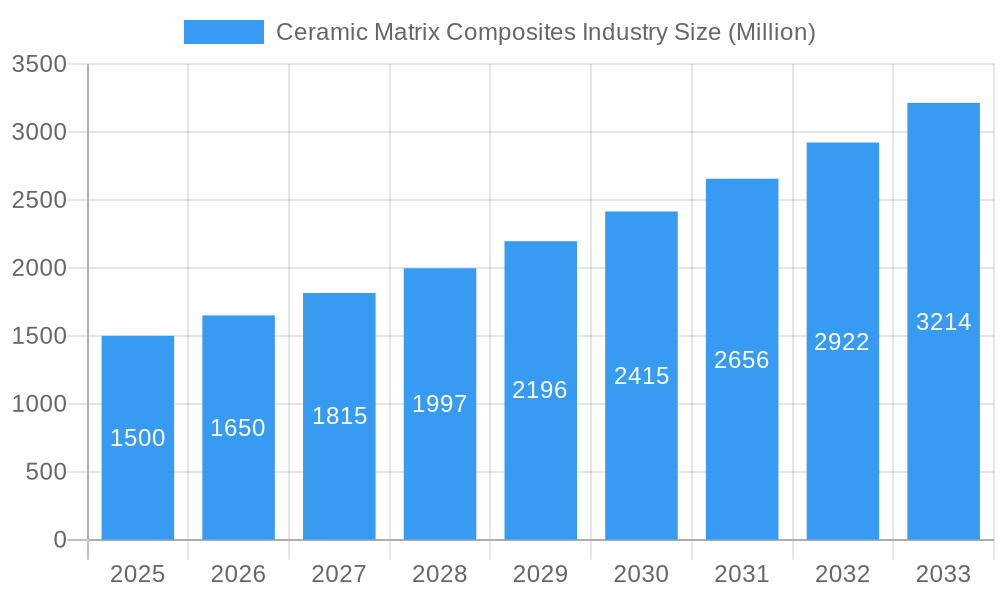
Ceramic Matrix Composites Industry Market Size (In Billion)
The competitive landscape is marked by both established players and emerging companies. Major players like Rolls-Royce, General Electric, and 3M leverage their extensive experience and technological expertise to dominate market share. However, smaller, specialized companies are also making significant contributions, introducing innovative CMC materials and applications. This competitive dynamism fuels innovation and ensures a diverse range of products and solutions within the CMC market. The forecast period from 2025-2033 presents significant opportunities for growth, particularly for companies that can effectively address the growing demand from key end-user industries and adapt to evolving technological advancements in CMC manufacturing and applications. Strategic partnerships, mergers and acquisitions, and focused R&D efforts will be crucial for companies seeking to gain a competitive edge in this rapidly expanding market.
Ceramic Matrix Composites Industry Company Market Share
Dive Deep into the Thriving Ceramic Matrix Composites (CMC) Industry: A Comprehensive Market Report (2019-2033)
This in-depth report provides a comprehensive analysis of the Ceramic Matrix Composites (CMC) industry, offering invaluable insights for stakeholders seeking to navigate this dynamic market. With a study period spanning 2019-2033, a base year of 2025, and a forecast period extending to 2033, this report unveils the key trends, challenges, and opportunities shaping the future of CMCs. The market is projected to reach xx Million by 2033, exhibiting a robust CAGR of xx% during the forecast period.
Ceramic Matrix Composites Industry Market Dynamics & Concentration
The Ceramic Matrix Composites (CMC) market is characterized by a moderately concentrated landscape, with key players like Rolls-Royce Plc, Ube Industries Ltd, and General Electric holding significant market share. The combined market share of the top five players is estimated at xx%, reflecting a degree of consolidation. However, the presence of several smaller, specialized players such as COI Ceramics Inc, Kyocera Corporation, and 3M indicates ongoing competition and innovation. Market concentration is influenced by factors such as:
- Technological Innovation: Continuous advancements in CMC manufacturing techniques, including enhanced processing methods and material development, are driving market dynamics.
- Stringent Regulatory Frameworks: Stringent safety and performance standards, particularly within the aerospace and defense sectors, shape market entry and product development strategies. Compliance costs can be a significant barrier for smaller players.
- Substitute Materials: Competition from alternative materials, such as advanced polymers and metal alloys, influences the adoption of CMCs in specific applications. The cost-effectiveness and performance characteristics of substitutes heavily influence market penetration.
- End-User Trends: Growing demand for lightweight, high-temperature resistant materials across diverse industries, including aerospace, automotive, and energy, fuels market expansion. Shifting consumer preferences toward fuel-efficient vehicles and environmentally friendly technologies directly impact demand for CMCs.
- Mergers & Acquisitions (M&A): The CMC industry has witnessed a moderate level of M&A activity in recent years, with approximately xx deals recorded between 2019 and 2024. These activities primarily aimed at expanding product portfolios, enhancing technological capabilities, and securing access to new markets.
Ceramic Matrix Composites Industry Industry Trends & Analysis
The global Ceramic Matrix Composites (CMC) market is experiencing significant growth, driven by several key factors. The rising demand for high-performance materials in various applications, particularly in aerospace and defense, is a primary growth driver. The increasing adoption of CMCs in gas turbine engines, due to their superior heat resistance and lightweight properties, is a notable trend. Technological advancements in CMC manufacturing, such as chemical vapor infiltration (CVI) and polymer-derived ceramics (PDCs), are further boosting market growth.
Consumer preferences are shifting towards lighter and more fuel-efficient vehicles and aircraft, propelling the adoption of CMCs as a preferred material. The competitive landscape is characterized by both large established players and smaller specialized firms, fostering innovation and competition. The market is witnessing a gradual increase in the adoption of CMCs in the energy and power sector, driven by the need for more efficient and durable components in power generation systems. The global CMC market is expected to grow at a CAGR of xx% during the forecast period (2025-2033), reaching xx Million by 2033. Market penetration in key end-user industries like aerospace is expected to increase by xx% over the next decade.
Leading Markets & Segments in Ceramic Matrix Composites Industry
The Aerospace segment holds the dominant position in the CMC market, driven by the increasing demand for lightweight and high-temperature-resistant components in aircraft engines and other aerospace applications. Within product types, C/SIC Ceramic Matrix Composites currently holds the largest market share due to its superior properties for high-temperature applications. The North American region is the leading market for CMCs, driven by strong demand from the aerospace and defense industries. Key drivers in this region include:
- Robust Aerospace and Defense Industries: Significant government investment in defense and technological advancements in aircraft propulsion systems.
- Strong R&D Infrastructure: Presence of leading research institutions and companies focused on material science and engineering.
- Favorable Economic Policies: Government incentives and support for innovation within the aerospace and defense sectors.
Other regions, including Europe and Asia Pacific, are witnessing significant growth, driven by increasing investment in infrastructure, technological advancements, and rising consumer demand. The automotive segment is expected to exhibit strong growth in the coming years, driven by the increasing demand for fuel-efficient and lightweight vehicles. The energy sector is also a growing market for CMCs due to their high-temperature resistance and corrosion resistance properties.
Ceramic Matrix Composites Industry Product Developments
Recent product developments in the CMC industry have focused on improving the toughness, strength, and oxidation resistance of CMC materials. New manufacturing techniques, such as advanced chemical vapor infiltration and optimized fiber architectures, are resulting in CMC components with enhanced performance characteristics. These advancements are expanding the range of applications for CMCs, particularly in harsh environments, and enabling the use of CMCs in higher-stress applications. The development of novel CMCs with tailored properties for specific applications is another key trend, enhancing market fit and widening adoption across various sectors.
Key Drivers of Ceramic Matrix Composites Industry Growth
The CMC industry's growth is propelled by several key factors:
- Technological Advancements: Continuous improvements in manufacturing techniques and material properties are leading to CMCs with enhanced performance and cost-effectiveness.
- Increased Demand from Aerospace: The aerospace industry's demand for lighter, stronger, and heat-resistant materials drives significant growth.
- Government Initiatives: Government support for research and development in advanced materials further stimulates market growth.
Challenges in the Ceramic Matrix Composites Industry Market
The CMC industry faces several challenges:
- High Manufacturing Costs: The complex and energy-intensive nature of CMC manufacturing makes them expensive compared to alternative materials.
- Supply Chain Issues: Securing consistent and reliable supplies of high-quality raw materials can be challenging, particularly for some specialized CMC types.
- Limited Market Awareness: Raising awareness of CMCs and their benefits among potential end-users remains a crucial challenge. This necessitates targeted marketing and educational initiatives to showcase applications and their resulting benefits across varied end-user industries.
Emerging Opportunities in Ceramic Matrix Composites Industry
Significant opportunities exist for long-term growth in the CMC market. The development of next-generation CMCs with superior properties, coupled with strategic partnerships between material producers and end-users, opens up new avenues for market expansion. Emerging applications in areas such as high-temperature energy systems and advanced electronics represent significant growth potential. Furthermore, the integration of CMCs into hybrid and electric vehicle powertrains offers a key pathway for expansion.
Leading Players in the Ceramic Matrix Composites Industry Sector
- Rolls-Royce Plc
- Ube Industries Ltd
- General Electric
- COI Ceramics Inc
- Kyocera Corporation
- 3M
- Ultramet Inc
- SGL Carbon Company
- CoorsTek Inc
- Lancer Systems LP
- Starfire Systems Inc
- CeramTec
- Applied Thin Films Inc
Key Milestones in Ceramic Matrix Composites Industry Industry
- 2020: Introduction of a new C/SIC CMC by Rolls-Royce for use in next-generation aero-engines.
- 2022: Strategic partnership formed between General Electric and a leading CMC manufacturer to develop advanced CMC components for power generation.
- 2023: Successful testing of a new oxide/oxide CMC material demonstrates enhanced durability at ultra-high temperatures. (Further milestones to be added as data becomes available.)
Strategic Outlook for Ceramic Matrix Composites Industry Market
The CMC market is poised for significant growth, driven by technological advancements and increasing demand across various sectors. Strategic opportunities lie in focusing on product innovation, expanding into new applications, and building strong partnerships across the supply chain. Further investment in R&D will help to mitigate some of the cost challenges associated with CMC manufacturing. Focusing on specific niche applications where CMCs offer a clear performance advantage will also drive higher market penetration.
Ceramic Matrix Composites Industry Segmentation
-
1. Product Type
- 1.1. C/C Ceramic Matrix Composites
- 1.2. C/SIC Ceramic Matrix Composites
- 1.3. Oxide/Oxide Ceramic Matrix Composites
- 1.4. SIC/SIC Ceramic Matrix Composites
-
2. End-user Industry
- 2.1. Automotive
- 2.2. Aerospace
- 2.3. Defense
- 2.4. Energy and Power
- 2.5. Electrical and Electronics
- 2.6. Other End-user Industries
Ceramic Matrix Composites Industry Segmentation By Geography
-
1. Asia Pacific
- 1.1. China
- 1.2. India
- 1.3. Japan
- 1.4. South Korea
- 1.5. Malaysia
- 1.6. Thailand
- 1.7. Indonesia
- 1.8. Vietnam
- 1.9. Rest of Asia Pacific
-
2. North America
- 2.1. United States
- 2.2. Canada
- 2.3. Mexico
-
3. Europe
- 3.1. Germany
- 3.2. United Kingdom
- 3.3. France
- 3.4. Italy
- 3.5. Spain
- 3.6. Turkey
- 3.7. Russia
- 3.8. Nordic Countries
- 3.9. Rest of Europe
-
4. South America
- 4.1. Brazil
- 4.2. Argentina
- 4.3. Colombia
- 4.4. Rest of South America
-
5. Middle East and Africa
- 5.1. Saudi Arabia
- 5.2. Nigeria
- 5.3. Qatar
- 5.4. Egypt
- 5.5. United Arab Emirates
- 5.6. South Africa
- 5.7. Rest of Middle East and Africa
Ceramic Matrix Composites Industry Regional Market Share
Geographic Coverage of Ceramic Matrix Composites Industry
Ceramic Matrix Composites Industry REPORT HIGHLIGHTS
| Aspects | Details |
|---|---|
| Study Period | 2020-2034 |
| Base Year | 2025 |
| Estimated Year | 2026 |
| Forecast Period | 2026-2034 |
| Historical Period | 2020-2025 |
| Growth Rate | CAGR of > 10.00% from 2020-2034 |
| Segmentation |
|
Table of Contents
- 1. Introduction
- 1.1. Research Scope
- 1.2. Market Segmentation
- 1.3. Research Objective
- 1.4. Definitions and Assumptions
- 2. Executive Summary
- 2.1. Market Snapshot
- 3. Market Dynamics
- 3.1. Market Drivers
- 3.2. Market Restrains
- 3.3. Market Trends
- 3.4. Market Opportunities
- 4. Market Factor Analysis
- 4.1. Porters Five Forces
- 4.1.1. Bargaining Power of Suppliers
- 4.1.2. Bargaining Power of Buyers
- 4.1.3. Threat of New Entrants
- 4.1.4. Threat of Substitutes
- 4.1.5. Competitive Rivalry
- 4.2. PESTEL analysis
- 4.3. BCG Analysis
- 4.3.1. Stars (High Growth, High Market Share)
- 4.3.2. Cash Cows (Low Growth, High Market Share)
- 4.3.3. Question Mark (High Growth, Low Market Share)
- 4.3.4. Dogs (Low Growth, Low Market Share)
- 4.4. Ansoff Matrix Analysis
- 4.5. Supply Chain Analysis
- 4.6. Regulatory Landscape
- 4.7. Current Market Potential and Opportunity Assessment (TAM–SAM–SOM Framework)
- 4.8. MDP Analyst Note
- 4.1. Porters Five Forces
- 5. Market Analysis, Insights and Forecast 2021-2033
- 5.1. Market Analysis, Insights and Forecast - by Product Type
- 5.1.1. C/C Ceramic Matrix Composites
- 5.1.2. C/SIC Ceramic Matrix Composites
- 5.1.3. Oxide/Oxide Ceramic Matrix Composites
- 5.1.4. SIC/SIC Ceramic Matrix Composites
- 5.2. Market Analysis, Insights and Forecast - by End-user Industry
- 5.2.1. Automotive
- 5.2.2. Aerospace
- 5.2.3. Defense
- 5.2.4. Energy and Power
- 5.2.5. Electrical and Electronics
- 5.2.6. Other End-user Industries
- 5.3. Market Analysis, Insights and Forecast - by Region
- 5.3.1. Asia Pacific
- 5.3.2. North America
- 5.3.3. Europe
- 5.3.4. South America
- 5.3.5. Middle East and Africa
- 5.1. Market Analysis, Insights and Forecast - by Product Type
- 6. Global Ceramic Matrix Composites Industry Analysis, Insights and Forecast, 2021-2033
- 6.1. Market Analysis, Insights and Forecast - by Product Type
- 6.1.1. C/C Ceramic Matrix Composites
- 6.1.2. C/SIC Ceramic Matrix Composites
- 6.1.3. Oxide/Oxide Ceramic Matrix Composites
- 6.1.4. SIC/SIC Ceramic Matrix Composites
- 6.2. Market Analysis, Insights and Forecast - by End-user Industry
- 6.2.1. Automotive
- 6.2.2. Aerospace
- 6.2.3. Defense
- 6.2.4. Energy and Power
- 6.2.5. Electrical and Electronics
- 6.2.6. Other End-user Industries
- 6.1. Market Analysis, Insights and Forecast - by Product Type
- 7. Asia Pacific Ceramic Matrix Composites Industry Analysis, Insights and Forecast, 2020-2032
- 7.1. Market Analysis, Insights and Forecast - by Product Type
- 7.1.1. C/C Ceramic Matrix Composites
- 7.1.2. C/SIC Ceramic Matrix Composites
- 7.1.3. Oxide/Oxide Ceramic Matrix Composites
- 7.1.4. SIC/SIC Ceramic Matrix Composites
- 7.2. Market Analysis, Insights and Forecast - by End-user Industry
- 7.2.1. Automotive
- 7.2.2. Aerospace
- 7.2.3. Defense
- 7.2.4. Energy and Power
- 7.2.5. Electrical and Electronics
- 7.2.6. Other End-user Industries
- 7.1. Market Analysis, Insights and Forecast - by Product Type
- 8. North America Ceramic Matrix Composites Industry Analysis, Insights and Forecast, 2020-2032
- 8.1. Market Analysis, Insights and Forecast - by Product Type
- 8.1.1. C/C Ceramic Matrix Composites
- 8.1.2. C/SIC Ceramic Matrix Composites
- 8.1.3. Oxide/Oxide Ceramic Matrix Composites
- 8.1.4. SIC/SIC Ceramic Matrix Composites
- 8.2. Market Analysis, Insights and Forecast - by End-user Industry
- 8.2.1. Automotive
- 8.2.2. Aerospace
- 8.2.3. Defense
- 8.2.4. Energy and Power
- 8.2.5. Electrical and Electronics
- 8.2.6. Other End-user Industries
- 8.1. Market Analysis, Insights and Forecast - by Product Type
- 9. Europe Ceramic Matrix Composites Industry Analysis, Insights and Forecast, 2020-2032
- 9.1. Market Analysis, Insights and Forecast - by Product Type
- 9.1.1. C/C Ceramic Matrix Composites
- 9.1.2. C/SIC Ceramic Matrix Composites
- 9.1.3. Oxide/Oxide Ceramic Matrix Composites
- 9.1.4. SIC/SIC Ceramic Matrix Composites
- 9.2. Market Analysis, Insights and Forecast - by End-user Industry
- 9.2.1. Automotive
- 9.2.2. Aerospace
- 9.2.3. Defense
- 9.2.4. Energy and Power
- 9.2.5. Electrical and Electronics
- 9.2.6. Other End-user Industries
- 9.1. Market Analysis, Insights and Forecast - by Product Type
- 10. South America Ceramic Matrix Composites Industry Analysis, Insights and Forecast, 2020-2032
- 10.1. Market Analysis, Insights and Forecast - by Product Type
- 10.1.1. C/C Ceramic Matrix Composites
- 10.1.2. C/SIC Ceramic Matrix Composites
- 10.1.3. Oxide/Oxide Ceramic Matrix Composites
- 10.1.4. SIC/SIC Ceramic Matrix Composites
- 10.2. Market Analysis, Insights and Forecast - by End-user Industry
- 10.2.1. Automotive
- 10.2.2. Aerospace
- 10.2.3. Defense
- 10.2.4. Energy and Power
- 10.2.5. Electrical and Electronics
- 10.2.6. Other End-user Industries
- 10.1. Market Analysis, Insights and Forecast - by Product Type
- 11. Middle East and Africa Ceramic Matrix Composites Industry Analysis, Insights and Forecast, 2020-2032
- 11.1. Market Analysis, Insights and Forecast - by Product Type
- 11.1.1. C/C Ceramic Matrix Composites
- 11.1.2. C/SIC Ceramic Matrix Composites
- 11.1.3. Oxide/Oxide Ceramic Matrix Composites
- 11.1.4. SIC/SIC Ceramic Matrix Composites
- 11.2. Market Analysis, Insights and Forecast - by End-user Industry
- 11.2.1. Automotive
- 11.2.2. Aerospace
- 11.2.3. Defense
- 11.2.4. Energy and Power
- 11.2.5. Electrical and Electronics
- 11.2.6. Other End-user Industries
- 11.1. Market Analysis, Insights and Forecast - by Product Type
- 12. Competitive Analysis
- 12.1. Company Profiles
- 12.1.1 Rolls-Royce Plc
- 12.1.1.1. Company Overview
- 12.1.1.2. Products
- 12.1.1.3. Company Financials
- 12.1.1.4. SWOT Analysis
- 12.1.2 Ube Industries Ltd
- 12.1.2.1. Company Overview
- 12.1.2.2. Products
- 12.1.2.3. Company Financials
- 12.1.2.4. SWOT Analysis
- 12.1.3 General Electric
- 12.1.3.1. Company Overview
- 12.1.3.2. Products
- 12.1.3.3. Company Financials
- 12.1.3.4. SWOT Analysis
- 12.1.4 COI Ceramics Inc
- 12.1.4.1. Company Overview
- 12.1.4.2. Products
- 12.1.4.3. Company Financials
- 12.1.4.4. SWOT Analysis
- 12.1.5 Kyocera Corporation
- 12.1.5.1. Company Overview
- 12.1.5.2. Products
- 12.1.5.3. Company Financials
- 12.1.5.4. SWOT Analysis
- 12.1.6 3M
- 12.1.6.1. Company Overview
- 12.1.6.2. Products
- 12.1.6.3. Company Financials
- 12.1.6.4. SWOT Analysis
- 12.1.7 Ultramet Inc *List Not Exhaustive
- 12.1.7.1. Company Overview
- 12.1.7.2. Products
- 12.1.7.3. Company Financials
- 12.1.7.4. SWOT Analysis
- 12.1.8 SGL Carbon Company
- 12.1.8.1. Company Overview
- 12.1.8.2. Products
- 12.1.8.3. Company Financials
- 12.1.8.4. SWOT Analysis
- 12.1.9 CoorsTek Inc
- 12.1.9.1. Company Overview
- 12.1.9.2. Products
- 12.1.9.3. Company Financials
- 12.1.9.4. SWOT Analysis
- 12.1.10 Lancer Systems LP
- 12.1.10.1. Company Overview
- 12.1.10.2. Products
- 12.1.10.3. Company Financials
- 12.1.10.4. SWOT Analysis
- 12.1.11 Starfire Systems Inc
- 12.1.11.1. Company Overview
- 12.1.11.2. Products
- 12.1.11.3. Company Financials
- 12.1.11.4. SWOT Analysis
- 12.1.12 CeramTec
- 12.1.12.1. Company Overview
- 12.1.12.2. Products
- 12.1.12.3. Company Financials
- 12.1.12.4. SWOT Analysis
- 12.1.13 Applied Thin Films Inc
- 12.1.13.1. Company Overview
- 12.1.13.2. Products
- 12.1.13.3. Company Financials
- 12.1.13.4. SWOT Analysis
- 12.1.1 Rolls-Royce Plc
- 12.2. Market Entropy
- 12.2.1 Company's Key Areas Served
- 12.2.2 Recent Developments
- 12.3. Company Market Share Analysis 2025
- 12.3.1 Top 5 Companies Market Share Analysis
- 12.3.2 Top 3 Companies Market Share Analysis
- 12.4. List of Potential Customers
- 13. Research Methodology
List of Figures
- Figure 1: Global Ceramic Matrix Composites Industry Revenue Breakdown (Million, %) by Region 2025 & 2033
- Figure 2: Asia Pacific Ceramic Matrix Composites Industry Revenue (Million), by Product Type 2025 & 2033
- Figure 3: Asia Pacific Ceramic Matrix Composites Industry Revenue Share (%), by Product Type 2025 & 2033
- Figure 4: Asia Pacific Ceramic Matrix Composites Industry Revenue (Million), by End-user Industry 2025 & 2033
- Figure 5: Asia Pacific Ceramic Matrix Composites Industry Revenue Share (%), by End-user Industry 2025 & 2033
- Figure 6: Asia Pacific Ceramic Matrix Composites Industry Revenue (Million), by Country 2025 & 2033
- Figure 7: Asia Pacific Ceramic Matrix Composites Industry Revenue Share (%), by Country 2025 & 2033
- Figure 8: North America Ceramic Matrix Composites Industry Revenue (Million), by Product Type 2025 & 2033
- Figure 9: North America Ceramic Matrix Composites Industry Revenue Share (%), by Product Type 2025 & 2033
- Figure 10: North America Ceramic Matrix Composites Industry Revenue (Million), by End-user Industry 2025 & 2033
- Figure 11: North America Ceramic Matrix Composites Industry Revenue Share (%), by End-user Industry 2025 & 2033
- Figure 12: North America Ceramic Matrix Composites Industry Revenue (Million), by Country 2025 & 2033
- Figure 13: North America Ceramic Matrix Composites Industry Revenue Share (%), by Country 2025 & 2033
- Figure 14: Europe Ceramic Matrix Composites Industry Revenue (Million), by Product Type 2025 & 2033
- Figure 15: Europe Ceramic Matrix Composites Industry Revenue Share (%), by Product Type 2025 & 2033
- Figure 16: Europe Ceramic Matrix Composites Industry Revenue (Million), by End-user Industry 2025 & 2033
- Figure 17: Europe Ceramic Matrix Composites Industry Revenue Share (%), by End-user Industry 2025 & 2033
- Figure 18: Europe Ceramic Matrix Composites Industry Revenue (Million), by Country 2025 & 2033
- Figure 19: Europe Ceramic Matrix Composites Industry Revenue Share (%), by Country 2025 & 2033
- Figure 20: South America Ceramic Matrix Composites Industry Revenue (Million), by Product Type 2025 & 2033
- Figure 21: South America Ceramic Matrix Composites Industry Revenue Share (%), by Product Type 2025 & 2033
- Figure 22: South America Ceramic Matrix Composites Industry Revenue (Million), by End-user Industry 2025 & 2033
- Figure 23: South America Ceramic Matrix Composites Industry Revenue Share (%), by End-user Industry 2025 & 2033
- Figure 24: South America Ceramic Matrix Composites Industry Revenue (Million), by Country 2025 & 2033
- Figure 25: South America Ceramic Matrix Composites Industry Revenue Share (%), by Country 2025 & 2033
- Figure 26: Middle East and Africa Ceramic Matrix Composites Industry Revenue (Million), by Product Type 2025 & 2033
- Figure 27: Middle East and Africa Ceramic Matrix Composites Industry Revenue Share (%), by Product Type 2025 & 2033
- Figure 28: Middle East and Africa Ceramic Matrix Composites Industry Revenue (Million), by End-user Industry 2025 & 2033
- Figure 29: Middle East and Africa Ceramic Matrix Composites Industry Revenue Share (%), by End-user Industry 2025 & 2033
- Figure 30: Middle East and Africa Ceramic Matrix Composites Industry Revenue (Million), by Country 2025 & 2033
- Figure 31: Middle East and Africa Ceramic Matrix Composites Industry Revenue Share (%), by Country 2025 & 2033
List of Tables
- Table 1: Global Ceramic Matrix Composites Industry Revenue Million Forecast, by Product Type 2020 & 2033
- Table 2: Global Ceramic Matrix Composites Industry Revenue Million Forecast, by End-user Industry 2020 & 2033
- Table 3: Global Ceramic Matrix Composites Industry Revenue Million Forecast, by Region 2020 & 2033
- Table 4: Global Ceramic Matrix Composites Industry Revenue Million Forecast, by Product Type 2020 & 2033
- Table 5: Global Ceramic Matrix Composites Industry Revenue Million Forecast, by End-user Industry 2020 & 2033
- Table 6: Global Ceramic Matrix Composites Industry Revenue Million Forecast, by Country 2020 & 2033
- Table 7: China Ceramic Matrix Composites Industry Revenue (Million) Forecast, by Application 2020 & 2033
- Table 8: India Ceramic Matrix Composites Industry Revenue (Million) Forecast, by Application 2020 & 2033
- Table 9: Japan Ceramic Matrix Composites Industry Revenue (Million) Forecast, by Application 2020 & 2033
- Table 10: South Korea Ceramic Matrix Composites Industry Revenue (Million) Forecast, by Application 2020 & 2033
- Table 11: Malaysia Ceramic Matrix Composites Industry Revenue (Million) Forecast, by Application 2020 & 2033
- Table 12: Thailand Ceramic Matrix Composites Industry Revenue (Million) Forecast, by Application 2020 & 2033
- Table 13: Indonesia Ceramic Matrix Composites Industry Revenue (Million) Forecast, by Application 2020 & 2033
- Table 14: Vietnam Ceramic Matrix Composites Industry Revenue (Million) Forecast, by Application 2020 & 2033
- Table 15: Rest of Asia Pacific Ceramic Matrix Composites Industry Revenue (Million) Forecast, by Application 2020 & 2033
- Table 16: Global Ceramic Matrix Composites Industry Revenue Million Forecast, by Product Type 2020 & 2033
- Table 17: Global Ceramic Matrix Composites Industry Revenue Million Forecast, by End-user Industry 2020 & 2033
- Table 18: Global Ceramic Matrix Composites Industry Revenue Million Forecast, by Country 2020 & 2033
- Table 19: United States Ceramic Matrix Composites Industry Revenue (Million) Forecast, by Application 2020 & 2033
- Table 20: Canada Ceramic Matrix Composites Industry Revenue (Million) Forecast, by Application 2020 & 2033
- Table 21: Mexico Ceramic Matrix Composites Industry Revenue (Million) Forecast, by Application 2020 & 2033
- Table 22: Global Ceramic Matrix Composites Industry Revenue Million Forecast, by Product Type 2020 & 2033
- Table 23: Global Ceramic Matrix Composites Industry Revenue Million Forecast, by End-user Industry 2020 & 2033
- Table 24: Global Ceramic Matrix Composites Industry Revenue Million Forecast, by Country 2020 & 2033
- Table 25: Germany Ceramic Matrix Composites Industry Revenue (Million) Forecast, by Application 2020 & 2033
- Table 26: United Kingdom Ceramic Matrix Composites Industry Revenue (Million) Forecast, by Application 2020 & 2033
- Table 27: France Ceramic Matrix Composites Industry Revenue (Million) Forecast, by Application 2020 & 2033
- Table 28: Italy Ceramic Matrix Composites Industry Revenue (Million) Forecast, by Application 2020 & 2033
- Table 29: Spain Ceramic Matrix Composites Industry Revenue (Million) Forecast, by Application 2020 & 2033
- Table 30: Turkey Ceramic Matrix Composites Industry Revenue (Million) Forecast, by Application 2020 & 2033
- Table 31: Russia Ceramic Matrix Composites Industry Revenue (Million) Forecast, by Application 2020 & 2033
- Table 32: Nordic Countries Ceramic Matrix Composites Industry Revenue (Million) Forecast, by Application 2020 & 2033
- Table 33: Rest of Europe Ceramic Matrix Composites Industry Revenue (Million) Forecast, by Application 2020 & 2033
- Table 34: Global Ceramic Matrix Composites Industry Revenue Million Forecast, by Product Type 2020 & 2033
- Table 35: Global Ceramic Matrix Composites Industry Revenue Million Forecast, by End-user Industry 2020 & 2033
- Table 36: Global Ceramic Matrix Composites Industry Revenue Million Forecast, by Country 2020 & 2033
- Table 37: Brazil Ceramic Matrix Composites Industry Revenue (Million) Forecast, by Application 2020 & 2033
- Table 38: Argentina Ceramic Matrix Composites Industry Revenue (Million) Forecast, by Application 2020 & 2033
- Table 39: Colombia Ceramic Matrix Composites Industry Revenue (Million) Forecast, by Application 2020 & 2033
- Table 40: Rest of South America Ceramic Matrix Composites Industry Revenue (Million) Forecast, by Application 2020 & 2033
- Table 41: Global Ceramic Matrix Composites Industry Revenue Million Forecast, by Product Type 2020 & 2033
- Table 42: Global Ceramic Matrix Composites Industry Revenue Million Forecast, by End-user Industry 2020 & 2033
- Table 43: Global Ceramic Matrix Composites Industry Revenue Million Forecast, by Country 2020 & 2033
- Table 44: Saudi Arabia Ceramic Matrix Composites Industry Revenue (Million) Forecast, by Application 2020 & 2033
- Table 45: Nigeria Ceramic Matrix Composites Industry Revenue (Million) Forecast, by Application 2020 & 2033
- Table 46: Qatar Ceramic Matrix Composites Industry Revenue (Million) Forecast, by Application 2020 & 2033
- Table 47: Egypt Ceramic Matrix Composites Industry Revenue (Million) Forecast, by Application 2020 & 2033
- Table 48: United Arab Emirates Ceramic Matrix Composites Industry Revenue (Million) Forecast, by Application 2020 & 2033
- Table 49: South Africa Ceramic Matrix Composites Industry Revenue (Million) Forecast, by Application 2020 & 2033
- Table 50: Rest of Middle East and Africa Ceramic Matrix Composites Industry Revenue (Million) Forecast, by Application 2020 & 2033
Frequently Asked Questions
1. What is the projected Compound Annual Growth Rate (CAGR) of the Ceramic Matrix Composites Industry?
The projected CAGR is approximately > 10.00%.
2. Which companies are prominent players in the Ceramic Matrix Composites Industry?
Key companies in the market include Rolls-Royce Plc, Ube Industries Ltd, General Electric, COI Ceramics Inc, Kyocera Corporation, 3M, Ultramet Inc *List Not Exhaustive, SGL Carbon Company, CoorsTek Inc, Lancer Systems LP, Starfire Systems Inc, CeramTec, Applied Thin Films Inc.
3. What are the main segments of the Ceramic Matrix Composites Industry?
The market segments include Product Type, End-user Industry.
4. Can you provide details about the market size?
The market size is estimated to be USD XX Million as of 2022.
5. What are some drivers contributing to market growth?
; Increasing Application of Ceramic Matrix Composites in Defense Sector; Exceptional Performance Properties at Very High Temperatures.
6. What are the notable trends driving market growth?
SIC/SIC Ceramic Matrix Composites to Drive the Market Growth.
7. Are there any restraints impacting market growth?
; Higher Cost of Production as Compared to Other Metals & Alloys; Impact of COVID-19 on the Market Studied.
8. Can you provide examples of recent developments in the market?
N/A
9. What pricing options are available for accessing the report?
Pricing options include single-user, multi-user, and enterprise licenses priced at USD 4750, USD 5250, and USD 8750 respectively.
10. Is the market size provided in terms of value or volume?
The market size is provided in terms of value, measured in Million.
11. Are there any specific market keywords associated with the report?
Yes, the market keyword associated with the report is "Ceramic Matrix Composites Industry," which aids in identifying and referencing the specific market segment covered.
12. How do I determine which pricing option suits my needs best?
The pricing options vary based on user requirements and access needs. Individual users may opt for single-user licenses, while businesses requiring broader access may choose multi-user or enterprise licenses for cost-effective access to the report.
13. Are there any additional resources or data provided in the Ceramic Matrix Composites Industry report?
While the report offers comprehensive insights, it's advisable to review the specific contents or supplementary materials provided to ascertain if additional resources or data are available.
14. How can I stay updated on further developments or reports in the Ceramic Matrix Composites Industry?
To stay informed about further developments, trends, and reports in the Ceramic Matrix Composites Industry, consider subscribing to industry newsletters, following relevant companies and organizations, or regularly checking reputable industry news sources and publications.
Methodology
Step 1 - Identification of Relevant Samples Size from Population Database


Step 2 - Approaches for Defining Global Market Size (Value, Volume* & Price*)

Note*: In applicable scenarios
Step 3 - Data Sources
Primary Research
- Web Analytics
- Survey Reports
- Research Institute
- Latest Research Reports
- Opinion Leaders
Secondary Research
- Annual Reports
- White Paper
- Latest Press Release
- Industry Association
- Paid Database
- Investor Presentations

Step 4 - Data Triangulation
Involves using different sources of information in order to increase the validity of a study
These sources are likely to be stakeholders in a program - participants, other researchers, program staff, other community members, and so on.
Then we put all data in single framework & apply various statistical tools to find out the dynamic on the market.
During the analysis stage, feedback from the stakeholder groups would be compared to determine areas of agreement as well as areas of divergence