

Key Insights
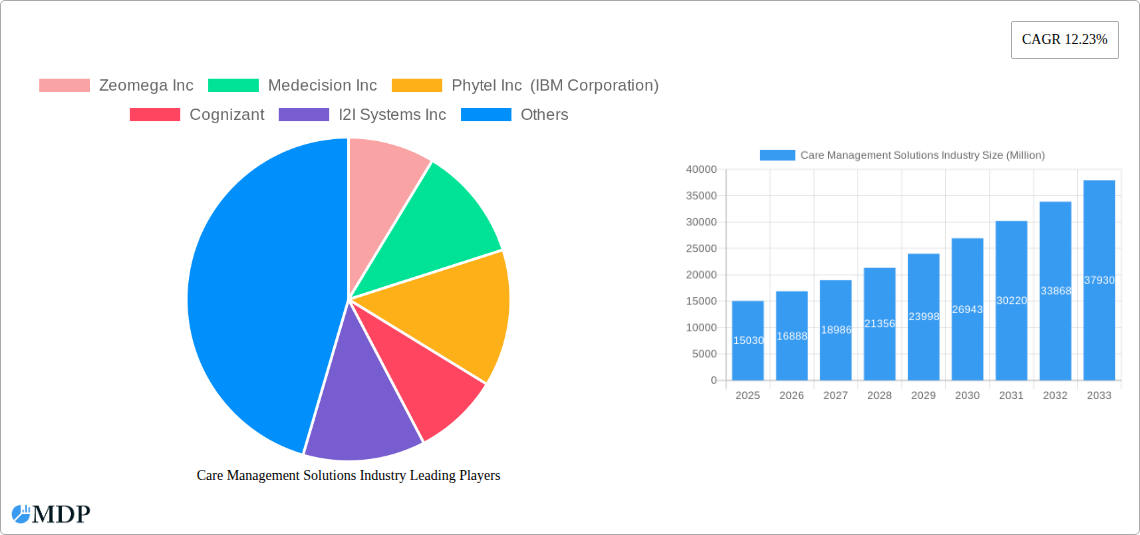
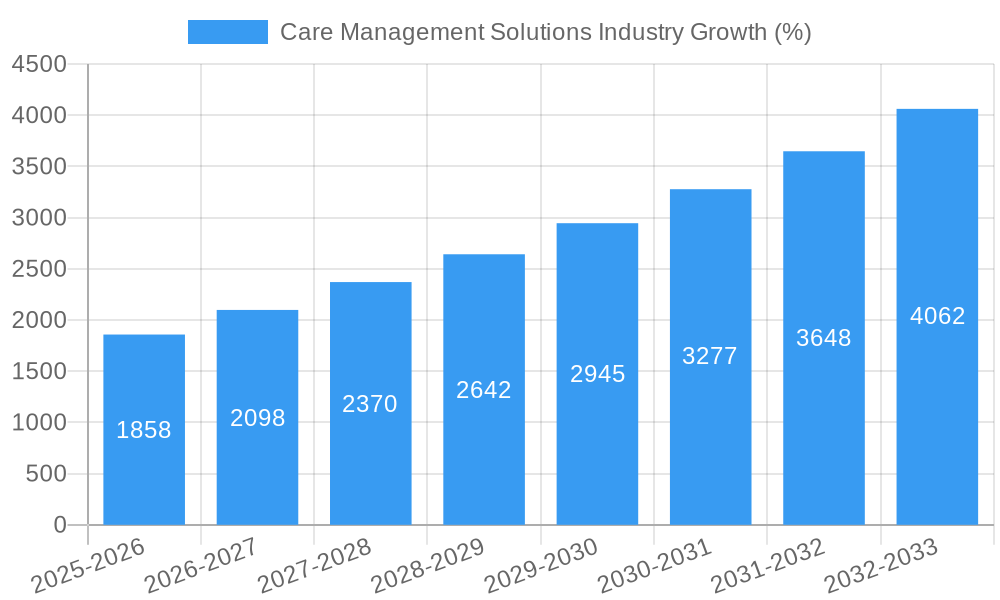
The Care Management Solutions market, valued at $15.03 billion in 2025, is projected to experience robust growth, driven by a compound annual growth rate (CAGR) of 12.23% from 2025 to 2033. This expansion is fueled by several key factors. The increasing prevalence of chronic diseases, coupled with the rising demand for efficient and cost-effective healthcare delivery, is significantly boosting the adoption of care management solutions across various healthcare settings. Furthermore, the growing emphasis on value-based care models, which incentivize better patient outcomes and reduced healthcare expenditures, is creating a favorable environment for market growth. Technological advancements, such as the proliferation of cloud-based and web-based solutions, are enhancing accessibility, scalability, and affordability, further driving market penetration. The integration of advanced analytics and artificial intelligence (AI) is improving care coordination, predictive modeling, and personalized treatment plans, leading to better patient engagement and outcomes. The market's segmentation by application (chronic care, disease management, utilization management), end-user (payers, providers), component (software, services), and delivery mode (cloud, on-premise) reflects the diverse needs and preferences within the healthcare ecosystem. Competition among established players like IBM, Cognizant, and Optum, as well as emerging technology providers, ensures innovation and continuous market evolution.
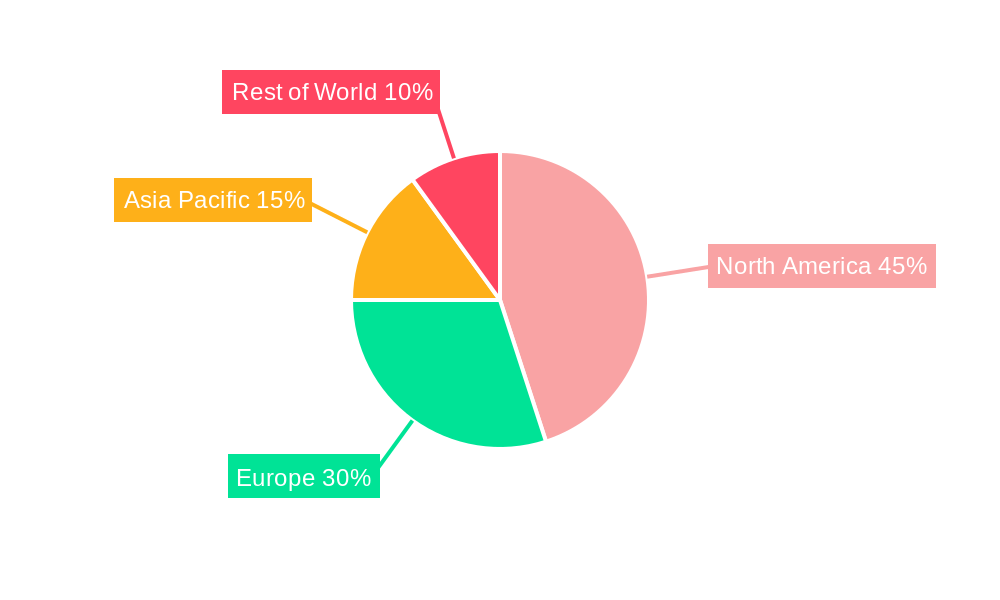
Significant regional variations are expected. North America, with its advanced healthcare infrastructure and early adoption of technology, is likely to remain a dominant market. However, the Asia-Pacific region, particularly India and China, is anticipated to witness substantial growth due to rising healthcare expenditure, expanding healthcare infrastructure, and increasing prevalence of chronic diseases. Europe will also exhibit consistent growth, driven by government initiatives supporting digital healthcare and improving healthcare efficiency. The market's future trajectory is highly promising, with continued innovation in areas such as remote patient monitoring, telehealth integration, and predictive analytics poised to further expand the market’s potential and improve overall healthcare quality. The presence of numerous established and emerging players suggests a competitive landscape, potentially leading to further innovation and value-added services for consumers.
Care Management Solutions Market Report: 2019-2033 Forecast
Unlocking Growth in the Multi-Billion Dollar Care Management Solutions Market: A Comprehensive Analysis
This comprehensive report provides an in-depth analysis of the global Care Management Solutions market, offering invaluable insights for stakeholders across the healthcare ecosystem. With a detailed study period spanning 2019-2033 (Base Year: 2025, Forecast Period: 2025-2033), this report meticulously examines market dynamics, leading players, emerging trends, and future growth opportunities. The market is projected to reach xx Million by 2033, showcasing substantial growth potential. This report is essential for investors, healthcare providers, technology developers, and regulatory bodies seeking to navigate this rapidly evolving landscape.
Care Management Solutions Industry Market Dynamics & Concentration
The Care Management Solutions market is experiencing robust growth fueled by an aging global population, rising prevalence of chronic diseases, and increasing demand for cost-effective healthcare delivery. Market concentration is moderate, with several major players holding significant market share, but also with room for smaller, niche players to thrive. Innovation is a key driver, with companies continually developing advanced technologies like AI and machine learning to enhance care management capabilities. Stringent regulatory frameworks, particularly regarding data privacy and security (HIPAA, GDPR), significantly impact market operations. The emergence of telehealth and remote patient monitoring solutions poses both opportunities and challenges as substitutes for traditional in-person care. Healthcare provider adoption rates are a crucial factor influencing market growth, while mergers and acquisitions (M&A) activity is further shaping the competitive landscape. In the historical period (2019-2024), approximately xx M&A deals were recorded, consolidating market share among key players. The estimated market share of the top 5 players in 2025 is xx%.
- Key Market Dynamics: Aging population, chronic disease prevalence, telehealth adoption, regulatory landscape, technological advancements, M&A activity.
- Competitive Landscape: Moderate concentration, with top players holding significant but not dominant shares.
- Innovation Drivers: AI/ML integration, remote patient monitoring, personalized care management platforms.
Care Management Solutions Industry Industry Trends & Analysis
The Care Management Solutions market is characterized by a Compound Annual Growth Rate (CAGR) of xx% during the forecast period (2025-2033). This growth is primarily driven by increasing healthcare costs, payer demands for improved care coordination, and the rising adoption of value-based care models. Technological disruptions, such as the integration of artificial intelligence (AI) and machine learning (ML) for predictive analytics and personalized interventions, are transforming the industry. Consumer preference for convenient, accessible, and personalized care experiences is also shaping market demand. Competitive dynamics are marked by strategic partnerships, product innovations, and a focus on improving data interoperability. Market penetration is expected to increase significantly, particularly in regions with underdeveloped healthcare infrastructure. The growing adoption of cloud-based solutions is also a significant trend, driving scalability and cost-efficiency.
Leading Markets & Segments in Care Management Solutions Industry
The North American market currently holds the largest share of the global Care Management Solutions market, driven by robust healthcare infrastructure, advanced technological adoption, and favorable regulatory environments. However, strong growth is projected in the Asia-Pacific region due to rising healthcare expenditure and increasing awareness of chronic disease management.
By Application:
- Chronic Care Management: Dominates the market due to the increasing prevalence of chronic conditions and the demand for effective long-term care solutions. Drivers include rising geriatric population, increased chronic disease awareness, and government initiatives focused on preventive care.
- Disease Management: Strong growth due to the efficacy of specialized disease management programs in improving patient outcomes and reducing healthcare costs.
- Utilization Management: Significant growth potential as healthcare payers look to optimize resource allocation and reduce unnecessary healthcare expenditures.
By End User:
- Healthcare Payers: Represent a major market segment, driven by their focus on cost containment and improved quality of care. Drivers include value-based care reimbursement models and the pressure to improve care coordination efficiency.
- Healthcare Providers: Significant growth is expected, as providers seek to enhance patient engagement and improve operational efficiency.
- Other End Users: This segment includes government agencies, employers, and other stakeholders that play a crucial role in facilitating access to care.
By Component:
- Software: Largest segment, driven by the growing demand for advanced care management platforms with features like analytics dashboards and remote monitoring capabilities.
- Services: Significant market share due to the need for professional implementation, integration, and ongoing support services.
By Delivery Mode:
- Cloud-based and Web-based: Dominates due to scalability, accessibility, and cost-effectiveness.
- On-premise: A smaller but still significant segment, favored by organizations with high security requirements or concerns about data privacy.
Care Management Solutions Industry Product Developments
Recent product innovations focus on integrating advanced technologies like AI, ML, and IoT to deliver personalized, proactive, and data-driven care. New solutions emphasize seamless data integration across disparate healthcare systems, improving care coordination and reducing administrative burden. The market is witnessing the emergence of user-friendly mobile applications and wearables that empower patients to actively participate in their care management. These innovations offer significant competitive advantages by enhancing patient engagement, improving outcomes, and reducing healthcare costs.
Key Drivers of Care Management Solutions Industry Growth
The Care Management Solutions market is driven by several key factors. The escalating prevalence of chronic diseases necessitates effective management strategies, boosting demand for these solutions. Government initiatives supporting value-based care models further incentivize their adoption. Technological advancements, particularly in areas like AI and remote monitoring, are improving care quality and efficiency. Furthermore, rising healthcare costs are prompting payers and providers to seek cost-effective solutions.
Challenges in the Care Management Solutions Industry Market
Despite strong growth prospects, the market faces challenges. Interoperability issues between different healthcare systems can hinder data sharing and integrated care. Data privacy and security concerns are paramount, requiring robust compliance with regulations such as HIPAA and GDPR. The high cost of implementation and maintenance can be a barrier for smaller healthcare providers. Competition among established players and emerging startups further intensifies market dynamics. A significant challenge is achieving widespread adoption across diverse healthcare settings and populations.
Emerging Opportunities in Care Management Solutions Industry
The long-term growth of the Care Management Solutions market is driven by several factors. Technological breakthroughs in AI and predictive analytics enable proactive interventions, improving patient outcomes. Strategic partnerships between technology companies, healthcare providers, and payers create innovative care delivery models. Market expansion into underserved regions globally offers vast growth potential. The integration of virtual care and wearable technologies further enhances accessibility and personalization.
Leading Players in the Care Management Solutions Industry Sector
- Zeomega Inc
- Medecision Inc
- Phytel Inc (IBM Corporation)
- Cognizant
- I2I Systems Inc
- Centene Corporation (Evolve)
- Veradigm
- Infomc
- Infosys Limited
- Convey Health Solutions
- Optum Inc
- EPIC Corporation Inc
- Exl Healthcare
- Hinduja Global Solutions Limited
Key Milestones in Care Management Solutions Industry Industry
- April 2023: Medecision launched Aerial Social Care Coordinator, addressing social determinants of health. This highlights the growing importance of addressing social factors influencing patient outcomes.
- March 2023: Royal Philips launched Philips Virtual Care Management, expanding remote patient monitoring capabilities and contributing to reduced hospital readmissions. This signifies the increasing adoption of virtual care solutions for efficient and cost-effective management of chronic conditions.
Strategic Outlook for Care Management Solutions Industry Market
The Care Management Solutions market presents significant growth opportunities over the next decade. Continued technological advancements, coupled with increasing healthcare expenditure and the adoption of value-based care, will fuel market expansion. Strategic partnerships and acquisitions will play a vital role in shaping the competitive landscape and driving innovation. Companies that can effectively leverage data analytics, personalize care delivery, and address social determinants of health will be well-positioned to capture a larger market share. The long-term outlook for this market remains exceptionally positive.
Care Management Solutions Industry Segmentation
-
1. Component
- 1.1. Software
- 1.2. Services
-
2. Delivery Mode
- 2.1. Cloud-based and Web-based
- 2.2. On-premise
-
3. Application
- 3.1. Chronic Care Management
- 3.2. Disease Management
- 3.3. Utilization Management
-
4. End User
- 4.1. Healthcare Payers
- 4.2. Healthcare Providers
- 4.3. Other End Users
Care Management Solutions Industry Segmentation By Geography
-
1. North America
- 1.1. United States
- 1.2. Canada
- 1.3. Mexico
-
2. Europe
- 2.1. Germany
- 2.2. United Kindom
- 2.3. France
- 2.4. Italy
- 2.5. Spain
- 2.6. Rest of Europe
-
3. Asia Pacific
- 3.1. China
- 3.2. Japan
- 3.3. India
- 3.4. Australia
- 3.5. South Korea
- 3.6. Rest of Asia Pacific
- 4. Middle East
-
5. GCC
- 5.1. South Africa
- 5.2. Rest of Middle East and Africa
-
6. South America
- 6.1. Brazil
- 6.2. Argentina
- 6.3. Rest of South America
Care Management Solutions Industry REPORT HIGHLIGHTS
| Aspects | Details |
|---|---|
| Study Period | 2019-2033 |
| Base Year | 2024 |
| Estimated Year | 2025 |
| Forecast Period | 2025-2033 |
| Historical Period | 2019-2024 |
| Growth Rate | CAGR of 12.23% from 2019-2033 |
| Segmentation |
|
Table of Contents
- 1. Introduction
- 1.1. Research Scope
- 1.2. Market Segmentation
- 1.3. Research Methodology
- 1.4. Definitions and Assumptions
- 2. Executive Summary
- 2.1. Introduction
- 3. Market Dynamics
- 3.1. Introduction
- 3.2. Market Drivers
- 3.2.1. Rising Geriatric Population and Burden of Chronic Diseases; Care Management Solutions Offer a Means to Reduce Healthcare Costs; Government Initiatives on Healthcare Services and Infrastructure
- 3.3. Market Restrains
- 3.3.1. High Investments Required for Supporting Infrastructure; Data Security Concerns Related to Cloud-based Solutions
- 3.4. Market Trends
- 3.4.1. Chronic Care Management Segment Expected to Hold a Significant Share in the Care Management Solutions Market
- 4. Market Factor Analysis
- 4.1. Porters Five Forces
- 4.2. Supply/Value Chain
- 4.3. PESTEL analysis
- 4.4. Market Entropy
- 4.5. Patent/Trademark Analysis
- 5. Global Care Management Solutions Industry Analysis, Insights and Forecast, 2019-2031
- 5.1. Market Analysis, Insights and Forecast - by Component
- 5.1.1. Software
- 5.1.2. Services
- 5.2. Market Analysis, Insights and Forecast - by Delivery Mode
- 5.2.1. Cloud-based and Web-based
- 5.2.2. On-premise
- 5.3. Market Analysis, Insights and Forecast - by Application
- 5.3.1. Chronic Care Management
- 5.3.2. Disease Management
- 5.3.3. Utilization Management
- 5.4. Market Analysis, Insights and Forecast - by End User
- 5.4.1. Healthcare Payers
- 5.4.2. Healthcare Providers
- 5.4.3. Other End Users
- 5.5. Market Analysis, Insights and Forecast - by Region
- 5.5.1. North America
- 5.5.2. Europe
- 5.5.3. Asia Pacific
- 5.5.4. Middle East
- 5.5.5. GCC
- 5.5.6. South America
- 5.1. Market Analysis, Insights and Forecast - by Component
- 6. North America Care Management Solutions Industry Analysis, Insights and Forecast, 2019-2031
- 6.1. Market Analysis, Insights and Forecast - by Component
- 6.1.1. Software
- 6.1.2. Services
- 6.2. Market Analysis, Insights and Forecast - by Delivery Mode
- 6.2.1. Cloud-based and Web-based
- 6.2.2. On-premise
- 6.3. Market Analysis, Insights and Forecast - by Application
- 6.3.1. Chronic Care Management
- 6.3.2. Disease Management
- 6.3.3. Utilization Management
- 6.4. Market Analysis, Insights and Forecast - by End User
- 6.4.1. Healthcare Payers
- 6.4.2. Healthcare Providers
- 6.4.3. Other End Users
- 6.1. Market Analysis, Insights and Forecast - by Component
- 7. Europe Care Management Solutions Industry Analysis, Insights and Forecast, 2019-2031
- 7.1. Market Analysis, Insights and Forecast - by Component
- 7.1.1. Software
- 7.1.2. Services
- 7.2. Market Analysis, Insights and Forecast - by Delivery Mode
- 7.2.1. Cloud-based and Web-based
- 7.2.2. On-premise
- 7.3. Market Analysis, Insights and Forecast - by Application
- 7.3.1. Chronic Care Management
- 7.3.2. Disease Management
- 7.3.3. Utilization Management
- 7.4. Market Analysis, Insights and Forecast - by End User
- 7.4.1. Healthcare Payers
- 7.4.2. Healthcare Providers
- 7.4.3. Other End Users
- 7.1. Market Analysis, Insights and Forecast - by Component
- 8. Asia Pacific Care Management Solutions Industry Analysis, Insights and Forecast, 2019-2031
- 8.1. Market Analysis, Insights and Forecast - by Component
- 8.1.1. Software
- 8.1.2. Services
- 8.2. Market Analysis, Insights and Forecast - by Delivery Mode
- 8.2.1. Cloud-based and Web-based
- 8.2.2. On-premise
- 8.3. Market Analysis, Insights and Forecast - by Application
- 8.3.1. Chronic Care Management
- 8.3.2. Disease Management
- 8.3.3. Utilization Management
- 8.4. Market Analysis, Insights and Forecast - by End User
- 8.4.1. Healthcare Payers
- 8.4.2. Healthcare Providers
- 8.4.3. Other End Users
- 8.1. Market Analysis, Insights and Forecast - by Component
- 9. Middle East Care Management Solutions Industry Analysis, Insights and Forecast, 2019-2031
- 9.1. Market Analysis, Insights and Forecast - by Component
- 9.1.1. Software
- 9.1.2. Services
- 9.2. Market Analysis, Insights and Forecast - by Delivery Mode
- 9.2.1. Cloud-based and Web-based
- 9.2.2. On-premise
- 9.3. Market Analysis, Insights and Forecast - by Application
- 9.3.1. Chronic Care Management
- 9.3.2. Disease Management
- 9.3.3. Utilization Management
- 9.4. Market Analysis, Insights and Forecast - by End User
- 9.4.1. Healthcare Payers
- 9.4.2. Healthcare Providers
- 9.4.3. Other End Users
- 9.1. Market Analysis, Insights and Forecast - by Component
- 10. GCC Care Management Solutions Industry Analysis, Insights and Forecast, 2019-2031
- 10.1. Market Analysis, Insights and Forecast - by Component
- 10.1.1. Software
- 10.1.2. Services
- 10.2. Market Analysis, Insights and Forecast - by Delivery Mode
- 10.2.1. Cloud-based and Web-based
- 10.2.2. On-premise
- 10.3. Market Analysis, Insights and Forecast - by Application
- 10.3.1. Chronic Care Management
- 10.3.2. Disease Management
- 10.3.3. Utilization Management
- 10.4. Market Analysis, Insights and Forecast - by End User
- 10.4.1. Healthcare Payers
- 10.4.2. Healthcare Providers
- 10.4.3. Other End Users
- 10.1. Market Analysis, Insights and Forecast - by Component
- 11. South America Care Management Solutions Industry Analysis, Insights and Forecast, 2019-2031
- 11.1. Market Analysis, Insights and Forecast - by Component
- 11.1.1. Software
- 11.1.2. Services
- 11.2. Market Analysis, Insights and Forecast - by Delivery Mode
- 11.2.1. Cloud-based and Web-based
- 11.2.2. On-premise
- 11.3. Market Analysis, Insights and Forecast - by Application
- 11.3.1. Chronic Care Management
- 11.3.2. Disease Management
- 11.3.3. Utilization Management
- 11.4. Market Analysis, Insights and Forecast - by End User
- 11.4.1. Healthcare Payers
- 11.4.2. Healthcare Providers
- 11.4.3. Other End Users
- 11.1. Market Analysis, Insights and Forecast - by Component
- 12. North America Care Management Solutions Industry Analysis, Insights and Forecast, 2019-2031
- 12.1. Market Analysis, Insights and Forecast - By Country/Sub-region
- 12.1.1 United States
- 12.1.2 Canada
- 12.1.3 Mexico
- 13. Europe Care Management Solutions Industry Analysis, Insights and Forecast, 2019-2031
- 13.1. Market Analysis, Insights and Forecast - By Country/Sub-region
- 13.1.1 Germany
- 13.1.2 United Kindom
- 13.1.3 France
- 13.1.4 Italy
- 13.1.5 Spain
- 13.1.6 Rest of Europe
- 14. Asia Pacific Care Management Solutions Industry Analysis, Insights and Forecast, 2019-2031
- 14.1. Market Analysis, Insights and Forecast - By Country/Sub-region
- 14.1.1 China
- 14.1.2 Japan
- 14.1.3 India
- 14.1.4 Australia
- 14.1.5 South Korea
- 14.1.6 Rest of Asia Pacific
- 15. Middle East Care Management Solutions Industry Analysis, Insights and Forecast, 2019-2031
- 15.1. Market Analysis, Insights and Forecast - By Country/Sub-region
- 15.1.1.
- 16. GCC Care Management Solutions Industry Analysis, Insights and Forecast, 2019-2031
- 16.1. Market Analysis, Insights and Forecast - By Country/Sub-region
- 16.1.1 South Africa
- 16.1.2 Rest of Middle East and Africa
- 17. South America Care Management Solutions Industry Analysis, Insights and Forecast, 2019-2031
- 17.1. Market Analysis, Insights and Forecast - By Country/Sub-region
- 17.1.1 Brazil
- 17.1.2 Argentina
- 17.1.3 Rest of South America
- 18. Competitive Analysis
- 18.1. Global Market Share Analysis 2024
- 18.2. Company Profiles
- 18.2.1 Zeomega Inc
- 18.2.1.1. Overview
- 18.2.1.2. Products
- 18.2.1.3. SWOT Analysis
- 18.2.1.4. Recent Developments
- 18.2.1.5. Financials (Based on Availability)
- 18.2.2 Medecision Inc
- 18.2.2.1. Overview
- 18.2.2.2. Products
- 18.2.2.3. SWOT Analysis
- 18.2.2.4. Recent Developments
- 18.2.2.5. Financials (Based on Availability)
- 18.2.3 Phytel Inc (IBM Corporation)
- 18.2.3.1. Overview
- 18.2.3.2. Products
- 18.2.3.3. SWOT Analysis
- 18.2.3.4. Recent Developments
- 18.2.3.5. Financials (Based on Availability)
- 18.2.4 Cognizant
- 18.2.4.1. Overview
- 18.2.4.2. Products
- 18.2.4.3. SWOT Analysis
- 18.2.4.4. Recent Developments
- 18.2.4.5. Financials (Based on Availability)
- 18.2.5 I2I Systems Inc
- 18.2.5.1. Overview
- 18.2.5.2. Products
- 18.2.5.3. SWOT Analysis
- 18.2.5.4. Recent Developments
- 18.2.5.5. Financials (Based on Availability)
- 18.2.6 Centene Corporation (Evolve)
- 18.2.6.1. Overview
- 18.2.6.2. Products
- 18.2.6.3. SWOT Analysis
- 18.2.6.4. Recent Developments
- 18.2.6.5. Financials (Based on Availability)
- 18.2.7 Veradigm
- 18.2.7.1. Overview
- 18.2.7.2. Products
- 18.2.7.3. SWOT Analysis
- 18.2.7.4. Recent Developments
- 18.2.7.5. Financials (Based on Availability)
- 18.2.8 InfoMC
- 18.2.8.1. Overview
- 18.2.8.2. Products
- 18.2.8.3. SWOT Analysis
- 18.2.8.4. Recent Developments
- 18.2.8.5. Financials (Based on Availability)
- 18.2.9 Infosys Limited
- 18.2.9.1. Overview
- 18.2.9.2. Products
- 18.2.9.3. SWOT Analysis
- 18.2.9.4. Recent Developments
- 18.2.9.5. Financials (Based on Availability)
- 18.2.10 Convey Health Solutions
- 18.2.10.1. Overview
- 18.2.10.2. Products
- 18.2.10.3. SWOT Analysis
- 18.2.10.4. Recent Developments
- 18.2.10.5. Financials (Based on Availability)
- 18.2.11 Optum Inc
- 18.2.11.1. Overview
- 18.2.11.2. Products
- 18.2.11.3. SWOT Analysis
- 18.2.11.4. Recent Developments
- 18.2.11.5. Financials (Based on Availability)
- 18.2.12 EPIC Corporation Inc
- 18.2.12.1. Overview
- 18.2.12.2. Products
- 18.2.12.3. SWOT Analysis
- 18.2.12.4. Recent Developments
- 18.2.12.5. Financials (Based on Availability)
- 18.2.13 Exl Healthcare
- 18.2.13.1. Overview
- 18.2.13.2. Products
- 18.2.13.3. SWOT Analysis
- 18.2.13.4. Recent Developments
- 18.2.13.5. Financials (Based on Availability)
- 18.2.14 Hinduja Global Solutions Limited
- 18.2.14.1. Overview
- 18.2.14.2. Products
- 18.2.14.3. SWOT Analysis
- 18.2.14.4. Recent Developments
- 18.2.14.5. Financials (Based on Availability)
- 18.2.1 Zeomega Inc
List of Figures
- Figure 1: Global Care Management Solutions Industry Revenue Breakdown (Million, %) by Region 2024 & 2032
- Figure 2: Global Care Management Solutions Industry Volume Breakdown (K Unit, %) by Region 2024 & 2032
- Figure 3: North America Care Management Solutions Industry Revenue (Million), by Country 2024 & 2032
- Figure 4: North America Care Management Solutions Industry Volume (K Unit), by Country 2024 & 2032
- Figure 5: North America Care Management Solutions Industry Revenue Share (%), by Country 2024 & 2032
- Figure 6: North America Care Management Solutions Industry Volume Share (%), by Country 2024 & 2032
- Figure 7: Europe Care Management Solutions Industry Revenue (Million), by Country 2024 & 2032
- Figure 8: Europe Care Management Solutions Industry Volume (K Unit), by Country 2024 & 2032
- Figure 9: Europe Care Management Solutions Industry Revenue Share (%), by Country 2024 & 2032
- Figure 10: Europe Care Management Solutions Industry Volume Share (%), by Country 2024 & 2032
- Figure 11: Asia Pacific Care Management Solutions Industry Revenue (Million), by Country 2024 & 2032
- Figure 12: Asia Pacific Care Management Solutions Industry Volume (K Unit), by Country 2024 & 2032
- Figure 13: Asia Pacific Care Management Solutions Industry Revenue Share (%), by Country 2024 & 2032
- Figure 14: Asia Pacific Care Management Solutions Industry Volume Share (%), by Country 2024 & 2032
- Figure 15: Middle East Care Management Solutions Industry Revenue (Million), by Country 2024 & 2032
- Figure 16: Middle East Care Management Solutions Industry Volume (K Unit), by Country 2024 & 2032
- Figure 17: Middle East Care Management Solutions Industry Revenue Share (%), by Country 2024 & 2032
- Figure 18: Middle East Care Management Solutions Industry Volume Share (%), by Country 2024 & 2032
- Figure 19: GCC Care Management Solutions Industry Revenue (Million), by Country 2024 & 2032
- Figure 20: GCC Care Management Solutions Industry Volume (K Unit), by Country 2024 & 2032
- Figure 21: GCC Care Management Solutions Industry Revenue Share (%), by Country 2024 & 2032
- Figure 22: GCC Care Management Solutions Industry Volume Share (%), by Country 2024 & 2032
- Figure 23: South America Care Management Solutions Industry Revenue (Million), by Country 2024 & 2032
- Figure 24: South America Care Management Solutions Industry Volume (K Unit), by Country 2024 & 2032
- Figure 25: South America Care Management Solutions Industry Revenue Share (%), by Country 2024 & 2032
- Figure 26: South America Care Management Solutions Industry Volume Share (%), by Country 2024 & 2032
- Figure 27: North America Care Management Solutions Industry Revenue (Million), by Component 2024 & 2032
- Figure 28: North America Care Management Solutions Industry Volume (K Unit), by Component 2024 & 2032
- Figure 29: North America Care Management Solutions Industry Revenue Share (%), by Component 2024 & 2032
- Figure 30: North America Care Management Solutions Industry Volume Share (%), by Component 2024 & 2032
- Figure 31: North America Care Management Solutions Industry Revenue (Million), by Delivery Mode 2024 & 2032
- Figure 32: North America Care Management Solutions Industry Volume (K Unit), by Delivery Mode 2024 & 2032
- Figure 33: North America Care Management Solutions Industry Revenue Share (%), by Delivery Mode 2024 & 2032
- Figure 34: North America Care Management Solutions Industry Volume Share (%), by Delivery Mode 2024 & 2032
- Figure 35: North America Care Management Solutions Industry Revenue (Million), by Application 2024 & 2032
- Figure 36: North America Care Management Solutions Industry Volume (K Unit), by Application 2024 & 2032
- Figure 37: North America Care Management Solutions Industry Revenue Share (%), by Application 2024 & 2032
- Figure 38: North America Care Management Solutions Industry Volume Share (%), by Application 2024 & 2032
- Figure 39: North America Care Management Solutions Industry Revenue (Million), by End User 2024 & 2032
- Figure 40: North America Care Management Solutions Industry Volume (K Unit), by End User 2024 & 2032
- Figure 41: North America Care Management Solutions Industry Revenue Share (%), by End User 2024 & 2032
- Figure 42: North America Care Management Solutions Industry Volume Share (%), by End User 2024 & 2032
- Figure 43: North America Care Management Solutions Industry Revenue (Million), by Country 2024 & 2032
- Figure 44: North America Care Management Solutions Industry Volume (K Unit), by Country 2024 & 2032
- Figure 45: North America Care Management Solutions Industry Revenue Share (%), by Country 2024 & 2032
- Figure 46: North America Care Management Solutions Industry Volume Share (%), by Country 2024 & 2032
- Figure 47: Europe Care Management Solutions Industry Revenue (Million), by Component 2024 & 2032
- Figure 48: Europe Care Management Solutions Industry Volume (K Unit), by Component 2024 & 2032
- Figure 49: Europe Care Management Solutions Industry Revenue Share (%), by Component 2024 & 2032
- Figure 50: Europe Care Management Solutions Industry Volume Share (%), by Component 2024 & 2032
- Figure 51: Europe Care Management Solutions Industry Revenue (Million), by Delivery Mode 2024 & 2032
- Figure 52: Europe Care Management Solutions Industry Volume (K Unit), by Delivery Mode 2024 & 2032
- Figure 53: Europe Care Management Solutions Industry Revenue Share (%), by Delivery Mode 2024 & 2032
- Figure 54: Europe Care Management Solutions Industry Volume Share (%), by Delivery Mode 2024 & 2032
- Figure 55: Europe Care Management Solutions Industry Revenue (Million), by Application 2024 & 2032
- Figure 56: Europe Care Management Solutions Industry Volume (K Unit), by Application 2024 & 2032
- Figure 57: Europe Care Management Solutions Industry Revenue Share (%), by Application 2024 & 2032
- Figure 58: Europe Care Management Solutions Industry Volume Share (%), by Application 2024 & 2032
- Figure 59: Europe Care Management Solutions Industry Revenue (Million), by End User 2024 & 2032
- Figure 60: Europe Care Management Solutions Industry Volume (K Unit), by End User 2024 & 2032
- Figure 61: Europe Care Management Solutions Industry Revenue Share (%), by End User 2024 & 2032
- Figure 62: Europe Care Management Solutions Industry Volume Share (%), by End User 2024 & 2032
- Figure 63: Europe Care Management Solutions Industry Revenue (Million), by Country 2024 & 2032
- Figure 64: Europe Care Management Solutions Industry Volume (K Unit), by Country 2024 & 2032
- Figure 65: Europe Care Management Solutions Industry Revenue Share (%), by Country 2024 & 2032
- Figure 66: Europe Care Management Solutions Industry Volume Share (%), by Country 2024 & 2032
- Figure 67: Asia Pacific Care Management Solutions Industry Revenue (Million), by Component 2024 & 2032
- Figure 68: Asia Pacific Care Management Solutions Industry Volume (K Unit), by Component 2024 & 2032
- Figure 69: Asia Pacific Care Management Solutions Industry Revenue Share (%), by Component 2024 & 2032
- Figure 70: Asia Pacific Care Management Solutions Industry Volume Share (%), by Component 2024 & 2032
- Figure 71: Asia Pacific Care Management Solutions Industry Revenue (Million), by Delivery Mode 2024 & 2032
- Figure 72: Asia Pacific Care Management Solutions Industry Volume (K Unit), by Delivery Mode 2024 & 2032
- Figure 73: Asia Pacific Care Management Solutions Industry Revenue Share (%), by Delivery Mode 2024 & 2032
- Figure 74: Asia Pacific Care Management Solutions Industry Volume Share (%), by Delivery Mode 2024 & 2032
- Figure 75: Asia Pacific Care Management Solutions Industry Revenue (Million), by Application 2024 & 2032
- Figure 76: Asia Pacific Care Management Solutions Industry Volume (K Unit), by Application 2024 & 2032
- Figure 77: Asia Pacific Care Management Solutions Industry Revenue Share (%), by Application 2024 & 2032
- Figure 78: Asia Pacific Care Management Solutions Industry Volume Share (%), by Application 2024 & 2032
- Figure 79: Asia Pacific Care Management Solutions Industry Revenue (Million), by End User 2024 & 2032
- Figure 80: Asia Pacific Care Management Solutions Industry Volume (K Unit), by End User 2024 & 2032
- Figure 81: Asia Pacific Care Management Solutions Industry Revenue Share (%), by End User 2024 & 2032
- Figure 82: Asia Pacific Care Management Solutions Industry Volume Share (%), by End User 2024 & 2032
- Figure 83: Asia Pacific Care Management Solutions Industry Revenue (Million), by Country 2024 & 2032
- Figure 84: Asia Pacific Care Management Solutions Industry Volume (K Unit), by Country 2024 & 2032
- Figure 85: Asia Pacific Care Management Solutions Industry Revenue Share (%), by Country 2024 & 2032
- Figure 86: Asia Pacific Care Management Solutions Industry Volume Share (%), by Country 2024 & 2032
- Figure 87: Middle East Care Management Solutions Industry Revenue (Million), by Component 2024 & 2032
- Figure 88: Middle East Care Management Solutions Industry Volume (K Unit), by Component 2024 & 2032
- Figure 89: Middle East Care Management Solutions Industry Revenue Share (%), by Component 2024 & 2032
- Figure 90: Middle East Care Management Solutions Industry Volume Share (%), by Component 2024 & 2032
- Figure 91: Middle East Care Management Solutions Industry Revenue (Million), by Delivery Mode 2024 & 2032
- Figure 92: Middle East Care Management Solutions Industry Volume (K Unit), by Delivery Mode 2024 & 2032
- Figure 93: Middle East Care Management Solutions Industry Revenue Share (%), by Delivery Mode 2024 & 2032
- Figure 94: Middle East Care Management Solutions Industry Volume Share (%), by Delivery Mode 2024 & 2032
- Figure 95: Middle East Care Management Solutions Industry Revenue (Million), by Application 2024 & 2032
- Figure 96: Middle East Care Management Solutions Industry Volume (K Unit), by Application 2024 & 2032
- Figure 97: Middle East Care Management Solutions Industry Revenue Share (%), by Application 2024 & 2032
- Figure 98: Middle East Care Management Solutions Industry Volume Share (%), by Application 2024 & 2032
- Figure 99: Middle East Care Management Solutions Industry Revenue (Million), by End User 2024 & 2032
- Figure 100: Middle East Care Management Solutions Industry Volume (K Unit), by End User 2024 & 2032
- Figure 101: Middle East Care Management Solutions Industry Revenue Share (%), by End User 2024 & 2032
- Figure 102: Middle East Care Management Solutions Industry Volume Share (%), by End User 2024 & 2032
- Figure 103: Middle East Care Management Solutions Industry Revenue (Million), by Country 2024 & 2032
- Figure 104: Middle East Care Management Solutions Industry Volume (K Unit), by Country 2024 & 2032
- Figure 105: Middle East Care Management Solutions Industry Revenue Share (%), by Country 2024 & 2032
- Figure 106: Middle East Care Management Solutions Industry Volume Share (%), by Country 2024 & 2032
- Figure 107: GCC Care Management Solutions Industry Revenue (Million), by Component 2024 & 2032
- Figure 108: GCC Care Management Solutions Industry Volume (K Unit), by Component 2024 & 2032
- Figure 109: GCC Care Management Solutions Industry Revenue Share (%), by Component 2024 & 2032
- Figure 110: GCC Care Management Solutions Industry Volume Share (%), by Component 2024 & 2032
- Figure 111: GCC Care Management Solutions Industry Revenue (Million), by Delivery Mode 2024 & 2032
- Figure 112: GCC Care Management Solutions Industry Volume (K Unit), by Delivery Mode 2024 & 2032
- Figure 113: GCC Care Management Solutions Industry Revenue Share (%), by Delivery Mode 2024 & 2032
- Figure 114: GCC Care Management Solutions Industry Volume Share (%), by Delivery Mode 2024 & 2032
- Figure 115: GCC Care Management Solutions Industry Revenue (Million), by Application 2024 & 2032
- Figure 116: GCC Care Management Solutions Industry Volume (K Unit), by Application 2024 & 2032
- Figure 117: GCC Care Management Solutions Industry Revenue Share (%), by Application 2024 & 2032
- Figure 118: GCC Care Management Solutions Industry Volume Share (%), by Application 2024 & 2032
- Figure 119: GCC Care Management Solutions Industry Revenue (Million), by End User 2024 & 2032
- Figure 120: GCC Care Management Solutions Industry Volume (K Unit), by End User 2024 & 2032
- Figure 121: GCC Care Management Solutions Industry Revenue Share (%), by End User 2024 & 2032
- Figure 122: GCC Care Management Solutions Industry Volume Share (%), by End User 2024 & 2032
- Figure 123: GCC Care Management Solutions Industry Revenue (Million), by Country 2024 & 2032
- Figure 124: GCC Care Management Solutions Industry Volume (K Unit), by Country 2024 & 2032
- Figure 125: GCC Care Management Solutions Industry Revenue Share (%), by Country 2024 & 2032
- Figure 126: GCC Care Management Solutions Industry Volume Share (%), by Country 2024 & 2032
- Figure 127: South America Care Management Solutions Industry Revenue (Million), by Component 2024 & 2032
- Figure 128: South America Care Management Solutions Industry Volume (K Unit), by Component 2024 & 2032
- Figure 129: South America Care Management Solutions Industry Revenue Share (%), by Component 2024 & 2032
- Figure 130: South America Care Management Solutions Industry Volume Share (%), by Component 2024 & 2032
- Figure 131: South America Care Management Solutions Industry Revenue (Million), by Delivery Mode 2024 & 2032
- Figure 132: South America Care Management Solutions Industry Volume (K Unit), by Delivery Mode 2024 & 2032
- Figure 133: South America Care Management Solutions Industry Revenue Share (%), by Delivery Mode 2024 & 2032
- Figure 134: South America Care Management Solutions Industry Volume Share (%), by Delivery Mode 2024 & 2032
- Figure 135: South America Care Management Solutions Industry Revenue (Million), by Application 2024 & 2032
- Figure 136: South America Care Management Solutions Industry Volume (K Unit), by Application 2024 & 2032
- Figure 137: South America Care Management Solutions Industry Revenue Share (%), by Application 2024 & 2032
- Figure 138: South America Care Management Solutions Industry Volume Share (%), by Application 2024 & 2032
- Figure 139: South America Care Management Solutions Industry Revenue (Million), by End User 2024 & 2032
- Figure 140: South America Care Management Solutions Industry Volume (K Unit), by End User 2024 & 2032
- Figure 141: South America Care Management Solutions Industry Revenue Share (%), by End User 2024 & 2032
- Figure 142: South America Care Management Solutions Industry Volume Share (%), by End User 2024 & 2032
- Figure 143: South America Care Management Solutions Industry Revenue (Million), by Country 2024 & 2032
- Figure 144: South America Care Management Solutions Industry Volume (K Unit), by Country 2024 & 2032
- Figure 145: South America Care Management Solutions Industry Revenue Share (%), by Country 2024 & 2032
- Figure 146: South America Care Management Solutions Industry Volume Share (%), by Country 2024 & 2032
List of Tables
- Table 1: Global Care Management Solutions Industry Revenue Million Forecast, by Region 2019 & 2032
- Table 2: Global Care Management Solutions Industry Volume K Unit Forecast, by Region 2019 & 2032
- Table 3: Global Care Management Solutions Industry Revenue Million Forecast, by Component 2019 & 2032
- Table 4: Global Care Management Solutions Industry Volume K Unit Forecast, by Component 2019 & 2032
- Table 5: Global Care Management Solutions Industry Revenue Million Forecast, by Delivery Mode 2019 & 2032
- Table 6: Global Care Management Solutions Industry Volume K Unit Forecast, by Delivery Mode 2019 & 2032
- Table 7: Global Care Management Solutions Industry Revenue Million Forecast, by Application 2019 & 2032
- Table 8: Global Care Management Solutions Industry Volume K Unit Forecast, by Application 2019 & 2032
- Table 9: Global Care Management Solutions Industry Revenue Million Forecast, by End User 2019 & 2032
- Table 10: Global Care Management Solutions Industry Volume K Unit Forecast, by End User 2019 & 2032
- Table 11: Global Care Management Solutions Industry Revenue Million Forecast, by Region 2019 & 2032
- Table 12: Global Care Management Solutions Industry Volume K Unit Forecast, by Region 2019 & 2032
- Table 13: Global Care Management Solutions Industry Revenue Million Forecast, by Country 2019 & 2032
- Table 14: Global Care Management Solutions Industry Volume K Unit Forecast, by Country 2019 & 2032
- Table 15: United States Care Management Solutions Industry Revenue (Million) Forecast, by Application 2019 & 2032
- Table 16: United States Care Management Solutions Industry Volume (K Unit) Forecast, by Application 2019 & 2032
- Table 17: Canada Care Management Solutions Industry Revenue (Million) Forecast, by Application 2019 & 2032
- Table 18: Canada Care Management Solutions Industry Volume (K Unit) Forecast, by Application 2019 & 2032
- Table 19: Mexico Care Management Solutions Industry Revenue (Million) Forecast, by Application 2019 & 2032
- Table 20: Mexico Care Management Solutions Industry Volume (K Unit) Forecast, by Application 2019 & 2032
- Table 21: Global Care Management Solutions Industry Revenue Million Forecast, by Country 2019 & 2032
- Table 22: Global Care Management Solutions Industry Volume K Unit Forecast, by Country 2019 & 2032
- Table 23: Germany Care Management Solutions Industry Revenue (Million) Forecast, by Application 2019 & 2032
- Table 24: Germany Care Management Solutions Industry Volume (K Unit) Forecast, by Application 2019 & 2032
- Table 25: United Kindom Care Management Solutions Industry Revenue (Million) Forecast, by Application 2019 & 2032
- Table 26: United Kindom Care Management Solutions Industry Volume (K Unit) Forecast, by Application 2019 & 2032
- Table 27: France Care Management Solutions Industry Revenue (Million) Forecast, by Application 2019 & 2032
- Table 28: France Care Management Solutions Industry Volume (K Unit) Forecast, by Application 2019 & 2032
- Table 29: Italy Care Management Solutions Industry Revenue (Million) Forecast, by Application 2019 & 2032
- Table 30: Italy Care Management Solutions Industry Volume (K Unit) Forecast, by Application 2019 & 2032
- Table 31: Spain Care Management Solutions Industry Revenue (Million) Forecast, by Application 2019 & 2032
- Table 32: Spain Care Management Solutions Industry Volume (K Unit) Forecast, by Application 2019 & 2032
- Table 33: Rest of Europe Care Management Solutions Industry Revenue (Million) Forecast, by Application 2019 & 2032
- Table 34: Rest of Europe Care Management Solutions Industry Volume (K Unit) Forecast, by Application 2019 & 2032
- Table 35: Global Care Management Solutions Industry Revenue Million Forecast, by Country 2019 & 2032
- Table 36: Global Care Management Solutions Industry Volume K Unit Forecast, by Country 2019 & 2032
- Table 37: China Care Management Solutions Industry Revenue (Million) Forecast, by Application 2019 & 2032
- Table 38: China Care Management Solutions Industry Volume (K Unit) Forecast, by Application 2019 & 2032
- Table 39: Japan Care Management Solutions Industry Revenue (Million) Forecast, by Application 2019 & 2032
- Table 40: Japan Care Management Solutions Industry Volume (K Unit) Forecast, by Application 2019 & 2032
- Table 41: India Care Management Solutions Industry Revenue (Million) Forecast, by Application 2019 & 2032
- Table 42: India Care Management Solutions Industry Volume (K Unit) Forecast, by Application 2019 & 2032
- Table 43: Australia Care Management Solutions Industry Revenue (Million) Forecast, by Application 2019 & 2032
- Table 44: Australia Care Management Solutions Industry Volume (K Unit) Forecast, by Application 2019 & 2032
- Table 45: South Korea Care Management Solutions Industry Revenue (Million) Forecast, by Application 2019 & 2032
- Table 46: South Korea Care Management Solutions Industry Volume (K Unit) Forecast, by Application 2019 & 2032
- Table 47: Rest of Asia Pacific Care Management Solutions Industry Revenue (Million) Forecast, by Application 2019 & 2032
- Table 48: Rest of Asia Pacific Care Management Solutions Industry Volume (K Unit) Forecast, by Application 2019 & 2032
- Table 49: Global Care Management Solutions Industry Revenue Million Forecast, by Country 2019 & 2032
- Table 50: Global Care Management Solutions Industry Volume K Unit Forecast, by Country 2019 & 2032
- Table 51: Care Management Solutions Industry Revenue (Million) Forecast, by Application 2019 & 2032
- Table 52: Care Management Solutions Industry Volume (K Unit) Forecast, by Application 2019 & 2032
- Table 53: Global Care Management Solutions Industry Revenue Million Forecast, by Country 2019 & 2032
- Table 54: Global Care Management Solutions Industry Volume K Unit Forecast, by Country 2019 & 2032
- Table 55: South Africa Care Management Solutions Industry Revenue (Million) Forecast, by Application 2019 & 2032
- Table 56: South Africa Care Management Solutions Industry Volume (K Unit) Forecast, by Application 2019 & 2032
- Table 57: Rest of Middle East and Africa Care Management Solutions Industry Revenue (Million) Forecast, by Application 2019 & 2032
- Table 58: Rest of Middle East and Africa Care Management Solutions Industry Volume (K Unit) Forecast, by Application 2019 & 2032
- Table 59: Global Care Management Solutions Industry Revenue Million Forecast, by Country 2019 & 2032
- Table 60: Global Care Management Solutions Industry Volume K Unit Forecast, by Country 2019 & 2032
- Table 61: Brazil Care Management Solutions Industry Revenue (Million) Forecast, by Application 2019 & 2032
- Table 62: Brazil Care Management Solutions Industry Volume (K Unit) Forecast, by Application 2019 & 2032
- Table 63: Argentina Care Management Solutions Industry Revenue (Million) Forecast, by Application 2019 & 2032
- Table 64: Argentina Care Management Solutions Industry Volume (K Unit) Forecast, by Application 2019 & 2032
- Table 65: Rest of South America Care Management Solutions Industry Revenue (Million) Forecast, by Application 2019 & 2032
- Table 66: Rest of South America Care Management Solutions Industry Volume (K Unit) Forecast, by Application 2019 & 2032
- Table 67: Global Care Management Solutions Industry Revenue Million Forecast, by Component 2019 & 2032
- Table 68: Global Care Management Solutions Industry Volume K Unit Forecast, by Component 2019 & 2032
- Table 69: Global Care Management Solutions Industry Revenue Million Forecast, by Delivery Mode 2019 & 2032
- Table 70: Global Care Management Solutions Industry Volume K Unit Forecast, by Delivery Mode 2019 & 2032
- Table 71: Global Care Management Solutions Industry Revenue Million Forecast, by Application 2019 & 2032
- Table 72: Global Care Management Solutions Industry Volume K Unit Forecast, by Application 2019 & 2032
- Table 73: Global Care Management Solutions Industry Revenue Million Forecast, by End User 2019 & 2032
- Table 74: Global Care Management Solutions Industry Volume K Unit Forecast, by End User 2019 & 2032
- Table 75: Global Care Management Solutions Industry Revenue Million Forecast, by Country 2019 & 2032
- Table 76: Global Care Management Solutions Industry Volume K Unit Forecast, by Country 2019 & 2032
- Table 77: United States Care Management Solutions Industry Revenue (Million) Forecast, by Application 2019 & 2032
- Table 78: United States Care Management Solutions Industry Volume (K Unit) Forecast, by Application 2019 & 2032
- Table 79: Canada Care Management Solutions Industry Revenue (Million) Forecast, by Application 2019 & 2032
- Table 80: Canada Care Management Solutions Industry Volume (K Unit) Forecast, by Application 2019 & 2032
- Table 81: Mexico Care Management Solutions Industry Revenue (Million) Forecast, by Application 2019 & 2032
- Table 82: Mexico Care Management Solutions Industry Volume (K Unit) Forecast, by Application 2019 & 2032
- Table 83: Global Care Management Solutions Industry Revenue Million Forecast, by Component 2019 & 2032
- Table 84: Global Care Management Solutions Industry Volume K Unit Forecast, by Component 2019 & 2032
- Table 85: Global Care Management Solutions Industry Revenue Million Forecast, by Delivery Mode 2019 & 2032
- Table 86: Global Care Management Solutions Industry Volume K Unit Forecast, by Delivery Mode 2019 & 2032
- Table 87: Global Care Management Solutions Industry Revenue Million Forecast, by Application 2019 & 2032
- Table 88: Global Care Management Solutions Industry Volume K Unit Forecast, by Application 2019 & 2032
- Table 89: Global Care Management Solutions Industry Revenue Million Forecast, by End User 2019 & 2032
- Table 90: Global Care Management Solutions Industry Volume K Unit Forecast, by End User 2019 & 2032
- Table 91: Global Care Management Solutions Industry Revenue Million Forecast, by Country 2019 & 2032
- Table 92: Global Care Management Solutions Industry Volume K Unit Forecast, by Country 2019 & 2032
- Table 93: Germany Care Management Solutions Industry Revenue (Million) Forecast, by Application 2019 & 2032
- Table 94: Germany Care Management Solutions Industry Volume (K Unit) Forecast, by Application 2019 & 2032
- Table 95: United Kindom Care Management Solutions Industry Revenue (Million) Forecast, by Application 2019 & 2032
- Table 96: United Kindom Care Management Solutions Industry Volume (K Unit) Forecast, by Application 2019 & 2032
- Table 97: France Care Management Solutions Industry Revenue (Million) Forecast, by Application 2019 & 2032
- Table 98: France Care Management Solutions Industry Volume (K Unit) Forecast, by Application 2019 & 2032
- Table 99: Italy Care Management Solutions Industry Revenue (Million) Forecast, by Application 2019 & 2032
- Table 100: Italy Care Management Solutions Industry Volume (K Unit) Forecast, by Application 2019 & 2032
- Table 101: Spain Care Management Solutions Industry Revenue (Million) Forecast, by Application 2019 & 2032
- Table 102: Spain Care Management Solutions Industry Volume (K Unit) Forecast, by Application 2019 & 2032
- Table 103: Rest of Europe Care Management Solutions Industry Revenue (Million) Forecast, by Application 2019 & 2032
- Table 104: Rest of Europe Care Management Solutions Industry Volume (K Unit) Forecast, by Application 2019 & 2032
- Table 105: Global Care Management Solutions Industry Revenue Million Forecast, by Component 2019 & 2032
- Table 106: Global Care Management Solutions Industry Volume K Unit Forecast, by Component 2019 & 2032
- Table 107: Global Care Management Solutions Industry Revenue Million Forecast, by Delivery Mode 2019 & 2032
- Table 108: Global Care Management Solutions Industry Volume K Unit Forecast, by Delivery Mode 2019 & 2032
- Table 109: Global Care Management Solutions Industry Revenue Million Forecast, by Application 2019 & 2032
- Table 110: Global Care Management Solutions Industry Volume K Unit Forecast, by Application 2019 & 2032
- Table 111: Global Care Management Solutions Industry Revenue Million Forecast, by End User 2019 & 2032
- Table 112: Global Care Management Solutions Industry Volume K Unit Forecast, by End User 2019 & 2032
- Table 113: Global Care Management Solutions Industry Revenue Million Forecast, by Country 2019 & 2032
- Table 114: Global Care Management Solutions Industry Volume K Unit Forecast, by Country 2019 & 2032
- Table 115: China Care Management Solutions Industry Revenue (Million) Forecast, by Application 2019 & 2032
- Table 116: China Care Management Solutions Industry Volume (K Unit) Forecast, by Application 2019 & 2032
- Table 117: Japan Care Management Solutions Industry Revenue (Million) Forecast, by Application 2019 & 2032
- Table 118: Japan Care Management Solutions Industry Volume (K Unit) Forecast, by Application 2019 & 2032
- Table 119: India Care Management Solutions Industry Revenue (Million) Forecast, by Application 2019 & 2032
- Table 120: India Care Management Solutions Industry Volume (K Unit) Forecast, by Application 2019 & 2032
- Table 121: Australia Care Management Solutions Industry Revenue (Million) Forecast, by Application 2019 & 2032
- Table 122: Australia Care Management Solutions Industry Volume (K Unit) Forecast, by Application 2019 & 2032
- Table 123: South Korea Care Management Solutions Industry Revenue (Million) Forecast, by Application 2019 & 2032
- Table 124: South Korea Care Management Solutions Industry Volume (K Unit) Forecast, by Application 2019 & 2032
- Table 125: Rest of Asia Pacific Care Management Solutions Industry Revenue (Million) Forecast, by Application 2019 & 2032
- Table 126: Rest of Asia Pacific Care Management Solutions Industry Volume (K Unit) Forecast, by Application 2019 & 2032
- Table 127: Global Care Management Solutions Industry Revenue Million Forecast, by Component 2019 & 2032
- Table 128: Global Care Management Solutions Industry Volume K Unit Forecast, by Component 2019 & 2032
- Table 129: Global Care Management Solutions Industry Revenue Million Forecast, by Delivery Mode 2019 & 2032
- Table 130: Global Care Management Solutions Industry Volume K Unit Forecast, by Delivery Mode 2019 & 2032
- Table 131: Global Care Management Solutions Industry Revenue Million Forecast, by Application 2019 & 2032
- Table 132: Global Care Management Solutions Industry Volume K Unit Forecast, by Application 2019 & 2032
- Table 133: Global Care Management Solutions Industry Revenue Million Forecast, by End User 2019 & 2032
- Table 134: Global Care Management Solutions Industry Volume K Unit Forecast, by End User 2019 & 2032
- Table 135: Global Care Management Solutions Industry Revenue Million Forecast, by Country 2019 & 2032
- Table 136: Global Care Management Solutions Industry Volume K Unit Forecast, by Country 2019 & 2032
- Table 137: Global Care Management Solutions Industry Revenue Million Forecast, by Component 2019 & 2032
- Table 138: Global Care Management Solutions Industry Volume K Unit Forecast, by Component 2019 & 2032
- Table 139: Global Care Management Solutions Industry Revenue Million Forecast, by Delivery Mode 2019 & 2032
- Table 140: Global Care Management Solutions Industry Volume K Unit Forecast, by Delivery Mode 2019 & 2032
- Table 141: Global Care Management Solutions Industry Revenue Million Forecast, by Application 2019 & 2032
- Table 142: Global Care Management Solutions Industry Volume K Unit Forecast, by Application 2019 & 2032
- Table 143: Global Care Management Solutions Industry Revenue Million Forecast, by End User 2019 & 2032
- Table 144: Global Care Management Solutions Industry Volume K Unit Forecast, by End User 2019 & 2032
- Table 145: Global Care Management Solutions Industry Revenue Million Forecast, by Country 2019 & 2032
- Table 146: Global Care Management Solutions Industry Volume K Unit Forecast, by Country 2019 & 2032
- Table 147: South Africa Care Management Solutions Industry Revenue (Million) Forecast, by Application 2019 & 2032
- Table 148: South Africa Care Management Solutions Industry Volume (K Unit) Forecast, by Application 2019 & 2032
- Table 149: Rest of Middle East and Africa Care Management Solutions Industry Revenue (Million) Forecast, by Application 2019 & 2032
- Table 150: Rest of Middle East and Africa Care Management Solutions Industry Volume (K Unit) Forecast, by Application 2019 & 2032
- Table 151: Global Care Management Solutions Industry Revenue Million Forecast, by Component 2019 & 2032
- Table 152: Global Care Management Solutions Industry Volume K Unit Forecast, by Component 2019 & 2032
- Table 153: Global Care Management Solutions Industry Revenue Million Forecast, by Delivery Mode 2019 & 2032
- Table 154: Global Care Management Solutions Industry Volume K Unit Forecast, by Delivery Mode 2019 & 2032
- Table 155: Global Care Management Solutions Industry Revenue Million Forecast, by Application 2019 & 2032
- Table 156: Global Care Management Solutions Industry Volume K Unit Forecast, by Application 2019 & 2032
- Table 157: Global Care Management Solutions Industry Revenue Million Forecast, by End User 2019 & 2032
- Table 158: Global Care Management Solutions Industry Volume K Unit Forecast, by End User 2019 & 2032
- Table 159: Global Care Management Solutions Industry Revenue Million Forecast, by Country 2019 & 2032
- Table 160: Global Care Management Solutions Industry Volume K Unit Forecast, by Country 2019 & 2032
- Table 161: Brazil Care Management Solutions Industry Revenue (Million) Forecast, by Application 2019 & 2032
- Table 162: Brazil Care Management Solutions Industry Volume (K Unit) Forecast, by Application 2019 & 2032
- Table 163: Argentina Care Management Solutions Industry Revenue (Million) Forecast, by Application 2019 & 2032
- Table 164: Argentina Care Management Solutions Industry Volume (K Unit) Forecast, by Application 2019 & 2032
- Table 165: Rest of South America Care Management Solutions Industry Revenue (Million) Forecast, by Application 2019 & 2032
- Table 166: Rest of South America Care Management Solutions Industry Volume (K Unit) Forecast, by Application 2019 & 2032
Frequently Asked Questions
1. What is the projected Compound Annual Growth Rate (CAGR) of the Care Management Solutions Industry?
The projected CAGR is approximately 12.23%.
2. Which companies are prominent players in the Care Management Solutions Industry?
Key companies in the market include Zeomega Inc, Medecision Inc, Phytel Inc (IBM Corporation), Cognizant, I2I Systems Inc, Centene Corporation (Evolve), Veradigm, InfoMC, Infosys Limited, Convey Health Solutions, Optum Inc, EPIC Corporation Inc, Exl Healthcare, Hinduja Global Solutions Limited.
3. What are the main segments of the Care Management Solutions Industry?
The market segments include Component, Delivery Mode, Application, End User.
4. Can you provide details about the market size?
The market size is estimated to be USD 15.03 Million as of 2022.
5. What are some drivers contributing to market growth?
Rising Geriatric Population and Burden of Chronic Diseases; Care Management Solutions Offer a Means to Reduce Healthcare Costs; Government Initiatives on Healthcare Services and Infrastructure.
6. What are the notable trends driving market growth?
Chronic Care Management Segment Expected to Hold a Significant Share in the Care Management Solutions Market.
7. Are there any restraints impacting market growth?
High Investments Required for Supporting Infrastructure; Data Security Concerns Related to Cloud-based Solutions.
8. Can you provide examples of recent developments in the market?
April 2023: Medecision, a provider of digital care management solutions and services, launched Aerial Social Care Coordinator, a cutting-edge solution designed to provide health plans and healthcare providers with immediate insight into individuals' social determinants of health barriers.
9. What pricing options are available for accessing the report?
Pricing options include single-user, multi-user, and enterprise licenses priced at USD 4750, USD 5250, and USD 8750 respectively.
10. Is the market size provided in terms of value or volume?
The market size is provided in terms of value, measured in Million and volume, measured in K Unit.
11. Are there any specific market keywords associated with the report?
Yes, the market keyword associated with the report is "Care Management Solutions Industry," which aids in identifying and referencing the specific market segment covered.
12. How do I determine which pricing option suits my needs best?
The pricing options vary based on user requirements and access needs. Individual users may opt for single-user licenses, while businesses requiring broader access may choose multi-user or enterprise licenses for cost-effective access to the report.
13. Are there any additional resources or data provided in the Care Management Solutions Industry report?
While the report offers comprehensive insights, it's advisable to review the specific contents or supplementary materials provided to ascertain if additional resources or data are available.
14. How can I stay updated on further developments or reports in the Care Management Solutions Industry?
To stay informed about further developments, trends, and reports in the Care Management Solutions Industry, consider subscribing to industry newsletters, following relevant companies and organizations, or regularly checking reputable industry news sources and publications.
Methodology
Step 1 - Identification of Relevant Samples Size from Population Database


Step 2 - Approaches for Defining Global Market Size (Value, Volume* & Price*)

Note*: In applicable scenarios
Step 3 - Data Sources
Primary Research
- Web Analytics
- Survey Reports
- Research Institute
- Latest Research Reports
- Opinion Leaders
Secondary Research
- Annual Reports
- White Paper
- Latest Press Release
- Industry Association
- Paid Database
- Investor Presentations

Step 4 - Data Triangulation
Involves using different sources of information in order to increase the validity of a study
These sources are likely to be stakeholders in a program - participants, other researchers, program staff, other community members, and so on.
Then we put all data in single framework & apply various statistical tools to find out the dynamic on the market.
During the analysis stage, feedback from the stakeholder groups would be compared to determine areas of agreement as well as areas of divergence
