

Key Insights
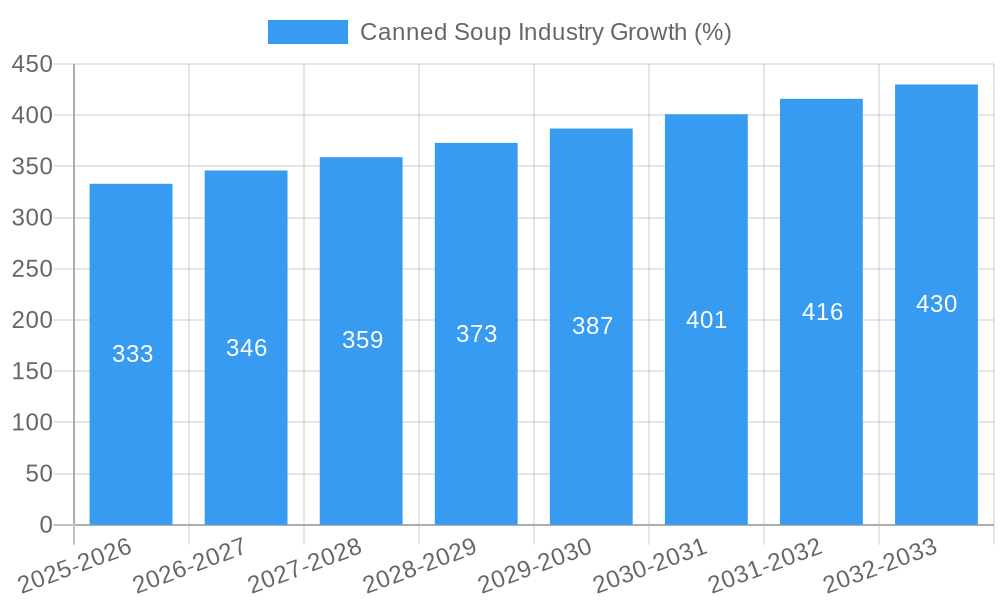
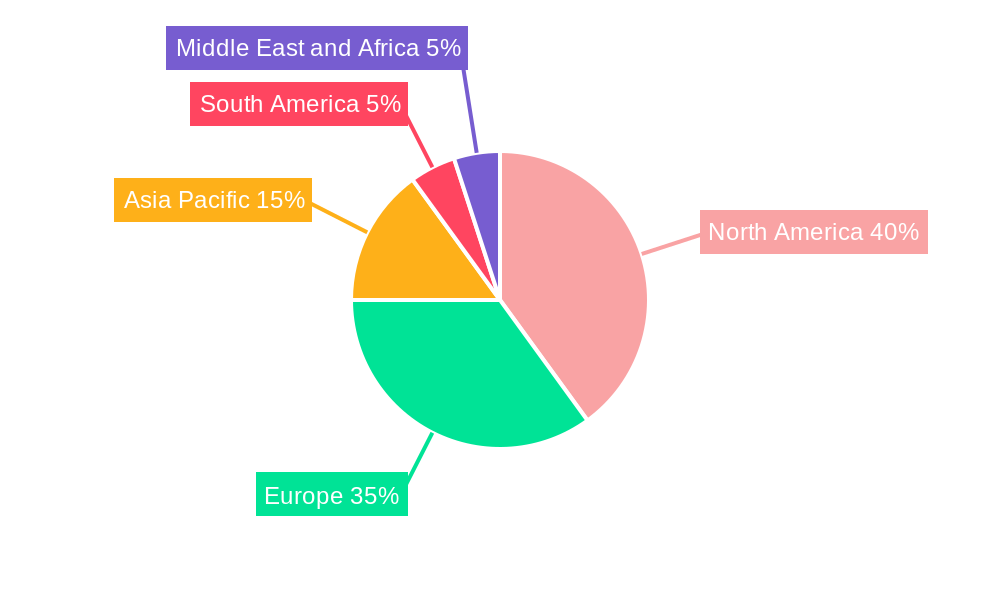
The canned soup market, valued at $8.53 billion in 2025, is projected to experience steady growth, driven by factors such as increasing consumer demand for convenient meal options, a rising preference for ready-to-eat foods, and the expanding online retail sector. The market's 4.01% CAGR indicates consistent expansion through 2033. Growth is fueled by the popularity of condensed and ready-to-eat varieties across various categories, including conventional and organic options. Supermarkets and hypermarkets remain dominant distribution channels, although online retail is experiencing significant growth, reflecting evolving consumer shopping habits. Key players like Campbell Soup Company, General Mills Inc., and Unilever PLC are leveraging brand recognition and product innovation to maintain market share. However, increasing raw material costs and evolving consumer preferences towards healthier options present challenges. The organic segment is expected to witness faster growth compared to the conventional segment driven by health-conscious consumers. Geographic distribution shows North America and Europe currently holding substantial market shares, but the Asia-Pacific region is anticipated to showcase significant growth potential due to rising disposable incomes and changing dietary habits.
The competitive landscape is characterized by established multinational corporations alongside regional players. Strategic initiatives such as product diversification, expansion into new markets, and mergers and acquisitions will shape the competitive dynamics in the coming years. While the condensed soup segment continues to be a staple, the ready-to-eat segment is gaining traction, indicating a shift towards convenience and immediate consumption. The continued focus on health and wellness is also pushing manufacturers towards offering low-sodium, organic, and healthier options. Successful players will be those who adapt to these changing trends by innovating their product offerings and enhancing their distribution networks, especially through online channels. The market's future growth trajectory depends on sustained consumer demand, successful navigation of supply chain challenges, and the ability of players to adapt to changing consumer preferences.

Canned Soup Industry: A Comprehensive Market Report (2019-2033)
This comprehensive report provides a detailed analysis of the Canned Soup Industry, covering market dynamics, leading players, emerging trends, and future growth prospects. The study period spans from 2019 to 2033, with 2025 serving as the base and estimated year. The report offers actionable insights for industry stakeholders, investors, and businesses seeking to navigate this dynamic market.
Canned Soup Industry Market Dynamics & Concentration
The canned soup market, valued at xx Million in 2024, exhibits a moderately concentrated structure. Key players like Campbell Soup Company, The Kraft Heinz Company, and Unilever PLC hold significant market share, though smaller, niche players are also contributing significantly. Market concentration is influenced by factors such as brand recognition, established distribution networks, and economies of scale. Innovation is a crucial driver, with companies continuously introducing new flavors, formats (e.g., ready-to-eat, organic), and packaging to cater to evolving consumer preferences. Stringent food safety regulations and labeling requirements form the regulatory framework, while competitive pressures and the availability of substitutes (e.g., fresh soups, instant noodles) influence market dynamics. Mergers and acquisitions (M&A) activities, while not excessively frequent, play a role in shaping market consolidation and expansion. For the period 2019-2024, an estimated xx M&A deals occurred within the industry. The market share of the top 5 players in 2024 was approximately xx%.
- Market Concentration: Moderately concentrated
- Innovation Drivers: New flavors, formats, packaging
- Regulatory Frameworks: Stringent food safety and labeling regulations
- Product Substitutes: Fresh soups, instant noodles
- End-User Trends: Health-consciousness, convenience seeking
- M&A Activity (2019-2024): xx deals
Canned Soup Industry Industry Trends & Analysis
The canned soup market is projected to witness a Compound Annual Growth Rate (CAGR) of xx% during the forecast period (2025-2033), reaching a value of xx Million by 2033. This growth is fueled by several factors. Rising disposable incomes, particularly in developing economies, are expanding the market for convenient and affordable food options. Changing lifestyles and increased urbanization are contributing to the growing demand for ready-to-eat meals. Technological advancements in food processing and preservation techniques have led to improved product quality and shelf life. The growing popularity of organic and health-conscious options is driving the adoption of organic canned soups. Consumer preferences are shifting towards diverse flavors and healthier ingredients, which is pushing innovation in the industry. However, intense competition among established players and the emergence of new entrants are creating competitive pressures. Market penetration of organic canned soups is steadily increasing, with an estimated xx% penetration rate in 2024.
Leading Markets & Segments in Canned Soup Industry
The North American market dominates the global canned soup industry, driven by high consumption rates and the presence of major players. Within this region, the United States holds the largest market share.
Key Drivers:
- North America: High consumption rates, established brands, strong distribution networks.
- Europe: Growing demand for convenience foods, increased health consciousness.
- Asia-Pacific: Rising disposable incomes, expanding urbanization.
Segment Dominance:
- Type: Condensed soups continue to dominate the market due to their affordability and longer shelf life, but ready-to-eat segments are growing rapidly.
- Category: Conventional soups hold the largest market share, but the organic segment is experiencing strong growth.
- Distribution Channel: Supermarkets/hypermarkets constitute the primary distribution channel, followed by convenience stores and online retail.
Canned Soup Industry Product Developments
Recent product innovations highlight a focus on healthier options and diverse flavors. Companies are introducing organic and plant-based soups, catering to health-conscious consumers. Technological advancements in packaging and preservation are enhancing product quality and shelf life. Furthermore, the inclusion of innovative flavor profiles and convenient formats (e.g., single-serve cans) cater to changing consumer preferences. This focus on differentiation and meeting evolving consumer needs is vital for sustained competitive advantage in a relatively mature market.
Key Drivers of Canned Soup Industry Growth
Several factors are driving the growth of the canned soup industry. Firstly, rising disposable incomes in developing nations boost the demand for convenient and affordable food. Secondly, busy lifestyles fuel the need for quick and easy meal options. Finally, advancements in food technology, such as improved preservation techniques and innovative packaging solutions, enhance product quality and shelf life, further stimulating demand.
Challenges in the Canned Soup Industry Market
The canned soup industry faces challenges such as increasing raw material costs and fluctuating supply chain dynamics, impacting profitability. Intense competition and the pressure to innovate continuously to cater to changing consumer preferences also pose significant hurdles. Furthermore, stringent regulatory compliance requirements and the growing popularity of fresh and homemade alternatives add further complexity. The impact of these factors on market growth is estimated to be a reduction of approximately xx% annually.
Emerging Opportunities in Canned Soup Industry
The industry presents several promising avenues for growth. The growing demand for healthy and convenient food options creates opportunities for manufacturers to expand their organic and plant-based product lines. Strategic partnerships and collaborations can enhance distribution and market reach. Moreover, exploring emerging markets with increasing disposable incomes can unlock significant growth potential. Technological advancements in packaging and preservation are expected to further enhance product quality and extend shelf life, opening avenues for product differentiation and expansion.
Leading Players in the Canned Soup Industry Sector
- BCI Foods Inc
- Bar Harbor Foods
- General Mills Inc
- Unilever PLC
- Hain Celestial Group Inc
- F Whitlock & Sons
- The Kraft Heinz Company
- Baxters Food Group Limited
- Amy's Kitchen Inc
- Campbell Soup Company
- Sprague Foods Ltd
Key Milestones in Canned Soup Industry Industry
- January 2023: Heinz UK launched plant-based canned soups (Creamy Tomato Soup and Beanz & Sausages), expanding into the vegan market and increasing product diversity.
- January 2023: Campbell Soup Company launched Chunky Ghost pepper chicken noodle soup, introducing a spicier variant to attract consumers seeking bolder flavors and creating a unique product offering.
- April 2023: F Whitlock & Sons launched a new range of canned soups with unique flavors (peri-peri chicken, Moroccan spiced carrot and lentil soup, Louisiana-style tomato, capsicum, and corn gumbo), highlighting a focus on natural ingredients and appealing to health-conscious consumers.
Strategic Outlook for Canned Soup Industry Market
The canned soup industry's future hinges on adaptability and innovation. Companies that successfully cater to health and wellness trends, embrace sustainable practices, and leverage technological advancements will thrive. Strategic partnerships to enhance distribution and market penetration are also key. Further expansion into emerging markets and a focus on product differentiation, such as convenient packaging and innovative flavor profiles, are crucial for capturing a larger share of the expanding market. The long-term market potential is promising, particularly for brands that successfully integrate sustainability and health consciousness into their product offerings and marketing strategies.
Canned Soup Industry Segmentation
-
1. Type
- 1.1. Condensed
- 1.2. Ready-to-Eat
-
2. Category
- 2.1. Conventional
- 2.2. Organic
-
3. Distribution Channel
- 3.1. Supermarkets/Hypermarkets
- 3.2. Convenience/Grocery Stores
- 3.3. Food Specialty Stores
- 3.4. Online Retail Stores
- 3.5. Other Distribution Channels
Canned Soup Industry Segmentation By Geography
-
1. North America
- 1.1. United States
- 1.2. Canada
- 1.3. Mexico
- 1.4. Rest of North America
-
2. Europe
- 2.1. Spain
- 2.2. United Kingdom
- 2.3. Germany
- 2.4. France
- 2.5. Italy
- 2.6. Russia
- 2.7. Rest of Europe
-
3. Asia Pacific
- 3.1. China
- 3.2. Japan
- 3.3. India
- 3.4. Australia
- 3.5. Rest of Asia Pacific
-
4. South America
- 4.1. Brazil
- 4.2. Argentina
- 4.3. Rest of South America
-
5. Middle East and Africa
- 5.1. South Africa
- 5.2. United Arab Emirates
- 5.3. Rest of Middle East and Africa
Canned Soup Industry REPORT HIGHLIGHTS
| Aspects | Details |
|---|---|
| Study Period | 2019-2033 |
| Base Year | 2024 |
| Estimated Year | 2025 |
| Forecast Period | 2025-2033 |
| Historical Period | 2019-2024 |
| Growth Rate | CAGR of 4.01% from 2019-2033 |
| Segmentation |
|
Table of Contents
- 1. Introduction
- 1.1. Research Scope
- 1.2. Market Segmentation
- 1.3. Research Methodology
- 1.4. Definitions and Assumptions
- 2. Executive Summary
- 2.1. Introduction
- 3. Market Dynamics
- 3.1. Introduction
- 3.2. Market Drivers
- 3.2.1. Increasing Expenditure on Convenience Food Products; The Growing Trend of Vegan Food Products Drives the Market of Plant-based Canned Soup Market
- 3.3. Market Restrains
- 3.3.1. Food additives present in Canned Soup products can hinder the market growth
- 3.4. Market Trends
- 3.4.1. Rise in Spending on Convenience Products
- 4. Market Factor Analysis
- 4.1. Porters Five Forces
- 4.2. Supply/Value Chain
- 4.3. PESTEL analysis
- 4.4. Market Entropy
- 4.5. Patent/Trademark Analysis
- 5. Global Canned Soup Industry Analysis, Insights and Forecast, 2019-2031
- 5.1. Market Analysis, Insights and Forecast - by Type
- 5.1.1. Condensed
- 5.1.2. Ready-to-Eat
- 5.2. Market Analysis, Insights and Forecast - by Category
- 5.2.1. Conventional
- 5.2.2. Organic
- 5.3. Market Analysis, Insights and Forecast - by Distribution Channel
- 5.3.1. Supermarkets/Hypermarkets
- 5.3.2. Convenience/Grocery Stores
- 5.3.3. Food Specialty Stores
- 5.3.4. Online Retail Stores
- 5.3.5. Other Distribution Channels
- 5.4. Market Analysis, Insights and Forecast - by Region
- 5.4.1. North America
- 5.4.2. Europe
- 5.4.3. Asia Pacific
- 5.4.4. South America
- 5.4.5. Middle East and Africa
- 5.1. Market Analysis, Insights and Forecast - by Type
- 6. North America Canned Soup Industry Analysis, Insights and Forecast, 2019-2031
- 6.1. Market Analysis, Insights and Forecast - by Type
- 6.1.1. Condensed
- 6.1.2. Ready-to-Eat
- 6.2. Market Analysis, Insights and Forecast - by Category
- 6.2.1. Conventional
- 6.2.2. Organic
- 6.3. Market Analysis, Insights and Forecast - by Distribution Channel
- 6.3.1. Supermarkets/Hypermarkets
- 6.3.2. Convenience/Grocery Stores
- 6.3.3. Food Specialty Stores
- 6.3.4. Online Retail Stores
- 6.3.5. Other Distribution Channels
- 6.1. Market Analysis, Insights and Forecast - by Type
- 7. Europe Canned Soup Industry Analysis, Insights and Forecast, 2019-2031
- 7.1. Market Analysis, Insights and Forecast - by Type
- 7.1.1. Condensed
- 7.1.2. Ready-to-Eat
- 7.2. Market Analysis, Insights and Forecast - by Category
- 7.2.1. Conventional
- 7.2.2. Organic
- 7.3. Market Analysis, Insights and Forecast - by Distribution Channel
- 7.3.1. Supermarkets/Hypermarkets
- 7.3.2. Convenience/Grocery Stores
- 7.3.3. Food Specialty Stores
- 7.3.4. Online Retail Stores
- 7.3.5. Other Distribution Channels
- 7.1. Market Analysis, Insights and Forecast - by Type
- 8. Asia Pacific Canned Soup Industry Analysis, Insights and Forecast, 2019-2031
- 8.1. Market Analysis, Insights and Forecast - by Type
- 8.1.1. Condensed
- 8.1.2. Ready-to-Eat
- 8.2. Market Analysis, Insights and Forecast - by Category
- 8.2.1. Conventional
- 8.2.2. Organic
- 8.3. Market Analysis, Insights and Forecast - by Distribution Channel
- 8.3.1. Supermarkets/Hypermarkets
- 8.3.2. Convenience/Grocery Stores
- 8.3.3. Food Specialty Stores
- 8.3.4. Online Retail Stores
- 8.3.5. Other Distribution Channels
- 8.1. Market Analysis, Insights and Forecast - by Type
- 9. South America Canned Soup Industry Analysis, Insights and Forecast, 2019-2031
- 9.1. Market Analysis, Insights and Forecast - by Type
- 9.1.1. Condensed
- 9.1.2. Ready-to-Eat
- 9.2. Market Analysis, Insights and Forecast - by Category
- 9.2.1. Conventional
- 9.2.2. Organic
- 9.3. Market Analysis, Insights and Forecast - by Distribution Channel
- 9.3.1. Supermarkets/Hypermarkets
- 9.3.2. Convenience/Grocery Stores
- 9.3.3. Food Specialty Stores
- 9.3.4. Online Retail Stores
- 9.3.5. Other Distribution Channels
- 9.1. Market Analysis, Insights and Forecast - by Type
- 10. Middle East and Africa Canned Soup Industry Analysis, Insights and Forecast, 2019-2031
- 10.1. Market Analysis, Insights and Forecast - by Type
- 10.1.1. Condensed
- 10.1.2. Ready-to-Eat
- 10.2. Market Analysis, Insights and Forecast - by Category
- 10.2.1. Conventional
- 10.2.2. Organic
- 10.3. Market Analysis, Insights and Forecast - by Distribution Channel
- 10.3.1. Supermarkets/Hypermarkets
- 10.3.2. Convenience/Grocery Stores
- 10.3.3. Food Specialty Stores
- 10.3.4. Online Retail Stores
- 10.3.5. Other Distribution Channels
- 10.1. Market Analysis, Insights and Forecast - by Type
- 11. North America Canned Soup Industry Analysis, Insights and Forecast, 2019-2031
- 11.1. Market Analysis, Insights and Forecast - By Country/Sub-region
- 11.1.1 United States
- 11.1.2 Canada
- 11.1.3 Mexico
- 11.1.4 Rest of North America
- 12. Europe Canned Soup Industry Analysis, Insights and Forecast, 2019-2031
- 12.1. Market Analysis, Insights and Forecast - By Country/Sub-region
- 12.1.1 Spain
- 12.1.2 United Kingdom
- 12.1.3 Germany
- 12.1.4 France
- 12.1.5 Italy
- 12.1.6 Russia
- 12.1.7 Rest of Europe
- 13. Asia Pacific Canned Soup Industry Analysis, Insights and Forecast, 2019-2031
- 13.1. Market Analysis, Insights and Forecast - By Country/Sub-region
- 13.1.1 China
- 13.1.2 Japan
- 13.1.3 India
- 13.1.4 Australia
- 13.1.5 Rest of Asia Pacific
- 14. South America Canned Soup Industry Analysis, Insights and Forecast, 2019-2031
- 14.1. Market Analysis, Insights and Forecast - By Country/Sub-region
- 14.1.1 Brazil
- 14.1.2 Argentina
- 14.1.3 Rest of South America
- 15. Middle East and Africa Canned Soup Industry Analysis, Insights and Forecast, 2019-2031
- 15.1. Market Analysis, Insights and Forecast - By Country/Sub-region
- 15.1.1 South Africa
- 15.1.2 United Arab Emirates
- 15.1.3 Rest of Middle East and Africa
- 16. Competitive Analysis
- 16.1. Global Market Share Analysis 2024
- 16.2. Company Profiles
- 16.2.1 BCI Foods Inc
- 16.2.1.1. Overview
- 16.2.1.2. Products
- 16.2.1.3. SWOT Analysis
- 16.2.1.4. Recent Developments
- 16.2.1.5. Financials (Based on Availability)
- 16.2.2 Bar Harbor Foods
- 16.2.2.1. Overview
- 16.2.2.2. Products
- 16.2.2.3. SWOT Analysis
- 16.2.2.4. Recent Developments
- 16.2.2.5. Financials (Based on Availability)
- 16.2.3 General Mills Inc
- 16.2.3.1. Overview
- 16.2.3.2. Products
- 16.2.3.3. SWOT Analysis
- 16.2.3.4. Recent Developments
- 16.2.3.5. Financials (Based on Availability)
- 16.2.4 Unilever PLC
- 16.2.4.1. Overview
- 16.2.4.2. Products
- 16.2.4.3. SWOT Analysis
- 16.2.4.4. Recent Developments
- 16.2.4.5. Financials (Based on Availability)
- 16.2.5 Hain Celestial Group Inc
- 16.2.5.1. Overview
- 16.2.5.2. Products
- 16.2.5.3. SWOT Analysis
- 16.2.5.4. Recent Developments
- 16.2.5.5. Financials (Based on Availability)
- 16.2.6 F Whitlock & Sons
- 16.2.6.1. Overview
- 16.2.6.2. Products
- 16.2.6.3. SWOT Analysis
- 16.2.6.4. Recent Developments
- 16.2.6.5. Financials (Based on Availability)
- 16.2.7 The Kraft Heinz Company
- 16.2.7.1. Overview
- 16.2.7.2. Products
- 16.2.7.3. SWOT Analysis
- 16.2.7.4. Recent Developments
- 16.2.7.5. Financials (Based on Availability)
- 16.2.8 Baxters Food Group Limited
- 16.2.8.1. Overview
- 16.2.8.2. Products
- 16.2.8.3. SWOT Analysis
- 16.2.8.4. Recent Developments
- 16.2.8.5. Financials (Based on Availability)
- 16.2.9 Amy's Kitchen Inc
- 16.2.9.1. Overview
- 16.2.9.2. Products
- 16.2.9.3. SWOT Analysis
- 16.2.9.4. Recent Developments
- 16.2.9.5. Financials (Based on Availability)
- 16.2.10 Campbell Soup Company
- 16.2.10.1. Overview
- 16.2.10.2. Products
- 16.2.10.3. SWOT Analysis
- 16.2.10.4. Recent Developments
- 16.2.10.5. Financials (Based on Availability)
- 16.2.11 Sprague Foods Ltd
- 16.2.11.1. Overview
- 16.2.11.2. Products
- 16.2.11.3. SWOT Analysis
- 16.2.11.4. Recent Developments
- 16.2.11.5. Financials (Based on Availability)
- 16.2.1 BCI Foods Inc
List of Figures
- Figure 1: Global Canned Soup Industry Revenue Breakdown (Million, %) by Region 2024 & 2032
- Figure 2: North America Canned Soup Industry Revenue (Million), by Country 2024 & 2032
- Figure 3: North America Canned Soup Industry Revenue Share (%), by Country 2024 & 2032
- Figure 4: Europe Canned Soup Industry Revenue (Million), by Country 2024 & 2032
- Figure 5: Europe Canned Soup Industry Revenue Share (%), by Country 2024 & 2032
- Figure 6: Asia Pacific Canned Soup Industry Revenue (Million), by Country 2024 & 2032
- Figure 7: Asia Pacific Canned Soup Industry Revenue Share (%), by Country 2024 & 2032
- Figure 8: South America Canned Soup Industry Revenue (Million), by Country 2024 & 2032
- Figure 9: South America Canned Soup Industry Revenue Share (%), by Country 2024 & 2032
- Figure 10: Middle East and Africa Canned Soup Industry Revenue (Million), by Country 2024 & 2032
- Figure 11: Middle East and Africa Canned Soup Industry Revenue Share (%), by Country 2024 & 2032
- Figure 12: North America Canned Soup Industry Revenue (Million), by Type 2024 & 2032
- Figure 13: North America Canned Soup Industry Revenue Share (%), by Type 2024 & 2032
- Figure 14: North America Canned Soup Industry Revenue (Million), by Category 2024 & 2032
- Figure 15: North America Canned Soup Industry Revenue Share (%), by Category 2024 & 2032
- Figure 16: North America Canned Soup Industry Revenue (Million), by Distribution Channel 2024 & 2032
- Figure 17: North America Canned Soup Industry Revenue Share (%), by Distribution Channel 2024 & 2032
- Figure 18: North America Canned Soup Industry Revenue (Million), by Country 2024 & 2032
- Figure 19: North America Canned Soup Industry Revenue Share (%), by Country 2024 & 2032
- Figure 20: Europe Canned Soup Industry Revenue (Million), by Type 2024 & 2032
- Figure 21: Europe Canned Soup Industry Revenue Share (%), by Type 2024 & 2032
- Figure 22: Europe Canned Soup Industry Revenue (Million), by Category 2024 & 2032
- Figure 23: Europe Canned Soup Industry Revenue Share (%), by Category 2024 & 2032
- Figure 24: Europe Canned Soup Industry Revenue (Million), by Distribution Channel 2024 & 2032
- Figure 25: Europe Canned Soup Industry Revenue Share (%), by Distribution Channel 2024 & 2032
- Figure 26: Europe Canned Soup Industry Revenue (Million), by Country 2024 & 2032
- Figure 27: Europe Canned Soup Industry Revenue Share (%), by Country 2024 & 2032
- Figure 28: Asia Pacific Canned Soup Industry Revenue (Million), by Type 2024 & 2032
- Figure 29: Asia Pacific Canned Soup Industry Revenue Share (%), by Type 2024 & 2032
- Figure 30: Asia Pacific Canned Soup Industry Revenue (Million), by Category 2024 & 2032
- Figure 31: Asia Pacific Canned Soup Industry Revenue Share (%), by Category 2024 & 2032
- Figure 32: Asia Pacific Canned Soup Industry Revenue (Million), by Distribution Channel 2024 & 2032
- Figure 33: Asia Pacific Canned Soup Industry Revenue Share (%), by Distribution Channel 2024 & 2032
- Figure 34: Asia Pacific Canned Soup Industry Revenue (Million), by Country 2024 & 2032
- Figure 35: Asia Pacific Canned Soup Industry Revenue Share (%), by Country 2024 & 2032
- Figure 36: South America Canned Soup Industry Revenue (Million), by Type 2024 & 2032
- Figure 37: South America Canned Soup Industry Revenue Share (%), by Type 2024 & 2032
- Figure 38: South America Canned Soup Industry Revenue (Million), by Category 2024 & 2032
- Figure 39: South America Canned Soup Industry Revenue Share (%), by Category 2024 & 2032
- Figure 40: South America Canned Soup Industry Revenue (Million), by Distribution Channel 2024 & 2032
- Figure 41: South America Canned Soup Industry Revenue Share (%), by Distribution Channel 2024 & 2032
- Figure 42: South America Canned Soup Industry Revenue (Million), by Country 2024 & 2032
- Figure 43: South America Canned Soup Industry Revenue Share (%), by Country 2024 & 2032
- Figure 44: Middle East and Africa Canned Soup Industry Revenue (Million), by Type 2024 & 2032
- Figure 45: Middle East and Africa Canned Soup Industry Revenue Share (%), by Type 2024 & 2032
- Figure 46: Middle East and Africa Canned Soup Industry Revenue (Million), by Category 2024 & 2032
- Figure 47: Middle East and Africa Canned Soup Industry Revenue Share (%), by Category 2024 & 2032
- Figure 48: Middle East and Africa Canned Soup Industry Revenue (Million), by Distribution Channel 2024 & 2032
- Figure 49: Middle East and Africa Canned Soup Industry Revenue Share (%), by Distribution Channel 2024 & 2032
- Figure 50: Middle East and Africa Canned Soup Industry Revenue (Million), by Country 2024 & 2032
- Figure 51: Middle East and Africa Canned Soup Industry Revenue Share (%), by Country 2024 & 2032
List of Tables
- Table 1: Global Canned Soup Industry Revenue Million Forecast, by Region 2019 & 2032
- Table 2: Global Canned Soup Industry Revenue Million Forecast, by Type 2019 & 2032
- Table 3: Global Canned Soup Industry Revenue Million Forecast, by Category 2019 & 2032
- Table 4: Global Canned Soup Industry Revenue Million Forecast, by Distribution Channel 2019 & 2032
- Table 5: Global Canned Soup Industry Revenue Million Forecast, by Region 2019 & 2032
- Table 6: Global Canned Soup Industry Revenue Million Forecast, by Country 2019 & 2032
- Table 7: United States Canned Soup Industry Revenue (Million) Forecast, by Application 2019 & 2032
- Table 8: Canada Canned Soup Industry Revenue (Million) Forecast, by Application 2019 & 2032
- Table 9: Mexico Canned Soup Industry Revenue (Million) Forecast, by Application 2019 & 2032
- Table 10: Rest of North America Canned Soup Industry Revenue (Million) Forecast, by Application 2019 & 2032
- Table 11: Global Canned Soup Industry Revenue Million Forecast, by Country 2019 & 2032
- Table 12: Spain Canned Soup Industry Revenue (Million) Forecast, by Application 2019 & 2032
- Table 13: United Kingdom Canned Soup Industry Revenue (Million) Forecast, by Application 2019 & 2032
- Table 14: Germany Canned Soup Industry Revenue (Million) Forecast, by Application 2019 & 2032
- Table 15: France Canned Soup Industry Revenue (Million) Forecast, by Application 2019 & 2032
- Table 16: Italy Canned Soup Industry Revenue (Million) Forecast, by Application 2019 & 2032
- Table 17: Russia Canned Soup Industry Revenue (Million) Forecast, by Application 2019 & 2032
- Table 18: Rest of Europe Canned Soup Industry Revenue (Million) Forecast, by Application 2019 & 2032
- Table 19: Global Canned Soup Industry Revenue Million Forecast, by Country 2019 & 2032
- Table 20: China Canned Soup Industry Revenue (Million) Forecast, by Application 2019 & 2032
- Table 21: Japan Canned Soup Industry Revenue (Million) Forecast, by Application 2019 & 2032
- Table 22: India Canned Soup Industry Revenue (Million) Forecast, by Application 2019 & 2032
- Table 23: Australia Canned Soup Industry Revenue (Million) Forecast, by Application 2019 & 2032
- Table 24: Rest of Asia Pacific Canned Soup Industry Revenue (Million) Forecast, by Application 2019 & 2032
- Table 25: Global Canned Soup Industry Revenue Million Forecast, by Country 2019 & 2032
- Table 26: Brazil Canned Soup Industry Revenue (Million) Forecast, by Application 2019 & 2032
- Table 27: Argentina Canned Soup Industry Revenue (Million) Forecast, by Application 2019 & 2032
- Table 28: Rest of South America Canned Soup Industry Revenue (Million) Forecast, by Application 2019 & 2032
- Table 29: Global Canned Soup Industry Revenue Million Forecast, by Country 2019 & 2032
- Table 30: South Africa Canned Soup Industry Revenue (Million) Forecast, by Application 2019 & 2032
- Table 31: United Arab Emirates Canned Soup Industry Revenue (Million) Forecast, by Application 2019 & 2032
- Table 32: Rest of Middle East and Africa Canned Soup Industry Revenue (Million) Forecast, by Application 2019 & 2032
- Table 33: Global Canned Soup Industry Revenue Million Forecast, by Type 2019 & 2032
- Table 34: Global Canned Soup Industry Revenue Million Forecast, by Category 2019 & 2032
- Table 35: Global Canned Soup Industry Revenue Million Forecast, by Distribution Channel 2019 & 2032
- Table 36: Global Canned Soup Industry Revenue Million Forecast, by Country 2019 & 2032
- Table 37: United States Canned Soup Industry Revenue (Million) Forecast, by Application 2019 & 2032
- Table 38: Canada Canned Soup Industry Revenue (Million) Forecast, by Application 2019 & 2032
- Table 39: Mexico Canned Soup Industry Revenue (Million) Forecast, by Application 2019 & 2032
- Table 40: Rest of North America Canned Soup Industry Revenue (Million) Forecast, by Application 2019 & 2032
- Table 41: Global Canned Soup Industry Revenue Million Forecast, by Type 2019 & 2032
- Table 42: Global Canned Soup Industry Revenue Million Forecast, by Category 2019 & 2032
- Table 43: Global Canned Soup Industry Revenue Million Forecast, by Distribution Channel 2019 & 2032
- Table 44: Global Canned Soup Industry Revenue Million Forecast, by Country 2019 & 2032
- Table 45: Spain Canned Soup Industry Revenue (Million) Forecast, by Application 2019 & 2032
- Table 46: United Kingdom Canned Soup Industry Revenue (Million) Forecast, by Application 2019 & 2032
- Table 47: Germany Canned Soup Industry Revenue (Million) Forecast, by Application 2019 & 2032
- Table 48: France Canned Soup Industry Revenue (Million) Forecast, by Application 2019 & 2032
- Table 49: Italy Canned Soup Industry Revenue (Million) Forecast, by Application 2019 & 2032
- Table 50: Russia Canned Soup Industry Revenue (Million) Forecast, by Application 2019 & 2032
- Table 51: Rest of Europe Canned Soup Industry Revenue (Million) Forecast, by Application 2019 & 2032
- Table 52: Global Canned Soup Industry Revenue Million Forecast, by Type 2019 & 2032
- Table 53: Global Canned Soup Industry Revenue Million Forecast, by Category 2019 & 2032
- Table 54: Global Canned Soup Industry Revenue Million Forecast, by Distribution Channel 2019 & 2032
- Table 55: Global Canned Soup Industry Revenue Million Forecast, by Country 2019 & 2032
- Table 56: China Canned Soup Industry Revenue (Million) Forecast, by Application 2019 & 2032
- Table 57: Japan Canned Soup Industry Revenue (Million) Forecast, by Application 2019 & 2032
- Table 58: India Canned Soup Industry Revenue (Million) Forecast, by Application 2019 & 2032
- Table 59: Australia Canned Soup Industry Revenue (Million) Forecast, by Application 2019 & 2032
- Table 60: Rest of Asia Pacific Canned Soup Industry Revenue (Million) Forecast, by Application 2019 & 2032
- Table 61: Global Canned Soup Industry Revenue Million Forecast, by Type 2019 & 2032
- Table 62: Global Canned Soup Industry Revenue Million Forecast, by Category 2019 & 2032
- Table 63: Global Canned Soup Industry Revenue Million Forecast, by Distribution Channel 2019 & 2032
- Table 64: Global Canned Soup Industry Revenue Million Forecast, by Country 2019 & 2032
- Table 65: Brazil Canned Soup Industry Revenue (Million) Forecast, by Application 2019 & 2032
- Table 66: Argentina Canned Soup Industry Revenue (Million) Forecast, by Application 2019 & 2032
- Table 67: Rest of South America Canned Soup Industry Revenue (Million) Forecast, by Application 2019 & 2032
- Table 68: Global Canned Soup Industry Revenue Million Forecast, by Type 2019 & 2032
- Table 69: Global Canned Soup Industry Revenue Million Forecast, by Category 2019 & 2032
- Table 70: Global Canned Soup Industry Revenue Million Forecast, by Distribution Channel 2019 & 2032
- Table 71: Global Canned Soup Industry Revenue Million Forecast, by Country 2019 & 2032
- Table 72: South Africa Canned Soup Industry Revenue (Million) Forecast, by Application 2019 & 2032
- Table 73: United Arab Emirates Canned Soup Industry Revenue (Million) Forecast, by Application 2019 & 2032
- Table 74: Rest of Middle East and Africa Canned Soup Industry Revenue (Million) Forecast, by Application 2019 & 2032
Frequently Asked Questions
1. What is the projected Compound Annual Growth Rate (CAGR) of the Canned Soup Industry?
The projected CAGR is approximately 4.01%.
2. Which companies are prominent players in the Canned Soup Industry?
Key companies in the market include BCI Foods Inc, Bar Harbor Foods, General Mills Inc, Unilever PLC, Hain Celestial Group Inc, F Whitlock & Sons, The Kraft Heinz Company, Baxters Food Group Limited, Amy's Kitchen Inc, Campbell Soup Company, Sprague Foods Ltd.
3. What are the main segments of the Canned Soup Industry?
The market segments include Type, Category, Distribution Channel.
4. Can you provide details about the market size?
The market size is estimated to be USD 8.53 Million as of 2022.
5. What are some drivers contributing to market growth?
Increasing Expenditure on Convenience Food Products; The Growing Trend of Vegan Food Products Drives the Market of Plant-based Canned Soup Market.
6. What are the notable trends driving market growth?
Rise in Spending on Convenience Products.
7. Are there any restraints impacting market growth?
Food additives present in Canned Soup products can hinder the market growth.
8. Can you provide examples of recent developments in the market?
April 2023: F Whitlock & Sons announced the launch of its new range of canned soups in three flavors. The launch includes new flavors such as peri-peri chicken, Moroccan spiced carrot and lentil soup, Louisiana-style tomato, capsicum, and corn gumbo. The company also claims that the range has no artificial colors, preservatives, or flavors.
9. What pricing options are available for accessing the report?
Pricing options include single-user, multi-user, and enterprise licenses priced at USD 4750, USD 5250, and USD 8750 respectively.
10. Is the market size provided in terms of value or volume?
The market size is provided in terms of value, measured in Million.
11. Are there any specific market keywords associated with the report?
Yes, the market keyword associated with the report is "Canned Soup Industry," which aids in identifying and referencing the specific market segment covered.
12. How do I determine which pricing option suits my needs best?
The pricing options vary based on user requirements and access needs. Individual users may opt for single-user licenses, while businesses requiring broader access may choose multi-user or enterprise licenses for cost-effective access to the report.
13. Are there any additional resources or data provided in the Canned Soup Industry report?
While the report offers comprehensive insights, it's advisable to review the specific contents or supplementary materials provided to ascertain if additional resources or data are available.
14. How can I stay updated on further developments or reports in the Canned Soup Industry?
To stay informed about further developments, trends, and reports in the Canned Soup Industry, consider subscribing to industry newsletters, following relevant companies and organizations, or regularly checking reputable industry news sources and publications.
Methodology
Step 1 - Identification of Relevant Samples Size from Population Database


Step 2 - Approaches for Defining Global Market Size (Value, Volume* & Price*)

Note*: In applicable scenarios
Step 3 - Data Sources
Primary Research
- Web Analytics
- Survey Reports
- Research Institute
- Latest Research Reports
- Opinion Leaders
Secondary Research
- Annual Reports
- White Paper
- Latest Press Release
- Industry Association
- Paid Database
- Investor Presentations

Step 4 - Data Triangulation
Involves using different sources of information in order to increase the validity of a study
These sources are likely to be stakeholders in a program - participants, other researchers, program staff, other community members, and so on.
Then we put all data in single framework & apply various statistical tools to find out the dynamic on the market.
During the analysis stage, feedback from the stakeholder groups would be compared to determine areas of agreement as well as areas of divergence
