

Key Insights
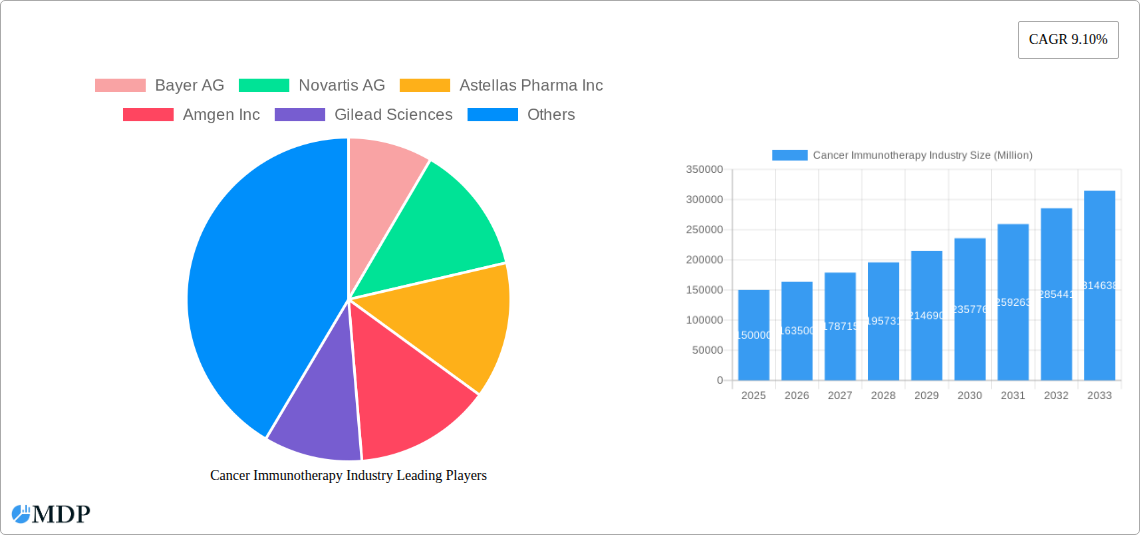
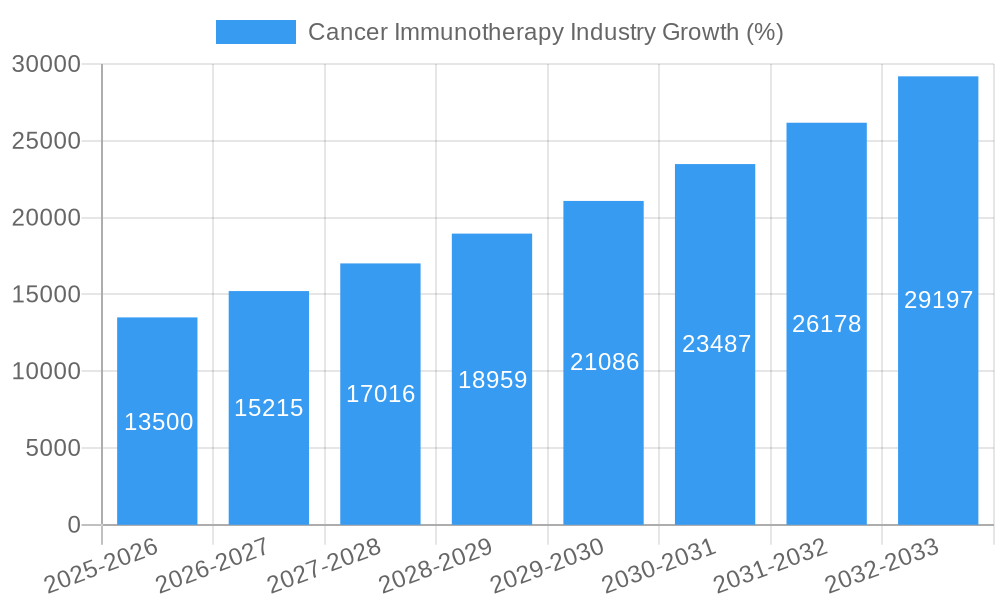
The global cancer immunotherapy market, exhibiting a robust CAGR of 9.10% from 2019 to 2024, is poised for continued expansion through 2033. This growth is fueled by several key drivers. Firstly, the rising prevalence of cancer globally, coupled with an aging population in many developed nations, creates a significantly expanding patient pool requiring advanced treatment options. Secondly, continuous advancements in immunotherapy research and development, leading to the approval of novel therapies and improved efficacy profiles, are a major catalyst. The success of immune checkpoint inhibitors (ICIs) like PD-1 and PD-L1 inhibitors has significantly broadened the therapeutic landscape and opened new avenues for research. Thirdly, increased investment in oncology research from both public and private sectors fuels innovation and accelerates the commercialization of effective cancer immunotherapies. While the high cost of these therapies and potential side effects represent challenges, the significant improvement in patient outcomes and survival rates outweighs these concerns for many patients and healthcare providers. Furthermore, the market is segmented by therapy type (Monoclonal Antibodies, Cancer Vaccines, Immunomodulators, Immune Checkpoint Inhibitors, and Others), application (Prostate, Breast, Skin, Lung, and Other Cancers), and end-users (Hospitals, Research Centers, and Others). This segmentation highlights the diverse therapeutic strategies and target patient populations, reflecting the multifaceted nature of cancer treatment and research.
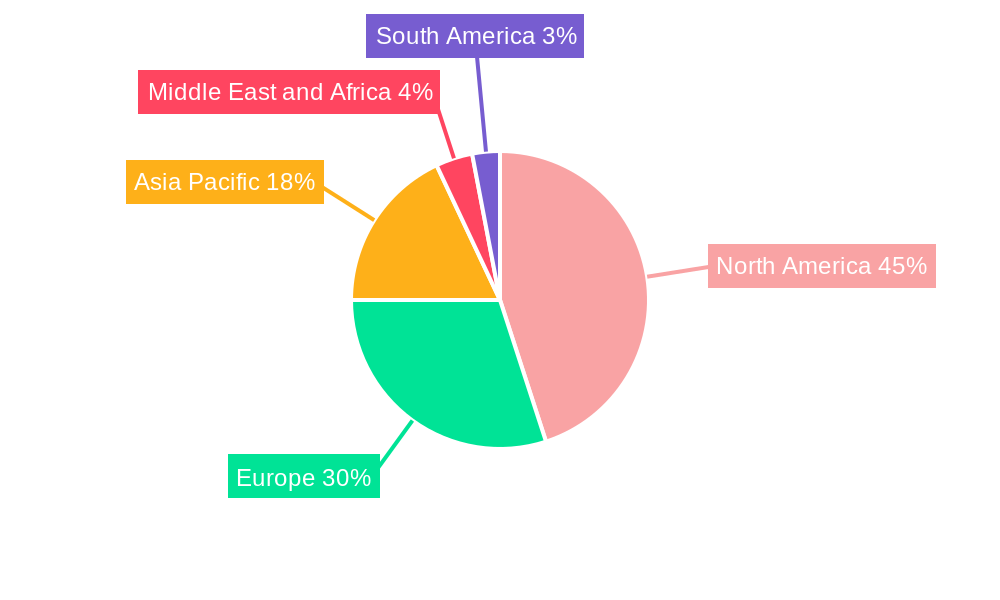
The market's regional distribution reflects a concentration of resources and development in North America and Europe, which traditionally hold a higher proportion of research and development facilities and advanced healthcare infrastructure. However, rapid economic growth and rising healthcare expenditure in Asia-Pacific are driving significant expansion in this region, particularly in China and India. The competitive landscape is dominated by major pharmaceutical companies like Bayer, Novartis, Amgen, Gilead, and others, who are engaged in a fierce race to innovate and capture market share. This competitive pressure further accelerates the development of next-generation immunotherapies and contributes to better treatment options for patients worldwide. Future growth will likely be driven by the emergence of personalized medicine approaches, combining immunotherapy with other treatment modalities such as chemotherapy or radiation, and advancements in combination therapies that further enhance efficacy and reduce side effects. The continued focus on improved access and affordability will also be critical in ensuring widespread adoption of these life-saving treatments.
Cancer Immunotherapy Market: A Comprehensive Report (2019-2033)
This comprehensive report provides an in-depth analysis of the global cancer immunotherapy market, offering valuable insights for stakeholders across the industry. With a detailed study period spanning 2019-2033, a base year of 2025, and a forecast period of 2025-2033, this report presents a robust overview of market dynamics, trends, and future projections. The report covers key segments including therapy types (Monoclonal Antibodies, Cancer Vaccines, Immunomodulators, Immune Checkpoint Inhibitors, Other Therapy Types), applications (Prostate Cancer, Breast Cancer, Skin Cancer, Lung Cancer, Other Applications), and end-users (Hospitals and Clinics, Cancer Research Centers, Other End Users). Leading players like Bayer AG, Novartis AG, Astellas Pharma Inc, Amgen Inc, Gilead Sciences, OSE Immunotherapeutics, Seattle Genetics Inc, AstraZeneca PLC, Eli Lilly and Company, Bristol-Myers Squibb, Merck and Co Inc, GlaxoSmithKline PLC, F Hoffman La Roche Ltd, and Pfizer Inc are thoroughly examined. The market is projected to reach xx Million by 2033, showcasing significant growth potential.
Cancer Immunotherapy Industry Market Dynamics & Concentration
The cancer immunotherapy market is characterized by high concentration among a few key players, reflecting significant investments in R&D and robust intellectual property portfolios. Market share is highly dynamic, with companies engaged in strategic partnerships, acquisitions, and licensing agreements to expand their product portfolios and geographic reach. Over the historical period (2019-2024), the market witnessed xx M&A deals, with an average deal size of xx Million. This trend is expected to continue during the forecast period (2025-2033), fueled by the significant unmet medical needs and the high profitability potential of successful immunotherapies. Innovation in areas such as CAR T-cell therapy and oncolytic viruses continues to drive market expansion. Regulatory frameworks, while evolving, present both opportunities and challenges, requiring rigorous clinical trials and approvals. The emergence of biosimilars presents a potential competitive threat, impacting the pricing dynamics and market share of established players. End-user trends show increasing demand for targeted therapies with improved efficacy and reduced side effects.
Cancer Immunotherapy Industry Industry Trends & Analysis
The global cancer immunotherapy market exhibits robust growth, driven by several factors. The rising prevalence of cancer, coupled with an aging global population, significantly fuels market expansion. Technological advancements leading to more effective and safer immunotherapies are another key driver, particularly in personalized medicine approaches that tailor treatments to individual patient genetic profiles. Consumer preferences shift toward minimally invasive procedures with fewer side effects, increasing the demand for innovative cancer immunotherapies. The market experienced a CAGR of xx% during the historical period (2019-2024), and is projected to maintain a healthy CAGR of xx% during the forecast period (2025-2033). This growth, however, is not without its challenges. Competitive dynamics are intense, with established players and emerging biotech companies vying for market share. Market penetration of novel immunotherapies remains a key focus for companies seeking to establish a strong presence in the market.
Leading Markets & Segments in Cancer Immunotherapy Industry
- Dominant Region: North America currently holds the largest market share, driven by advanced healthcare infrastructure, high adoption rates of novel therapies, and substantial investments in research and development. Europe follows as a significant market, while Asia-Pacific is projected to show the highest growth rate during the forecast period.
- Dominant Therapy Type: Monoclonal antibodies dominate the market, contributing to the largest revenue share owing to their established efficacy and broad clinical applications across various cancer types. Immune checkpoint inhibitors also hold a significant portion of the market due to their effectiveness in treating specific cancers.
- Dominant Application: Lung cancer and melanoma represent significant market segments due to their high prevalence and responsiveness to immunotherapy. Prostate cancer and breast cancer also constitute considerable segments with increasing adoption of immunotherapeutic approaches.
- Dominant End-User: Hospitals and clinics are the primary end-users, accounting for the majority of market revenue, owing to the extensive infrastructure and expertise required for administering these complex therapies. Cancer research centers also play a pivotal role in driving innovation and adoption of new immunotherapies. Key drivers for regional dominance include robust healthcare infrastructure, favorable regulatory landscapes, and increased government funding for cancer research. The competitive landscape is marked by a combination of large pharmaceutical companies and smaller specialized biotech firms, each contributing to the overall market dynamism.
Cancer Immunotherapy Industry Product Developments
Recent advancements focus on improving the efficacy and safety of existing immunotherapies. This includes developing novel combinations of immunotherapies and exploring personalized medicine approaches to target specific tumor mutations. Technological trends include the use of artificial intelligence (AI) to predict treatment response and improve patient selection criteria. The market is witnessing an increased focus on developing immunotherapies for "cold" tumors (those with low immune cell infiltration), which historically have not responded well to existing therapies. This reflects a significant shift toward addressing unmet clinical needs and expanding the therapeutic potential of cancer immunotherapy.
Key Drivers of Cancer Immunotherapy Industry Growth
Technological advancements, such as the development of CAR T-cell therapy and improved immune checkpoint inhibitors, are significant drivers of market expansion. Favorable regulatory environments supporting innovation and accelerated drug approvals contribute to growth. The increasing prevalence of cancer globally, coupled with rising healthcare expenditure, further strengthens market momentum. Government initiatives promoting cancer research and the development of targeted therapies bolster the industry’s expansion.
Challenges in the Cancer Immunotherapy Industry Market
High treatment costs and limited insurance coverage represent significant barriers to market access. The complexity of manufacturing and supply chain management poses challenges, impacting the availability and affordability of these advanced therapies. The potential for severe side effects necessitates stringent safety monitoring, adding to the overall cost of treatment and potentially limiting patient access. Furthermore, fierce competition among established players and emerging biotech companies creates pricing pressures.
Emerging Opportunities in Cancer Immunotherapy Industry
The development of next-generation immunotherapies with enhanced efficacy and reduced side effects presents significant opportunities. Strategic collaborations between pharmaceutical companies and biotechnology firms are driving innovation and accelerating the development of novel therapies. Expansion into emerging markets with increasing healthcare spending and unmet medical needs offers considerable growth potential. The growing application of AI and big data analytics in drug discovery and personalized medicine will further contribute to market expansion.
Leading Players in the Cancer Immunotherapy Industry Sector
- Bayer AG
- Novartis AG
- Astellas Pharma Inc
- Amgen Inc
- Gilead Sciences
- OSE Immunotherapeutics
- Seattle Genetics Inc
- AstraZeneca PLC
- Eli Lilly and Company
- Bristol-Myers Squibb
- Merck and Co Inc
- GlaxoSmithKline PLC
- F Hoffman La Roche Ltd
- Pfizer Inc
Key Milestones in Cancer Immunotherapy Industry Industry
- 2020: FDA approval of several novel immune checkpoint inhibitors.
- 2021: Significant advancements in CAR T-cell therapy resulting in improved efficacy and reduced toxicity.
- 2022: Several key partnerships between large pharmaceutical companies and biotechnology firms to accelerate drug development.
- 2023: Launch of several first-in-class immunotherapies targeting previously untreatable cancers.
- 2024: Increasing adoption of liquid biopsies to improve cancer diagnosis and monitor treatment response.
Strategic Outlook for Cancer Immunotherapy Industry Market
The future of the cancer immunotherapy market is exceptionally promising, fueled by continuous technological advancements, increased investment in research and development, and favorable regulatory support. Strategic partnerships, focused on innovative drug combinations and personalized medicine approaches, will be critical for achieving long-term growth and sustainability. Expansion into emerging markets with significant unmet medical needs and increased healthcare spending presents vast opportunities. The integration of AI and big data analytics in drug discovery and patient management will further transform the industry, driving significant growth in the years to come.
Cancer Immunotherapy Industry Segmentation
-
1. Therapy Type
- 1.1. Monoclonal Antibodies
- 1.2. Cancer Vaccines
- 1.3. Immunomodulators
- 1.4. Immune Check Point Inhibitors
- 1.5. Other Therapy Types
-
2. Application
- 2.1. Prostate Cancer
- 2.2. Breast Cancer
- 2.3. Skin Cancer
- 2.4. Lung Cancer
- 2.5. Other Applications
-
3. End Users
- 3.1. Hospitals and Clinics
- 3.2. Cancer Research Centers
- 3.3. Other End Users
Cancer Immunotherapy Industry Segmentation By Geography
-
1. North America
- 1.1. United States
- 1.2. Canada
- 1.3. Mexico
-
2. Europe
- 2.1. Germany
- 2.2. United Kingdom
- 2.3. France
- 2.4. Italy
- 2.5. Spain
- 2.6. Rest of Europe
-
3. Asia Pacific
- 3.1. China
- 3.2. Japan
- 3.3. India
- 3.4. Australia
- 3.5. South Korea
- 3.6. Rest of Asia Pacific
-
4. Middle East and Africa
- 4.1. GCC
- 4.2. South Africa
- 4.3. Rest of Middle East and Africa
-
5. South America
- 5.1. Brazil
- 5.2. Argentina
- 5.3. Rest of South America
Cancer Immunotherapy Industry REPORT HIGHLIGHTS
| Aspects | Details |
|---|---|
| Study Period | 2019-2033 |
| Base Year | 2024 |
| Estimated Year | 2025 |
| Forecast Period | 2025-2033 |
| Historical Period | 2019-2024 |
| Growth Rate | CAGR of 9.10% from 2019-2033 |
| Segmentation |
|
Table of Contents
- 1. Introduction
- 1.1. Research Scope
- 1.2. Market Segmentation
- 1.3. Research Methodology
- 1.4. Definitions and Assumptions
- 2. Executive Summary
- 2.1. Introduction
- 3. Market Dynamics
- 3.1. Introduction
- 3.2. Market Drivers
- 3.2.1. Rising R&D Activities; Increasing Effectivity and Accuracy Of Newer Therapies; Growing Prevalence of Cancer
- 3.3. Market Restrains
- 3.3.1. High Cost Coupled with Expensive Development; Stringent Regulatory Factors
- 3.4. Market Trends
- 3.4.1. Breast Cancer Segment Expected to Hold a Major Share in the Cancer Immunotherapy Market
- 4. Market Factor Analysis
- 4.1. Porters Five Forces
- 4.2. Supply/Value Chain
- 4.3. PESTEL analysis
- 4.4. Market Entropy
- 4.5. Patent/Trademark Analysis
- 5. Global Cancer Immunotherapy Industry Analysis, Insights and Forecast, 2019-2031
- 5.1. Market Analysis, Insights and Forecast - by Therapy Type
- 5.1.1. Monoclonal Antibodies
- 5.1.2. Cancer Vaccines
- 5.1.3. Immunomodulators
- 5.1.4. Immune Check Point Inhibitors
- 5.1.5. Other Therapy Types
- 5.2. Market Analysis, Insights and Forecast - by Application
- 5.2.1. Prostate Cancer
- 5.2.2. Breast Cancer
- 5.2.3. Skin Cancer
- 5.2.4. Lung Cancer
- 5.2.5. Other Applications
- 5.3. Market Analysis, Insights and Forecast - by End Users
- 5.3.1. Hospitals and Clinics
- 5.3.2. Cancer Research Centers
- 5.3.3. Other End Users
- 5.4. Market Analysis, Insights and Forecast - by Region
- 5.4.1. North America
- 5.4.2. Europe
- 5.4.3. Asia Pacific
- 5.4.4. Middle East and Africa
- 5.4.5. South America
- 5.1. Market Analysis, Insights and Forecast - by Therapy Type
- 6. North America Cancer Immunotherapy Industry Analysis, Insights and Forecast, 2019-2031
- 6.1. Market Analysis, Insights and Forecast - by Therapy Type
- 6.1.1. Monoclonal Antibodies
- 6.1.2. Cancer Vaccines
- 6.1.3. Immunomodulators
- 6.1.4. Immune Check Point Inhibitors
- 6.1.5. Other Therapy Types
- 6.2. Market Analysis, Insights and Forecast - by Application
- 6.2.1. Prostate Cancer
- 6.2.2. Breast Cancer
- 6.2.3. Skin Cancer
- 6.2.4. Lung Cancer
- 6.2.5. Other Applications
- 6.3. Market Analysis, Insights and Forecast - by End Users
- 6.3.1. Hospitals and Clinics
- 6.3.2. Cancer Research Centers
- 6.3.3. Other End Users
- 6.1. Market Analysis, Insights and Forecast - by Therapy Type
- 7. Europe Cancer Immunotherapy Industry Analysis, Insights and Forecast, 2019-2031
- 7.1. Market Analysis, Insights and Forecast - by Therapy Type
- 7.1.1. Monoclonal Antibodies
- 7.1.2. Cancer Vaccines
- 7.1.3. Immunomodulators
- 7.1.4. Immune Check Point Inhibitors
- 7.1.5. Other Therapy Types
- 7.2. Market Analysis, Insights and Forecast - by Application
- 7.2.1. Prostate Cancer
- 7.2.2. Breast Cancer
- 7.2.3. Skin Cancer
- 7.2.4. Lung Cancer
- 7.2.5. Other Applications
- 7.3. Market Analysis, Insights and Forecast - by End Users
- 7.3.1. Hospitals and Clinics
- 7.3.2. Cancer Research Centers
- 7.3.3. Other End Users
- 7.1. Market Analysis, Insights and Forecast - by Therapy Type
- 8. Asia Pacific Cancer Immunotherapy Industry Analysis, Insights and Forecast, 2019-2031
- 8.1. Market Analysis, Insights and Forecast - by Therapy Type
- 8.1.1. Monoclonal Antibodies
- 8.1.2. Cancer Vaccines
- 8.1.3. Immunomodulators
- 8.1.4. Immune Check Point Inhibitors
- 8.1.5. Other Therapy Types
- 8.2. Market Analysis, Insights and Forecast - by Application
- 8.2.1. Prostate Cancer
- 8.2.2. Breast Cancer
- 8.2.3. Skin Cancer
- 8.2.4. Lung Cancer
- 8.2.5. Other Applications
- 8.3. Market Analysis, Insights and Forecast - by End Users
- 8.3.1. Hospitals and Clinics
- 8.3.2. Cancer Research Centers
- 8.3.3. Other End Users
- 8.1. Market Analysis, Insights and Forecast - by Therapy Type
- 9. Middle East and Africa Cancer Immunotherapy Industry Analysis, Insights and Forecast, 2019-2031
- 9.1. Market Analysis, Insights and Forecast - by Therapy Type
- 9.1.1. Monoclonal Antibodies
- 9.1.2. Cancer Vaccines
- 9.1.3. Immunomodulators
- 9.1.4. Immune Check Point Inhibitors
- 9.1.5. Other Therapy Types
- 9.2. Market Analysis, Insights and Forecast - by Application
- 9.2.1. Prostate Cancer
- 9.2.2. Breast Cancer
- 9.2.3. Skin Cancer
- 9.2.4. Lung Cancer
- 9.2.5. Other Applications
- 9.3. Market Analysis, Insights and Forecast - by End Users
- 9.3.1. Hospitals and Clinics
- 9.3.2. Cancer Research Centers
- 9.3.3. Other End Users
- 9.1. Market Analysis, Insights and Forecast - by Therapy Type
- 10. South America Cancer Immunotherapy Industry Analysis, Insights and Forecast, 2019-2031
- 10.1. Market Analysis, Insights and Forecast - by Therapy Type
- 10.1.1. Monoclonal Antibodies
- 10.1.2. Cancer Vaccines
- 10.1.3. Immunomodulators
- 10.1.4. Immune Check Point Inhibitors
- 10.1.5. Other Therapy Types
- 10.2. Market Analysis, Insights and Forecast - by Application
- 10.2.1. Prostate Cancer
- 10.2.2. Breast Cancer
- 10.2.3. Skin Cancer
- 10.2.4. Lung Cancer
- 10.2.5. Other Applications
- 10.3. Market Analysis, Insights and Forecast - by End Users
- 10.3.1. Hospitals and Clinics
- 10.3.2. Cancer Research Centers
- 10.3.3. Other End Users
- 10.1. Market Analysis, Insights and Forecast - by Therapy Type
- 11. North America Cancer Immunotherapy Industry Analysis, Insights and Forecast, 2019-2031
- 11.1. Market Analysis, Insights and Forecast - By Country/Sub-region
- 11.1.1 United States
- 11.1.2 Canada
- 11.1.3 Mexico
- 12. Europe Cancer Immunotherapy Industry Analysis, Insights and Forecast, 2019-2031
- 12.1. Market Analysis, Insights and Forecast - By Country/Sub-region
- 12.1.1 Germany
- 12.1.2 United Kingdom
- 12.1.3 France
- 12.1.4 Italy
- 12.1.5 Spain
- 12.1.6 Rest of Europe
- 13. Asia Pacific Cancer Immunotherapy Industry Analysis, Insights and Forecast, 2019-2031
- 13.1. Market Analysis, Insights and Forecast - By Country/Sub-region
- 13.1.1 China
- 13.1.2 Japan
- 13.1.3 India
- 13.1.4 Australia
- 13.1.5 South Korea
- 13.1.6 Rest of Asia Pacific
- 14. Middle East and Africa Cancer Immunotherapy Industry Analysis, Insights and Forecast, 2019-2031
- 14.1. Market Analysis, Insights and Forecast - By Country/Sub-region
- 14.1.1 GCC
- 14.1.2 South Africa
- 14.1.3 Rest of Middle East and Africa
- 15. South America Cancer Immunotherapy Industry Analysis, Insights and Forecast, 2019-2031
- 15.1. Market Analysis, Insights and Forecast - By Country/Sub-region
- 15.1.1 Brazil
- 15.1.2 Argentina
- 15.1.3 Rest of South America
- 16. Competitive Analysis
- 16.1. Global Market Share Analysis 2024
- 16.2. Company Profiles
- 16.2.1 Bayer AG
- 16.2.1.1. Overview
- 16.2.1.2. Products
- 16.2.1.3. SWOT Analysis
- 16.2.1.4. Recent Developments
- 16.2.1.5. Financials (Based on Availability)
- 16.2.2 Novartis AG
- 16.2.2.1. Overview
- 16.2.2.2. Products
- 16.2.2.3. SWOT Analysis
- 16.2.2.4. Recent Developments
- 16.2.2.5. Financials (Based on Availability)
- 16.2.3 Astellas Pharma Inc
- 16.2.3.1. Overview
- 16.2.3.2. Products
- 16.2.3.3. SWOT Analysis
- 16.2.3.4. Recent Developments
- 16.2.3.5. Financials (Based on Availability)
- 16.2.4 Amgen Inc
- 16.2.4.1. Overview
- 16.2.4.2. Products
- 16.2.4.3. SWOT Analysis
- 16.2.4.4. Recent Developments
- 16.2.4.5. Financials (Based on Availability)
- 16.2.5 Gilead Sciences
- 16.2.5.1. Overview
- 16.2.5.2. Products
- 16.2.5.3. SWOT Analysis
- 16.2.5.4. Recent Developments
- 16.2.5.5. Financials (Based on Availability)
- 16.2.6 OSE Immunotherapeutics
- 16.2.6.1. Overview
- 16.2.6.2. Products
- 16.2.6.3. SWOT Analysis
- 16.2.6.4. Recent Developments
- 16.2.6.5. Financials (Based on Availability)
- 16.2.7 Seattle Genetics Inc
- 16.2.7.1. Overview
- 16.2.7.2. Products
- 16.2.7.3. SWOT Analysis
- 16.2.7.4. Recent Developments
- 16.2.7.5. Financials (Based on Availability)
- 16.2.8 AstraZeneca PLC
- 16.2.8.1. Overview
- 16.2.8.2. Products
- 16.2.8.3. SWOT Analysis
- 16.2.8.4. Recent Developments
- 16.2.8.5. Financials (Based on Availability)
- 16.2.9 Eli Lilly and Company
- 16.2.9.1. Overview
- 16.2.9.2. Products
- 16.2.9.3. SWOT Analysis
- 16.2.9.4. Recent Developments
- 16.2.9.5. Financials (Based on Availability)
- 16.2.10 Bristol-Myers Squibb
- 16.2.10.1. Overview
- 16.2.10.2. Products
- 16.2.10.3. SWOT Analysis
- 16.2.10.4. Recent Developments
- 16.2.10.5. Financials (Based on Availability)
- 16.2.11 Merck and Co Inc
- 16.2.11.1. Overview
- 16.2.11.2. Products
- 16.2.11.3. SWOT Analysis
- 16.2.11.4. Recent Developments
- 16.2.11.5. Financials (Based on Availability)
- 16.2.12 GlaxoSmithKline PLC
- 16.2.12.1. Overview
- 16.2.12.2. Products
- 16.2.12.3. SWOT Analysis
- 16.2.12.4. Recent Developments
- 16.2.12.5. Financials (Based on Availability)
- 16.2.13 F Hoffman La Roche Ltd
- 16.2.13.1. Overview
- 16.2.13.2. Products
- 16.2.13.3. SWOT Analysis
- 16.2.13.4. Recent Developments
- 16.2.13.5. Financials (Based on Availability)
- 16.2.14 Pfizer Inc
- 16.2.14.1. Overview
- 16.2.14.2. Products
- 16.2.14.3. SWOT Analysis
- 16.2.14.4. Recent Developments
- 16.2.14.5. Financials (Based on Availability)
- 16.2.1 Bayer AG
List of Figures
- Figure 1: Global Cancer Immunotherapy Industry Revenue Breakdown (Million, %) by Region 2024 & 2032
- Figure 2: Global Cancer Immunotherapy Industry Volume Breakdown (K Unit, %) by Region 2024 & 2032
- Figure 3: North America Cancer Immunotherapy Industry Revenue (Million), by Country 2024 & 2032
- Figure 4: North America Cancer Immunotherapy Industry Volume (K Unit), by Country 2024 & 2032
- Figure 5: North America Cancer Immunotherapy Industry Revenue Share (%), by Country 2024 & 2032
- Figure 6: North America Cancer Immunotherapy Industry Volume Share (%), by Country 2024 & 2032
- Figure 7: Europe Cancer Immunotherapy Industry Revenue (Million), by Country 2024 & 2032
- Figure 8: Europe Cancer Immunotherapy Industry Volume (K Unit), by Country 2024 & 2032
- Figure 9: Europe Cancer Immunotherapy Industry Revenue Share (%), by Country 2024 & 2032
- Figure 10: Europe Cancer Immunotherapy Industry Volume Share (%), by Country 2024 & 2032
- Figure 11: Asia Pacific Cancer Immunotherapy Industry Revenue (Million), by Country 2024 & 2032
- Figure 12: Asia Pacific Cancer Immunotherapy Industry Volume (K Unit), by Country 2024 & 2032
- Figure 13: Asia Pacific Cancer Immunotherapy Industry Revenue Share (%), by Country 2024 & 2032
- Figure 14: Asia Pacific Cancer Immunotherapy Industry Volume Share (%), by Country 2024 & 2032
- Figure 15: Middle East and Africa Cancer Immunotherapy Industry Revenue (Million), by Country 2024 & 2032
- Figure 16: Middle East and Africa Cancer Immunotherapy Industry Volume (K Unit), by Country 2024 & 2032
- Figure 17: Middle East and Africa Cancer Immunotherapy Industry Revenue Share (%), by Country 2024 & 2032
- Figure 18: Middle East and Africa Cancer Immunotherapy Industry Volume Share (%), by Country 2024 & 2032
- Figure 19: South America Cancer Immunotherapy Industry Revenue (Million), by Country 2024 & 2032
- Figure 20: South America Cancer Immunotherapy Industry Volume (K Unit), by Country 2024 & 2032
- Figure 21: South America Cancer Immunotherapy Industry Revenue Share (%), by Country 2024 & 2032
- Figure 22: South America Cancer Immunotherapy Industry Volume Share (%), by Country 2024 & 2032
- Figure 23: North America Cancer Immunotherapy Industry Revenue (Million), by Therapy Type 2024 & 2032
- Figure 24: North America Cancer Immunotherapy Industry Volume (K Unit), by Therapy Type 2024 & 2032
- Figure 25: North America Cancer Immunotherapy Industry Revenue Share (%), by Therapy Type 2024 & 2032
- Figure 26: North America Cancer Immunotherapy Industry Volume Share (%), by Therapy Type 2024 & 2032
- Figure 27: North America Cancer Immunotherapy Industry Revenue (Million), by Application 2024 & 2032
- Figure 28: North America Cancer Immunotherapy Industry Volume (K Unit), by Application 2024 & 2032
- Figure 29: North America Cancer Immunotherapy Industry Revenue Share (%), by Application 2024 & 2032
- Figure 30: North America Cancer Immunotherapy Industry Volume Share (%), by Application 2024 & 2032
- Figure 31: North America Cancer Immunotherapy Industry Revenue (Million), by End Users 2024 & 2032
- Figure 32: North America Cancer Immunotherapy Industry Volume (K Unit), by End Users 2024 & 2032
- Figure 33: North America Cancer Immunotherapy Industry Revenue Share (%), by End Users 2024 & 2032
- Figure 34: North America Cancer Immunotherapy Industry Volume Share (%), by End Users 2024 & 2032
- Figure 35: North America Cancer Immunotherapy Industry Revenue (Million), by Country 2024 & 2032
- Figure 36: North America Cancer Immunotherapy Industry Volume (K Unit), by Country 2024 & 2032
- Figure 37: North America Cancer Immunotherapy Industry Revenue Share (%), by Country 2024 & 2032
- Figure 38: North America Cancer Immunotherapy Industry Volume Share (%), by Country 2024 & 2032
- Figure 39: Europe Cancer Immunotherapy Industry Revenue (Million), by Therapy Type 2024 & 2032
- Figure 40: Europe Cancer Immunotherapy Industry Volume (K Unit), by Therapy Type 2024 & 2032
- Figure 41: Europe Cancer Immunotherapy Industry Revenue Share (%), by Therapy Type 2024 & 2032
- Figure 42: Europe Cancer Immunotherapy Industry Volume Share (%), by Therapy Type 2024 & 2032
- Figure 43: Europe Cancer Immunotherapy Industry Revenue (Million), by Application 2024 & 2032
- Figure 44: Europe Cancer Immunotherapy Industry Volume (K Unit), by Application 2024 & 2032
- Figure 45: Europe Cancer Immunotherapy Industry Revenue Share (%), by Application 2024 & 2032
- Figure 46: Europe Cancer Immunotherapy Industry Volume Share (%), by Application 2024 & 2032
- Figure 47: Europe Cancer Immunotherapy Industry Revenue (Million), by End Users 2024 & 2032
- Figure 48: Europe Cancer Immunotherapy Industry Volume (K Unit), by End Users 2024 & 2032
- Figure 49: Europe Cancer Immunotherapy Industry Revenue Share (%), by End Users 2024 & 2032
- Figure 50: Europe Cancer Immunotherapy Industry Volume Share (%), by End Users 2024 & 2032
- Figure 51: Europe Cancer Immunotherapy Industry Revenue (Million), by Country 2024 & 2032
- Figure 52: Europe Cancer Immunotherapy Industry Volume (K Unit), by Country 2024 & 2032
- Figure 53: Europe Cancer Immunotherapy Industry Revenue Share (%), by Country 2024 & 2032
- Figure 54: Europe Cancer Immunotherapy Industry Volume Share (%), by Country 2024 & 2032
- Figure 55: Asia Pacific Cancer Immunotherapy Industry Revenue (Million), by Therapy Type 2024 & 2032
- Figure 56: Asia Pacific Cancer Immunotherapy Industry Volume (K Unit), by Therapy Type 2024 & 2032
- Figure 57: Asia Pacific Cancer Immunotherapy Industry Revenue Share (%), by Therapy Type 2024 & 2032
- Figure 58: Asia Pacific Cancer Immunotherapy Industry Volume Share (%), by Therapy Type 2024 & 2032
- Figure 59: Asia Pacific Cancer Immunotherapy Industry Revenue (Million), by Application 2024 & 2032
- Figure 60: Asia Pacific Cancer Immunotherapy Industry Volume (K Unit), by Application 2024 & 2032
- Figure 61: Asia Pacific Cancer Immunotherapy Industry Revenue Share (%), by Application 2024 & 2032
- Figure 62: Asia Pacific Cancer Immunotherapy Industry Volume Share (%), by Application 2024 & 2032
- Figure 63: Asia Pacific Cancer Immunotherapy Industry Revenue (Million), by End Users 2024 & 2032
- Figure 64: Asia Pacific Cancer Immunotherapy Industry Volume (K Unit), by End Users 2024 & 2032
- Figure 65: Asia Pacific Cancer Immunotherapy Industry Revenue Share (%), by End Users 2024 & 2032
- Figure 66: Asia Pacific Cancer Immunotherapy Industry Volume Share (%), by End Users 2024 & 2032
- Figure 67: Asia Pacific Cancer Immunotherapy Industry Revenue (Million), by Country 2024 & 2032
- Figure 68: Asia Pacific Cancer Immunotherapy Industry Volume (K Unit), by Country 2024 & 2032
- Figure 69: Asia Pacific Cancer Immunotherapy Industry Revenue Share (%), by Country 2024 & 2032
- Figure 70: Asia Pacific Cancer Immunotherapy Industry Volume Share (%), by Country 2024 & 2032
- Figure 71: Middle East and Africa Cancer Immunotherapy Industry Revenue (Million), by Therapy Type 2024 & 2032
- Figure 72: Middle East and Africa Cancer Immunotherapy Industry Volume (K Unit), by Therapy Type 2024 & 2032
- Figure 73: Middle East and Africa Cancer Immunotherapy Industry Revenue Share (%), by Therapy Type 2024 & 2032
- Figure 74: Middle East and Africa Cancer Immunotherapy Industry Volume Share (%), by Therapy Type 2024 & 2032
- Figure 75: Middle East and Africa Cancer Immunotherapy Industry Revenue (Million), by Application 2024 & 2032
- Figure 76: Middle East and Africa Cancer Immunotherapy Industry Volume (K Unit), by Application 2024 & 2032
- Figure 77: Middle East and Africa Cancer Immunotherapy Industry Revenue Share (%), by Application 2024 & 2032
- Figure 78: Middle East and Africa Cancer Immunotherapy Industry Volume Share (%), by Application 2024 & 2032
- Figure 79: Middle East and Africa Cancer Immunotherapy Industry Revenue (Million), by End Users 2024 & 2032
- Figure 80: Middle East and Africa Cancer Immunotherapy Industry Volume (K Unit), by End Users 2024 & 2032
- Figure 81: Middle East and Africa Cancer Immunotherapy Industry Revenue Share (%), by End Users 2024 & 2032
- Figure 82: Middle East and Africa Cancer Immunotherapy Industry Volume Share (%), by End Users 2024 & 2032
- Figure 83: Middle East and Africa Cancer Immunotherapy Industry Revenue (Million), by Country 2024 & 2032
- Figure 84: Middle East and Africa Cancer Immunotherapy Industry Volume (K Unit), by Country 2024 & 2032
- Figure 85: Middle East and Africa Cancer Immunotherapy Industry Revenue Share (%), by Country 2024 & 2032
- Figure 86: Middle East and Africa Cancer Immunotherapy Industry Volume Share (%), by Country 2024 & 2032
- Figure 87: South America Cancer Immunotherapy Industry Revenue (Million), by Therapy Type 2024 & 2032
- Figure 88: South America Cancer Immunotherapy Industry Volume (K Unit), by Therapy Type 2024 & 2032
- Figure 89: South America Cancer Immunotherapy Industry Revenue Share (%), by Therapy Type 2024 & 2032
- Figure 90: South America Cancer Immunotherapy Industry Volume Share (%), by Therapy Type 2024 & 2032
- Figure 91: South America Cancer Immunotherapy Industry Revenue (Million), by Application 2024 & 2032
- Figure 92: South America Cancer Immunotherapy Industry Volume (K Unit), by Application 2024 & 2032
- Figure 93: South America Cancer Immunotherapy Industry Revenue Share (%), by Application 2024 & 2032
- Figure 94: South America Cancer Immunotherapy Industry Volume Share (%), by Application 2024 & 2032
- Figure 95: South America Cancer Immunotherapy Industry Revenue (Million), by End Users 2024 & 2032
- Figure 96: South America Cancer Immunotherapy Industry Volume (K Unit), by End Users 2024 & 2032
- Figure 97: South America Cancer Immunotherapy Industry Revenue Share (%), by End Users 2024 & 2032
- Figure 98: South America Cancer Immunotherapy Industry Volume Share (%), by End Users 2024 & 2032
- Figure 99: South America Cancer Immunotherapy Industry Revenue (Million), by Country 2024 & 2032
- Figure 100: South America Cancer Immunotherapy Industry Volume (K Unit), by Country 2024 & 2032
- Figure 101: South America Cancer Immunotherapy Industry Revenue Share (%), by Country 2024 & 2032
- Figure 102: South America Cancer Immunotherapy Industry Volume Share (%), by Country 2024 & 2032
List of Tables
- Table 1: Global Cancer Immunotherapy Industry Revenue Million Forecast, by Region 2019 & 2032
- Table 2: Global Cancer Immunotherapy Industry Volume K Unit Forecast, by Region 2019 & 2032
- Table 3: Global Cancer Immunotherapy Industry Revenue Million Forecast, by Therapy Type 2019 & 2032
- Table 4: Global Cancer Immunotherapy Industry Volume K Unit Forecast, by Therapy Type 2019 & 2032
- Table 5: Global Cancer Immunotherapy Industry Revenue Million Forecast, by Application 2019 & 2032
- Table 6: Global Cancer Immunotherapy Industry Volume K Unit Forecast, by Application 2019 & 2032
- Table 7: Global Cancer Immunotherapy Industry Revenue Million Forecast, by End Users 2019 & 2032
- Table 8: Global Cancer Immunotherapy Industry Volume K Unit Forecast, by End Users 2019 & 2032
- Table 9: Global Cancer Immunotherapy Industry Revenue Million Forecast, by Region 2019 & 2032
- Table 10: Global Cancer Immunotherapy Industry Volume K Unit Forecast, by Region 2019 & 2032
- Table 11: Global Cancer Immunotherapy Industry Revenue Million Forecast, by Country 2019 & 2032
- Table 12: Global Cancer Immunotherapy Industry Volume K Unit Forecast, by Country 2019 & 2032
- Table 13: United States Cancer Immunotherapy Industry Revenue (Million) Forecast, by Application 2019 & 2032
- Table 14: United States Cancer Immunotherapy Industry Volume (K Unit) Forecast, by Application 2019 & 2032
- Table 15: Canada Cancer Immunotherapy Industry Revenue (Million) Forecast, by Application 2019 & 2032
- Table 16: Canada Cancer Immunotherapy Industry Volume (K Unit) Forecast, by Application 2019 & 2032
- Table 17: Mexico Cancer Immunotherapy Industry Revenue (Million) Forecast, by Application 2019 & 2032
- Table 18: Mexico Cancer Immunotherapy Industry Volume (K Unit) Forecast, by Application 2019 & 2032
- Table 19: Global Cancer Immunotherapy Industry Revenue Million Forecast, by Country 2019 & 2032
- Table 20: Global Cancer Immunotherapy Industry Volume K Unit Forecast, by Country 2019 & 2032
- Table 21: Germany Cancer Immunotherapy Industry Revenue (Million) Forecast, by Application 2019 & 2032
- Table 22: Germany Cancer Immunotherapy Industry Volume (K Unit) Forecast, by Application 2019 & 2032
- Table 23: United Kingdom Cancer Immunotherapy Industry Revenue (Million) Forecast, by Application 2019 & 2032
- Table 24: United Kingdom Cancer Immunotherapy Industry Volume (K Unit) Forecast, by Application 2019 & 2032
- Table 25: France Cancer Immunotherapy Industry Revenue (Million) Forecast, by Application 2019 & 2032
- Table 26: France Cancer Immunotherapy Industry Volume (K Unit) Forecast, by Application 2019 & 2032
- Table 27: Italy Cancer Immunotherapy Industry Revenue (Million) Forecast, by Application 2019 & 2032
- Table 28: Italy Cancer Immunotherapy Industry Volume (K Unit) Forecast, by Application 2019 & 2032
- Table 29: Spain Cancer Immunotherapy Industry Revenue (Million) Forecast, by Application 2019 & 2032
- Table 30: Spain Cancer Immunotherapy Industry Volume (K Unit) Forecast, by Application 2019 & 2032
- Table 31: Rest of Europe Cancer Immunotherapy Industry Revenue (Million) Forecast, by Application 2019 & 2032
- Table 32: Rest of Europe Cancer Immunotherapy Industry Volume (K Unit) Forecast, by Application 2019 & 2032
- Table 33: Global Cancer Immunotherapy Industry Revenue Million Forecast, by Country 2019 & 2032
- Table 34: Global Cancer Immunotherapy Industry Volume K Unit Forecast, by Country 2019 & 2032
- Table 35: China Cancer Immunotherapy Industry Revenue (Million) Forecast, by Application 2019 & 2032
- Table 36: China Cancer Immunotherapy Industry Volume (K Unit) Forecast, by Application 2019 & 2032
- Table 37: Japan Cancer Immunotherapy Industry Revenue (Million) Forecast, by Application 2019 & 2032
- Table 38: Japan Cancer Immunotherapy Industry Volume (K Unit) Forecast, by Application 2019 & 2032
- Table 39: India Cancer Immunotherapy Industry Revenue (Million) Forecast, by Application 2019 & 2032
- Table 40: India Cancer Immunotherapy Industry Volume (K Unit) Forecast, by Application 2019 & 2032
- Table 41: Australia Cancer Immunotherapy Industry Revenue (Million) Forecast, by Application 2019 & 2032
- Table 42: Australia Cancer Immunotherapy Industry Volume (K Unit) Forecast, by Application 2019 & 2032
- Table 43: South Korea Cancer Immunotherapy Industry Revenue (Million) Forecast, by Application 2019 & 2032
- Table 44: South Korea Cancer Immunotherapy Industry Volume (K Unit) Forecast, by Application 2019 & 2032
- Table 45: Rest of Asia Pacific Cancer Immunotherapy Industry Revenue (Million) Forecast, by Application 2019 & 2032
- Table 46: Rest of Asia Pacific Cancer Immunotherapy Industry Volume (K Unit) Forecast, by Application 2019 & 2032
- Table 47: Global Cancer Immunotherapy Industry Revenue Million Forecast, by Country 2019 & 2032
- Table 48: Global Cancer Immunotherapy Industry Volume K Unit Forecast, by Country 2019 & 2032
- Table 49: GCC Cancer Immunotherapy Industry Revenue (Million) Forecast, by Application 2019 & 2032
- Table 50: GCC Cancer Immunotherapy Industry Volume (K Unit) Forecast, by Application 2019 & 2032
- Table 51: South Africa Cancer Immunotherapy Industry Revenue (Million) Forecast, by Application 2019 & 2032
- Table 52: South Africa Cancer Immunotherapy Industry Volume (K Unit) Forecast, by Application 2019 & 2032
- Table 53: Rest of Middle East and Africa Cancer Immunotherapy Industry Revenue (Million) Forecast, by Application 2019 & 2032
- Table 54: Rest of Middle East and Africa Cancer Immunotherapy Industry Volume (K Unit) Forecast, by Application 2019 & 2032
- Table 55: Global Cancer Immunotherapy Industry Revenue Million Forecast, by Country 2019 & 2032
- Table 56: Global Cancer Immunotherapy Industry Volume K Unit Forecast, by Country 2019 & 2032
- Table 57: Brazil Cancer Immunotherapy Industry Revenue (Million) Forecast, by Application 2019 & 2032
- Table 58: Brazil Cancer Immunotherapy Industry Volume (K Unit) Forecast, by Application 2019 & 2032
- Table 59: Argentina Cancer Immunotherapy Industry Revenue (Million) Forecast, by Application 2019 & 2032
- Table 60: Argentina Cancer Immunotherapy Industry Volume (K Unit) Forecast, by Application 2019 & 2032
- Table 61: Rest of South America Cancer Immunotherapy Industry Revenue (Million) Forecast, by Application 2019 & 2032
- Table 62: Rest of South America Cancer Immunotherapy Industry Volume (K Unit) Forecast, by Application 2019 & 2032
- Table 63: Global Cancer Immunotherapy Industry Revenue Million Forecast, by Therapy Type 2019 & 2032
- Table 64: Global Cancer Immunotherapy Industry Volume K Unit Forecast, by Therapy Type 2019 & 2032
- Table 65: Global Cancer Immunotherapy Industry Revenue Million Forecast, by Application 2019 & 2032
- Table 66: Global Cancer Immunotherapy Industry Volume K Unit Forecast, by Application 2019 & 2032
- Table 67: Global Cancer Immunotherapy Industry Revenue Million Forecast, by End Users 2019 & 2032
- Table 68: Global Cancer Immunotherapy Industry Volume K Unit Forecast, by End Users 2019 & 2032
- Table 69: Global Cancer Immunotherapy Industry Revenue Million Forecast, by Country 2019 & 2032
- Table 70: Global Cancer Immunotherapy Industry Volume K Unit Forecast, by Country 2019 & 2032
- Table 71: United States Cancer Immunotherapy Industry Revenue (Million) Forecast, by Application 2019 & 2032
- Table 72: United States Cancer Immunotherapy Industry Volume (K Unit) Forecast, by Application 2019 & 2032
- Table 73: Canada Cancer Immunotherapy Industry Revenue (Million) Forecast, by Application 2019 & 2032
- Table 74: Canada Cancer Immunotherapy Industry Volume (K Unit) Forecast, by Application 2019 & 2032
- Table 75: Mexico Cancer Immunotherapy Industry Revenue (Million) Forecast, by Application 2019 & 2032
- Table 76: Mexico Cancer Immunotherapy Industry Volume (K Unit) Forecast, by Application 2019 & 2032
- Table 77: Global Cancer Immunotherapy Industry Revenue Million Forecast, by Therapy Type 2019 & 2032
- Table 78: Global Cancer Immunotherapy Industry Volume K Unit Forecast, by Therapy Type 2019 & 2032
- Table 79: Global Cancer Immunotherapy Industry Revenue Million Forecast, by Application 2019 & 2032
- Table 80: Global Cancer Immunotherapy Industry Volume K Unit Forecast, by Application 2019 & 2032
- Table 81: Global Cancer Immunotherapy Industry Revenue Million Forecast, by End Users 2019 & 2032
- Table 82: Global Cancer Immunotherapy Industry Volume K Unit Forecast, by End Users 2019 & 2032
- Table 83: Global Cancer Immunotherapy Industry Revenue Million Forecast, by Country 2019 & 2032
- Table 84: Global Cancer Immunotherapy Industry Volume K Unit Forecast, by Country 2019 & 2032
- Table 85: Germany Cancer Immunotherapy Industry Revenue (Million) Forecast, by Application 2019 & 2032
- Table 86: Germany Cancer Immunotherapy Industry Volume (K Unit) Forecast, by Application 2019 & 2032
- Table 87: United Kingdom Cancer Immunotherapy Industry Revenue (Million) Forecast, by Application 2019 & 2032
- Table 88: United Kingdom Cancer Immunotherapy Industry Volume (K Unit) Forecast, by Application 2019 & 2032
- Table 89: France Cancer Immunotherapy Industry Revenue (Million) Forecast, by Application 2019 & 2032
- Table 90: France Cancer Immunotherapy Industry Volume (K Unit) Forecast, by Application 2019 & 2032
- Table 91: Italy Cancer Immunotherapy Industry Revenue (Million) Forecast, by Application 2019 & 2032
- Table 92: Italy Cancer Immunotherapy Industry Volume (K Unit) Forecast, by Application 2019 & 2032
- Table 93: Spain Cancer Immunotherapy Industry Revenue (Million) Forecast, by Application 2019 & 2032
- Table 94: Spain Cancer Immunotherapy Industry Volume (K Unit) Forecast, by Application 2019 & 2032
- Table 95: Rest of Europe Cancer Immunotherapy Industry Revenue (Million) Forecast, by Application 2019 & 2032
- Table 96: Rest of Europe Cancer Immunotherapy Industry Volume (K Unit) Forecast, by Application 2019 & 2032
- Table 97: Global Cancer Immunotherapy Industry Revenue Million Forecast, by Therapy Type 2019 & 2032
- Table 98: Global Cancer Immunotherapy Industry Volume K Unit Forecast, by Therapy Type 2019 & 2032
- Table 99: Global Cancer Immunotherapy Industry Revenue Million Forecast, by Application 2019 & 2032
- Table 100: Global Cancer Immunotherapy Industry Volume K Unit Forecast, by Application 2019 & 2032
- Table 101: Global Cancer Immunotherapy Industry Revenue Million Forecast, by End Users 2019 & 2032
- Table 102: Global Cancer Immunotherapy Industry Volume K Unit Forecast, by End Users 2019 & 2032
- Table 103: Global Cancer Immunotherapy Industry Revenue Million Forecast, by Country 2019 & 2032
- Table 104: Global Cancer Immunotherapy Industry Volume K Unit Forecast, by Country 2019 & 2032
- Table 105: China Cancer Immunotherapy Industry Revenue (Million) Forecast, by Application 2019 & 2032
- Table 106: China Cancer Immunotherapy Industry Volume (K Unit) Forecast, by Application 2019 & 2032
- Table 107: Japan Cancer Immunotherapy Industry Revenue (Million) Forecast, by Application 2019 & 2032
- Table 108: Japan Cancer Immunotherapy Industry Volume (K Unit) Forecast, by Application 2019 & 2032
- Table 109: India Cancer Immunotherapy Industry Revenue (Million) Forecast, by Application 2019 & 2032
- Table 110: India Cancer Immunotherapy Industry Volume (K Unit) Forecast, by Application 2019 & 2032
- Table 111: Australia Cancer Immunotherapy Industry Revenue (Million) Forecast, by Application 2019 & 2032
- Table 112: Australia Cancer Immunotherapy Industry Volume (K Unit) Forecast, by Application 2019 & 2032
- Table 113: South Korea Cancer Immunotherapy Industry Revenue (Million) Forecast, by Application 2019 & 2032
- Table 114: South Korea Cancer Immunotherapy Industry Volume (K Unit) Forecast, by Application 2019 & 2032
- Table 115: Rest of Asia Pacific Cancer Immunotherapy Industry Revenue (Million) Forecast, by Application 2019 & 2032
- Table 116: Rest of Asia Pacific Cancer Immunotherapy Industry Volume (K Unit) Forecast, by Application 2019 & 2032
- Table 117: Global Cancer Immunotherapy Industry Revenue Million Forecast, by Therapy Type 2019 & 2032
- Table 118: Global Cancer Immunotherapy Industry Volume K Unit Forecast, by Therapy Type 2019 & 2032
- Table 119: Global Cancer Immunotherapy Industry Revenue Million Forecast, by Application 2019 & 2032
- Table 120: Global Cancer Immunotherapy Industry Volume K Unit Forecast, by Application 2019 & 2032
- Table 121: Global Cancer Immunotherapy Industry Revenue Million Forecast, by End Users 2019 & 2032
- Table 122: Global Cancer Immunotherapy Industry Volume K Unit Forecast, by End Users 2019 & 2032
- Table 123: Global Cancer Immunotherapy Industry Revenue Million Forecast, by Country 2019 & 2032
- Table 124: Global Cancer Immunotherapy Industry Volume K Unit Forecast, by Country 2019 & 2032
- Table 125: GCC Cancer Immunotherapy Industry Revenue (Million) Forecast, by Application 2019 & 2032
- Table 126: GCC Cancer Immunotherapy Industry Volume (K Unit) Forecast, by Application 2019 & 2032
- Table 127: South Africa Cancer Immunotherapy Industry Revenue (Million) Forecast, by Application 2019 & 2032
- Table 128: South Africa Cancer Immunotherapy Industry Volume (K Unit) Forecast, by Application 2019 & 2032
- Table 129: Rest of Middle East and Africa Cancer Immunotherapy Industry Revenue (Million) Forecast, by Application 2019 & 2032
- Table 130: Rest of Middle East and Africa Cancer Immunotherapy Industry Volume (K Unit) Forecast, by Application 2019 & 2032
- Table 131: Global Cancer Immunotherapy Industry Revenue Million Forecast, by Therapy Type 2019 & 2032
- Table 132: Global Cancer Immunotherapy Industry Volume K Unit Forecast, by Therapy Type 2019 & 2032
- Table 133: Global Cancer Immunotherapy Industry Revenue Million Forecast, by Application 2019 & 2032
- Table 134: Global Cancer Immunotherapy Industry Volume K Unit Forecast, by Application 2019 & 2032
- Table 135: Global Cancer Immunotherapy Industry Revenue Million Forecast, by End Users 2019 & 2032
- Table 136: Global Cancer Immunotherapy Industry Volume K Unit Forecast, by End Users 2019 & 2032
- Table 137: Global Cancer Immunotherapy Industry Revenue Million Forecast, by Country 2019 & 2032
- Table 138: Global Cancer Immunotherapy Industry Volume K Unit Forecast, by Country 2019 & 2032
- Table 139: Brazil Cancer Immunotherapy Industry Revenue (Million) Forecast, by Application 2019 & 2032
- Table 140: Brazil Cancer Immunotherapy Industry Volume (K Unit) Forecast, by Application 2019 & 2032
- Table 141: Argentina Cancer Immunotherapy Industry Revenue (Million) Forecast, by Application 2019 & 2032
- Table 142: Argentina Cancer Immunotherapy Industry Volume (K Unit) Forecast, by Application 2019 & 2032
- Table 143: Rest of South America Cancer Immunotherapy Industry Revenue (Million) Forecast, by Application 2019 & 2032
- Table 144: Rest of South America Cancer Immunotherapy Industry Volume (K Unit) Forecast, by Application 2019 & 2032
Frequently Asked Questions
1. What is the projected Compound Annual Growth Rate (CAGR) of the Cancer Immunotherapy Industry?
The projected CAGR is approximately 9.10%.
2. Which companies are prominent players in the Cancer Immunotherapy Industry?
Key companies in the market include Bayer AG, Novartis AG, Astellas Pharma Inc, Amgen Inc, Gilead Sciences, OSE Immunotherapeutics, Seattle Genetics Inc, AstraZeneca PLC, Eli Lilly and Company, Bristol-Myers Squibb, Merck and Co Inc, GlaxoSmithKline PLC, F Hoffman La Roche Ltd, Pfizer Inc.
3. What are the main segments of the Cancer Immunotherapy Industry?
The market segments include Therapy Type, Application, End Users.
4. Can you provide details about the market size?
The market size is estimated to be USD XX Million as of 2022.
5. What are some drivers contributing to market growth?
Rising R&D Activities; Increasing Effectivity and Accuracy Of Newer Therapies; Growing Prevalence of Cancer.
6. What are the notable trends driving market growth?
Breast Cancer Segment Expected to Hold a Major Share in the Cancer Immunotherapy Market.
7. Are there any restraints impacting market growth?
High Cost Coupled with Expensive Development; Stringent Regulatory Factors.
8. Can you provide examples of recent developments in the market?
N/A
9. What pricing options are available for accessing the report?
Pricing options include single-user, multi-user, and enterprise licenses priced at USD 4750, USD 5250, and USD 8750 respectively.
10. Is the market size provided in terms of value or volume?
The market size is provided in terms of value, measured in Million and volume, measured in K Unit.
11. Are there any specific market keywords associated with the report?
Yes, the market keyword associated with the report is "Cancer Immunotherapy Industry," which aids in identifying and referencing the specific market segment covered.
12. How do I determine which pricing option suits my needs best?
The pricing options vary based on user requirements and access needs. Individual users may opt for single-user licenses, while businesses requiring broader access may choose multi-user or enterprise licenses for cost-effective access to the report.
13. Are there any additional resources or data provided in the Cancer Immunotherapy Industry report?
While the report offers comprehensive insights, it's advisable to review the specific contents or supplementary materials provided to ascertain if additional resources or data are available.
14. How can I stay updated on further developments or reports in the Cancer Immunotherapy Industry?
To stay informed about further developments, trends, and reports in the Cancer Immunotherapy Industry, consider subscribing to industry newsletters, following relevant companies and organizations, or regularly checking reputable industry news sources and publications.
Methodology
Step 1 - Identification of Relevant Samples Size from Population Database


Step 2 - Approaches for Defining Global Market Size (Value, Volume* & Price*)

Note*: In applicable scenarios
Step 3 - Data Sources
Primary Research
- Web Analytics
- Survey Reports
- Research Institute
- Latest Research Reports
- Opinion Leaders
Secondary Research
- Annual Reports
- White Paper
- Latest Press Release
- Industry Association
- Paid Database
- Investor Presentations

Step 4 - Data Triangulation
Involves using different sources of information in order to increase the validity of a study
These sources are likely to be stakeholders in a program - participants, other researchers, program staff, other community members, and so on.
Then we put all data in single framework & apply various statistical tools to find out the dynamic on the market.
During the analysis stage, feedback from the stakeholder groups would be compared to determine areas of agreement as well as areas of divergence
