

Key Insights
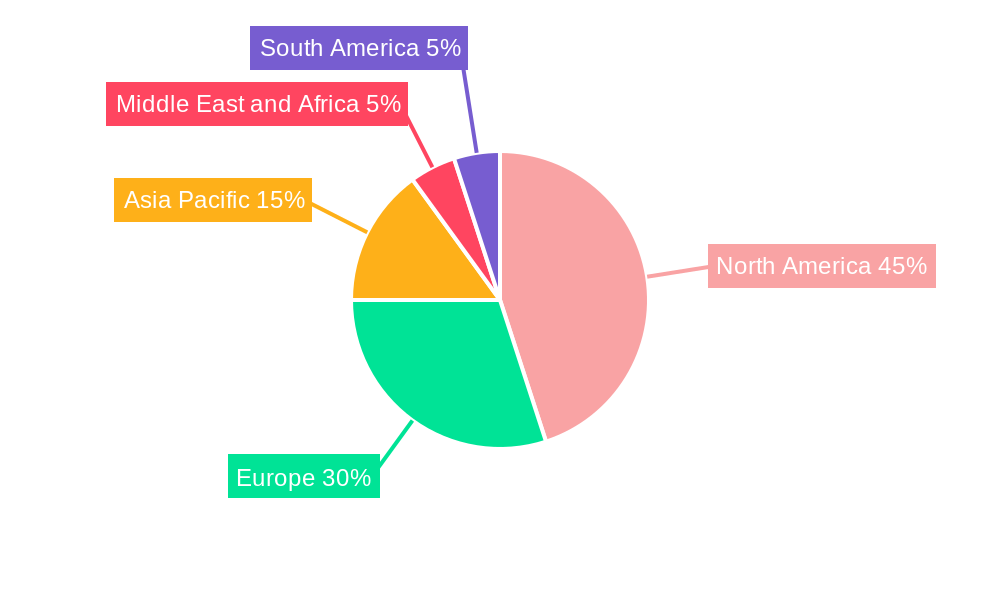
The global brain tumor therapeutics market is experiencing robust growth, projected to reach a substantial size by 2033. Driven by increasing prevalence of brain cancers like glioblastoma, meningioma, and pituitary tumors, coupled with advancements in therapeutic approaches, this market is poised for significant expansion. The rising geriatric population, a key risk factor for brain tumors, further fuels market growth. Innovative therapies such as immunotherapy and gene therapy are gaining traction, offering hope for improved patient outcomes and driving market expansion. While challenges remain, including the inherent complexities of treating brain tumors and high treatment costs, the ongoing research and development efforts within pharmaceutical companies like Bayer AG, Novartis AG, and Amgen Inc., among others, are contributing to a steady stream of novel treatment options. The market segmentation by therapy type reveals a strong emphasis on the development and adoption of targeted therapies, reflecting the industry's focus on personalized medicine. The regional analysis suggests North America and Europe currently hold significant market shares, owing to advanced healthcare infrastructure and high research activity; however, the Asia Pacific region is expected to witness substantial growth in the coming years due to increasing healthcare expenditure and rising awareness about brain cancer.
The competitive landscape is characterized by a mix of established pharmaceutical giants and emerging biotech companies vying for market dominance. Strategic collaborations, mergers, and acquisitions are likely to shape the competitive dynamics in the years to come. The market's future trajectory will depend on several factors, including the success of ongoing clinical trials for new therapies, regulatory approvals, pricing strategies, and the evolving healthcare landscape globally. Despite challenges, the continued investment in research and development, along with a growing demand for effective brain tumor treatments, promises considerable future growth for this crucial market sector. A focus on personalized medicine and improved diagnostic tools is expected to further refine treatment strategies and enhance market prospects.
Brain Tumor Therapeutics Market: A Comprehensive Report (2019-2033)
This comprehensive report provides a detailed analysis of the Brain Tumor Therapeutics Market, offering invaluable insights for stakeholders across the pharmaceutical, biotech, and investment sectors. With a focus on market dynamics, leading players, and future trends, this report is an essential resource for strategic decision-making. The study period spans from 2019 to 2033, with 2025 serving as the base and estimated year. The forecast period is 2025-2033, and the historical period covers 2019-2024. The market size is projected to reach xx Million by 2033.
Brain Tumor Therapeutics Market Market Dynamics & Concentration
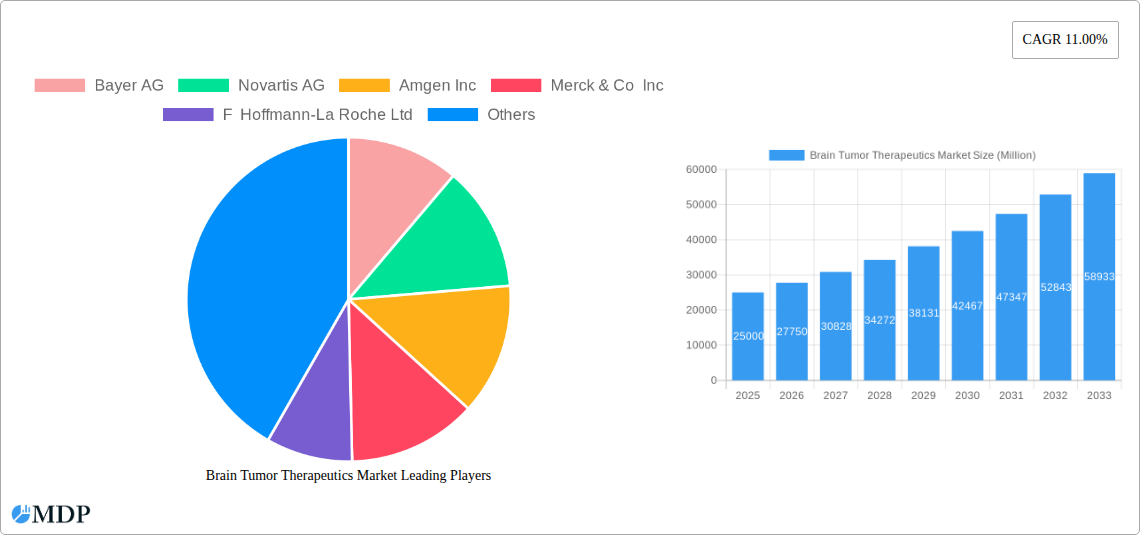
The Brain Tumor Therapeutics market is characterized by a moderately concentrated landscape, with key players such as Bayer AG, Novartis AG, Amgen Inc, Merck & Co Inc, F Hoffmann-La Roche Ltd, AstraZeneca PLC, Pfizer Inc, GSK plc, Johnson & Johnson, Eisai Co Ltd, and Bristol-Myers Squibb Company holding significant market share. Market concentration is influenced by factors such as robust R&D investment, strategic partnerships, and the complexities involved in developing effective brain tumor therapies. The market is witnessing considerable innovation driven by advancements in immunotherapy, gene therapy, and targeted therapies. Regulatory frameworks, including those of the FDA and EMA, play a critical role in shaping market dynamics, influencing drug approvals and clinical trial processes. Product substitutes, such as conventional chemotherapies, present a competitive challenge. End-user trends, including increasing awareness of treatment options and a preference for minimally invasive procedures, are further influencing market growth. The market has observed a moderate number of M&A activities in recent years, reflecting the strategic importance of this sector.
- Market Share: The top 5 players collectively hold approximately xx% of the market share (2025).
- M&A Deal Count: An estimated xx M&A deals were recorded between 2019 and 2024.
- Innovation Drivers: Advancements in immunotherapy, gene therapy, and targeted therapies are key drivers of market growth.
- Regulatory Landscape: Stringent regulatory approvals influence market entry and expansion.
Brain Tumor Therapeutics Market Industry Trends & Analysis
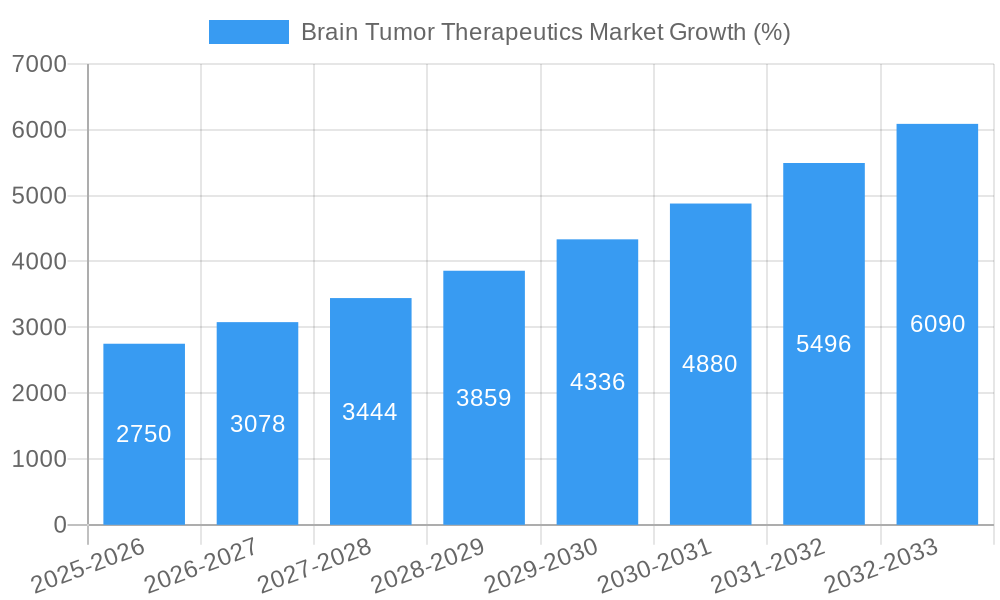
The Brain Tumor Therapeutics market exhibits a promising growth trajectory, fueled by several key factors. The increasing incidence of brain tumors globally, coupled with advancements in diagnostic technologies, is a primary driver. Technological disruptions, particularly in the fields of personalized medicine and targeted therapies, are significantly impacting market growth. Consumer preferences are shifting towards less invasive treatment options with improved efficacy and reduced side effects. Competitive dynamics are intense, with companies vying for market share through R&D investments, strategic partnerships, and product launches. The market is expected to witness a Compound Annual Growth Rate (CAGR) of xx% during the forecast period (2025-2033). Market penetration of novel therapies is gradually increasing, especially in the advanced stages of brain cancer.
Leading Markets & Segments in Brain Tumor Therapeutics Market
The Glioblastoma segment currently dominates the Type of Brain Cancer market due to its high prevalence and aggressive nature. Within therapies, Immunotherapy and Targeted Therapy show strong growth, driven by their potential for improved efficacy and targeted action. Geographically, North America holds the largest market share due to high healthcare expenditure and robust research infrastructure.
- Key Drivers for North America: High healthcare expenditure, advanced healthcare infrastructure, and a large patient population.
- Key Drivers for Europe: Rising healthcare expenditure, well-established regulatory frameworks, and increasing adoption of innovative therapies.
- Key Drivers for Asia Pacific: Growing awareness of treatment options, a rising patient pool, and increasing investments in healthcare infrastructure.
- Dominant Segment (Type of Brain Cancer): Glioblastoma
- Dominant Segment (Therapy): Immunotherapy
Brain Tumor Therapeutics Market Product Developments
Recent advancements focus on targeted therapies, including novel small-molecule inhibitors and antibody-drug conjugates (ADCs), designed to improve efficacy and minimize adverse effects. Gene therapies are also emerging as promising treatment options, offering potential for long-term disease control. These advancements are driven by improved understanding of tumor biology and the development of innovative drug delivery systems. The market is witnessing a trend towards personalized medicine, tailoring treatment plans based on individual genetic profiles.
Key Drivers of Brain Tumor Therapeutics Market Growth
The market is fueled by several key drivers, including:
- Technological advancements: Development of innovative therapies such as immunotherapy and gene therapy.
- Rising prevalence of brain tumors: The increasing incidence of brain tumors globally is driving demand.
- Favorable regulatory environment: Regulatory approvals for novel therapies are accelerating market growth.
Challenges in the Brain Tumor Therapeutics Market Market
The market faces certain challenges:
- High cost of therapies: The expense of novel therapies presents a barrier to widespread access.
- Complex regulatory pathways: Stringent regulatory processes can delay market entry for new treatments.
- Drug resistance: Tumor resistance to existing therapies remains a major obstacle. This results in xx Million lost revenue annually (estimated).
Emerging Opportunities in Brain Tumor Therapeutics Market
Significant opportunities exist in the market, particularly in personalized medicine, where treatment plans are tailored to individual patient profiles. Strategic partnerships between pharmaceutical companies and academic institutions are fostering innovation. Expansion into emerging markets with growing healthcare infrastructure presents a further avenue for growth.
Leading Players in the Brain Tumor Therapeutics Market Sector
- Bayer AG
- Novartis AG
- Amgen Inc
- Merck & Co Inc
- F Hoffmann-La Roche Ltd
- AstraZeneca PLC
- Pfizer Inc
- GSK plc
- Johnson & Johnson
- Eisai Co Ltd
- Bristol-Myers Squibb Company
Key Milestones in Brain Tumor Therapeutics Market Industry
- June 2023: Erasca, Inc. receives FDA Orphan Drug Designation for ERAS-801, a novel EGFR inhibitor for glioblastoma. This signifies potential for expedited regulatory approval and market entry.
- January 2023: Stanford University and Invus Group collaborate to develop new glioblastoma treatments, highlighting the ongoing investment in R&D.
Strategic Outlook for Brain Tumor Therapeutics Market Market
The Brain Tumor Therapeutics market holds significant future potential, driven by continuous innovation and increasing investment in R&D. Strategic partnerships, focused on personalized medicine and advanced therapies, will play a crucial role in shaping market growth. Expansion into emerging markets and the development of more effective and accessible treatment options are key factors to enhance market prospects.
Brain Tumor Therapeutics Market Segmentation
-
1. Type of Brain Cancer
- 1.1. Glioblastoma
- 1.2. Meningioma
- 1.3. Pituitary Tumors
- 1.4. Other Types of Brain Cancer
-
2. Therapy
- 2.1. Chemotherapy
- 2.2. Immunotherapy
- 2.3. Gene Therapy
- 2.4. Other Therapies
Brain Tumor Therapeutics Market Segmentation By Geography
-
1. North America
- 1.1. United States
- 1.2. Canada
- 1.3. Mexico
-
2. Europe
- 2.1. Germany
- 2.2. United Kingdom
- 2.3. France
- 2.4. Italy
- 2.5. Spain
- 2.6. Rest of Europe
-
3. Asia Pacific
- 3.1. China
- 3.2. Japan
- 3.3. India
- 3.4. Australia
- 3.5. South Korea
- 3.6. Rest of Asia Pacific
-
4. Middle East and Africa
- 4.1. GCC
- 4.2. South Africa
- 4.3. Rest of Middle East and Africa
-
5. South America
- 5.1. Brazil
- 5.2. Argentina
- 5.3. Rest of South America
Brain Tumor Therapeutics Market REPORT HIGHLIGHTS
| Aspects | Details |
|---|---|
| Study Period | 2019-2033 |
| Base Year | 2024 |
| Estimated Year | 2025 |
| Forecast Period | 2025-2033 |
| Historical Period | 2019-2024 |
| Growth Rate | CAGR of 11.00% from 2019-2033 |
| Segmentation |
|
Table of Contents
- 1. Introduction
- 1.1. Research Scope
- 1.2. Market Segmentation
- 1.3. Research Methodology
- 1.4. Definitions and Assumptions
- 2. Executive Summary
- 2.1. Introduction
- 3. Market Dynamics
- 3.1. Introduction
- 3.2. Market Drivers
- 3.2.1. Rising Incidence of Brain Tumor; Strong R&D Initiatives from Key Players; Increasing Government Initiatives for Cancer Awareness
- 3.3. Market Restrains
- 3.3.1. High Cost of Cancer Therapies
- 3.4. Market Trends
- 3.4.1. The Immunotherapy Segment is Expected to Register Robust Growth in the Brain Tumor Therapeutics Market Over the Forecast Period
- 4. Market Factor Analysis
- 4.1. Porters Five Forces
- 4.2. Supply/Value Chain
- 4.3. PESTEL analysis
- 4.4. Market Entropy
- 4.5. Patent/Trademark Analysis
- 5. Global Brain Tumor Therapeutics Market Analysis, Insights and Forecast, 2019-2031
- 5.1. Market Analysis, Insights and Forecast - by Type of Brain Cancer
- 5.1.1. Glioblastoma
- 5.1.2. Meningioma
- 5.1.3. Pituitary Tumors
- 5.1.4. Other Types of Brain Cancer
- 5.2. Market Analysis, Insights and Forecast - by Therapy
- 5.2.1. Chemotherapy
- 5.2.2. Immunotherapy
- 5.2.3. Gene Therapy
- 5.2.4. Other Therapies
- 5.3. Market Analysis, Insights and Forecast - by Region
- 5.3.1. North America
- 5.3.2. Europe
- 5.3.3. Asia Pacific
- 5.3.4. Middle East and Africa
- 5.3.5. South America
- 5.1. Market Analysis, Insights and Forecast - by Type of Brain Cancer
- 6. North America Brain Tumor Therapeutics Market Analysis, Insights and Forecast, 2019-2031
- 6.1. Market Analysis, Insights and Forecast - by Type of Brain Cancer
- 6.1.1. Glioblastoma
- 6.1.2. Meningioma
- 6.1.3. Pituitary Tumors
- 6.1.4. Other Types of Brain Cancer
- 6.2. Market Analysis, Insights and Forecast - by Therapy
- 6.2.1. Chemotherapy
- 6.2.2. Immunotherapy
- 6.2.3. Gene Therapy
- 6.2.4. Other Therapies
- 6.1. Market Analysis, Insights and Forecast - by Type of Brain Cancer
- 7. Europe Brain Tumor Therapeutics Market Analysis, Insights and Forecast, 2019-2031
- 7.1. Market Analysis, Insights and Forecast - by Type of Brain Cancer
- 7.1.1. Glioblastoma
- 7.1.2. Meningioma
- 7.1.3. Pituitary Tumors
- 7.1.4. Other Types of Brain Cancer
- 7.2. Market Analysis, Insights and Forecast - by Therapy
- 7.2.1. Chemotherapy
- 7.2.2. Immunotherapy
- 7.2.3. Gene Therapy
- 7.2.4. Other Therapies
- 7.1. Market Analysis, Insights and Forecast - by Type of Brain Cancer
- 8. Asia Pacific Brain Tumor Therapeutics Market Analysis, Insights and Forecast, 2019-2031
- 8.1. Market Analysis, Insights and Forecast - by Type of Brain Cancer
- 8.1.1. Glioblastoma
- 8.1.2. Meningioma
- 8.1.3. Pituitary Tumors
- 8.1.4. Other Types of Brain Cancer
- 8.2. Market Analysis, Insights and Forecast - by Therapy
- 8.2.1. Chemotherapy
- 8.2.2. Immunotherapy
- 8.2.3. Gene Therapy
- 8.2.4. Other Therapies
- 8.1. Market Analysis, Insights and Forecast - by Type of Brain Cancer
- 9. Middle East and Africa Brain Tumor Therapeutics Market Analysis, Insights and Forecast, 2019-2031
- 9.1. Market Analysis, Insights and Forecast - by Type of Brain Cancer
- 9.1.1. Glioblastoma
- 9.1.2. Meningioma
- 9.1.3. Pituitary Tumors
- 9.1.4. Other Types of Brain Cancer
- 9.2. Market Analysis, Insights and Forecast - by Therapy
- 9.2.1. Chemotherapy
- 9.2.2. Immunotherapy
- 9.2.3. Gene Therapy
- 9.2.4. Other Therapies
- 9.1. Market Analysis, Insights and Forecast - by Type of Brain Cancer
- 10. South America Brain Tumor Therapeutics Market Analysis, Insights and Forecast, 2019-2031
- 10.1. Market Analysis, Insights and Forecast - by Type of Brain Cancer
- 10.1.1. Glioblastoma
- 10.1.2. Meningioma
- 10.1.3. Pituitary Tumors
- 10.1.4. Other Types of Brain Cancer
- 10.2. Market Analysis, Insights and Forecast - by Therapy
- 10.2.1. Chemotherapy
- 10.2.2. Immunotherapy
- 10.2.3. Gene Therapy
- 10.2.4. Other Therapies
- 10.1. Market Analysis, Insights and Forecast - by Type of Brain Cancer
- 11. North America Brain Tumor Therapeutics Market Analysis, Insights and Forecast, 2019-2031
- 11.1. Market Analysis, Insights and Forecast - By Country/Sub-region
- 11.1.1 United States
- 11.1.2 Canada
- 11.1.3 Mexico
- 12. Europe Brain Tumor Therapeutics Market Analysis, Insights and Forecast, 2019-2031
- 12.1. Market Analysis, Insights and Forecast - By Country/Sub-region
- 12.1.1 Germany
- 12.1.2 United Kingdom
- 12.1.3 France
- 12.1.4 Italy
- 12.1.5 Spain
- 12.1.6 Rest of Europe
- 13. Asia Pacific Brain Tumor Therapeutics Market Analysis, Insights and Forecast, 2019-2031
- 13.1. Market Analysis, Insights and Forecast - By Country/Sub-region
- 13.1.1 China
- 13.1.2 Japan
- 13.1.3 India
- 13.1.4 Australia
- 13.1.5 South Korea
- 13.1.6 Rest of Asia Pacific
- 14. Middle East and Africa Brain Tumor Therapeutics Market Analysis, Insights and Forecast, 2019-2031
- 14.1. Market Analysis, Insights and Forecast - By Country/Sub-region
- 14.1.1 GCC
- 14.1.2 South Africa
- 14.1.3 Rest of Middle East and Africa
- 15. South America Brain Tumor Therapeutics Market Analysis, Insights and Forecast, 2019-2031
- 15.1. Market Analysis, Insights and Forecast - By Country/Sub-region
- 15.1.1 Brazil
- 15.1.2 Argentina
- 15.1.3 Rest of South America
- 16. Competitive Analysis
- 16.1. Global Market Share Analysis 2024
- 16.2. Company Profiles
- 16.2.1 Bayer AG
- 16.2.1.1. Overview
- 16.2.1.2. Products
- 16.2.1.3. SWOT Analysis
- 16.2.1.4. Recent Developments
- 16.2.1.5. Financials (Based on Availability)
- 16.2.2 Novartis AG
- 16.2.2.1. Overview
- 16.2.2.2. Products
- 16.2.2.3. SWOT Analysis
- 16.2.2.4. Recent Developments
- 16.2.2.5. Financials (Based on Availability)
- 16.2.3 Amgen Inc
- 16.2.3.1. Overview
- 16.2.3.2. Products
- 16.2.3.3. SWOT Analysis
- 16.2.3.4. Recent Developments
- 16.2.3.5. Financials (Based on Availability)
- 16.2.4 Merck & Co Inc
- 16.2.4.1. Overview
- 16.2.4.2. Products
- 16.2.4.3. SWOT Analysis
- 16.2.4.4. Recent Developments
- 16.2.4.5. Financials (Based on Availability)
- 16.2.5 F Hoffmann-La Roche Ltd
- 16.2.5.1. Overview
- 16.2.5.2. Products
- 16.2.5.3. SWOT Analysis
- 16.2.5.4. Recent Developments
- 16.2.5.5. Financials (Based on Availability)
- 16.2.6 AstraZeneca PLC
- 16.2.6.1. Overview
- 16.2.6.2. Products
- 16.2.6.3. SWOT Analysis
- 16.2.6.4. Recent Developments
- 16.2.6.5. Financials (Based on Availability)
- 16.2.7 Pfizer Inc
- 16.2.7.1. Overview
- 16.2.7.2. Products
- 16.2.7.3. SWOT Analysis
- 16.2.7.4. Recent Developments
- 16.2.7.5. Financials (Based on Availability)
- 16.2.8 GSK plc
- 16.2.8.1. Overview
- 16.2.8.2. Products
- 16.2.8.3. SWOT Analysis
- 16.2.8.4. Recent Developments
- 16.2.8.5. Financials (Based on Availability)
- 16.2.9 Johnson & Johnson
- 16.2.9.1. Overview
- 16.2.9.2. Products
- 16.2.9.3. SWOT Analysis
- 16.2.9.4. Recent Developments
- 16.2.9.5. Financials (Based on Availability)
- 16.2.10 Eisai Co Ltd
- 16.2.10.1. Overview
- 16.2.10.2. Products
- 16.2.10.3. SWOT Analysis
- 16.2.10.4. Recent Developments
- 16.2.10.5. Financials (Based on Availability)
- 16.2.11 Bristol-Myers Squibb Company
- 16.2.11.1. Overview
- 16.2.11.2. Products
- 16.2.11.3. SWOT Analysis
- 16.2.11.4. Recent Developments
- 16.2.11.5. Financials (Based on Availability)
- 16.2.1 Bayer AG
List of Figures
- Figure 1: Global Brain Tumor Therapeutics Market Revenue Breakdown (Million, %) by Region 2024 & 2032
- Figure 2: Global Brain Tumor Therapeutics Market Volume Breakdown (K Unit, %) by Region 2024 & 2032
- Figure 3: North America Brain Tumor Therapeutics Market Revenue (Million), by Country 2024 & 2032
- Figure 4: North America Brain Tumor Therapeutics Market Volume (K Unit), by Country 2024 & 2032
- Figure 5: North America Brain Tumor Therapeutics Market Revenue Share (%), by Country 2024 & 2032
- Figure 6: North America Brain Tumor Therapeutics Market Volume Share (%), by Country 2024 & 2032
- Figure 7: Europe Brain Tumor Therapeutics Market Revenue (Million), by Country 2024 & 2032
- Figure 8: Europe Brain Tumor Therapeutics Market Volume (K Unit), by Country 2024 & 2032
- Figure 9: Europe Brain Tumor Therapeutics Market Revenue Share (%), by Country 2024 & 2032
- Figure 10: Europe Brain Tumor Therapeutics Market Volume Share (%), by Country 2024 & 2032
- Figure 11: Asia Pacific Brain Tumor Therapeutics Market Revenue (Million), by Country 2024 & 2032
- Figure 12: Asia Pacific Brain Tumor Therapeutics Market Volume (K Unit), by Country 2024 & 2032
- Figure 13: Asia Pacific Brain Tumor Therapeutics Market Revenue Share (%), by Country 2024 & 2032
- Figure 14: Asia Pacific Brain Tumor Therapeutics Market Volume Share (%), by Country 2024 & 2032
- Figure 15: Middle East and Africa Brain Tumor Therapeutics Market Revenue (Million), by Country 2024 & 2032
- Figure 16: Middle East and Africa Brain Tumor Therapeutics Market Volume (K Unit), by Country 2024 & 2032
- Figure 17: Middle East and Africa Brain Tumor Therapeutics Market Revenue Share (%), by Country 2024 & 2032
- Figure 18: Middle East and Africa Brain Tumor Therapeutics Market Volume Share (%), by Country 2024 & 2032
- Figure 19: South America Brain Tumor Therapeutics Market Revenue (Million), by Country 2024 & 2032
- Figure 20: South America Brain Tumor Therapeutics Market Volume (K Unit), by Country 2024 & 2032
- Figure 21: South America Brain Tumor Therapeutics Market Revenue Share (%), by Country 2024 & 2032
- Figure 22: South America Brain Tumor Therapeutics Market Volume Share (%), by Country 2024 & 2032
- Figure 23: North America Brain Tumor Therapeutics Market Revenue (Million), by Type of Brain Cancer 2024 & 2032
- Figure 24: North America Brain Tumor Therapeutics Market Volume (K Unit), by Type of Brain Cancer 2024 & 2032
- Figure 25: North America Brain Tumor Therapeutics Market Revenue Share (%), by Type of Brain Cancer 2024 & 2032
- Figure 26: North America Brain Tumor Therapeutics Market Volume Share (%), by Type of Brain Cancer 2024 & 2032
- Figure 27: North America Brain Tumor Therapeutics Market Revenue (Million), by Therapy 2024 & 2032
- Figure 28: North America Brain Tumor Therapeutics Market Volume (K Unit), by Therapy 2024 & 2032
- Figure 29: North America Brain Tumor Therapeutics Market Revenue Share (%), by Therapy 2024 & 2032
- Figure 30: North America Brain Tumor Therapeutics Market Volume Share (%), by Therapy 2024 & 2032
- Figure 31: North America Brain Tumor Therapeutics Market Revenue (Million), by Country 2024 & 2032
- Figure 32: North America Brain Tumor Therapeutics Market Volume (K Unit), by Country 2024 & 2032
- Figure 33: North America Brain Tumor Therapeutics Market Revenue Share (%), by Country 2024 & 2032
- Figure 34: North America Brain Tumor Therapeutics Market Volume Share (%), by Country 2024 & 2032
- Figure 35: Europe Brain Tumor Therapeutics Market Revenue (Million), by Type of Brain Cancer 2024 & 2032
- Figure 36: Europe Brain Tumor Therapeutics Market Volume (K Unit), by Type of Brain Cancer 2024 & 2032
- Figure 37: Europe Brain Tumor Therapeutics Market Revenue Share (%), by Type of Brain Cancer 2024 & 2032
- Figure 38: Europe Brain Tumor Therapeutics Market Volume Share (%), by Type of Brain Cancer 2024 & 2032
- Figure 39: Europe Brain Tumor Therapeutics Market Revenue (Million), by Therapy 2024 & 2032
- Figure 40: Europe Brain Tumor Therapeutics Market Volume (K Unit), by Therapy 2024 & 2032
- Figure 41: Europe Brain Tumor Therapeutics Market Revenue Share (%), by Therapy 2024 & 2032
- Figure 42: Europe Brain Tumor Therapeutics Market Volume Share (%), by Therapy 2024 & 2032
- Figure 43: Europe Brain Tumor Therapeutics Market Revenue (Million), by Country 2024 & 2032
- Figure 44: Europe Brain Tumor Therapeutics Market Volume (K Unit), by Country 2024 & 2032
- Figure 45: Europe Brain Tumor Therapeutics Market Revenue Share (%), by Country 2024 & 2032
- Figure 46: Europe Brain Tumor Therapeutics Market Volume Share (%), by Country 2024 & 2032
- Figure 47: Asia Pacific Brain Tumor Therapeutics Market Revenue (Million), by Type of Brain Cancer 2024 & 2032
- Figure 48: Asia Pacific Brain Tumor Therapeutics Market Volume (K Unit), by Type of Brain Cancer 2024 & 2032
- Figure 49: Asia Pacific Brain Tumor Therapeutics Market Revenue Share (%), by Type of Brain Cancer 2024 & 2032
- Figure 50: Asia Pacific Brain Tumor Therapeutics Market Volume Share (%), by Type of Brain Cancer 2024 & 2032
- Figure 51: Asia Pacific Brain Tumor Therapeutics Market Revenue (Million), by Therapy 2024 & 2032
- Figure 52: Asia Pacific Brain Tumor Therapeutics Market Volume (K Unit), by Therapy 2024 & 2032
- Figure 53: Asia Pacific Brain Tumor Therapeutics Market Revenue Share (%), by Therapy 2024 & 2032
- Figure 54: Asia Pacific Brain Tumor Therapeutics Market Volume Share (%), by Therapy 2024 & 2032
- Figure 55: Asia Pacific Brain Tumor Therapeutics Market Revenue (Million), by Country 2024 & 2032
- Figure 56: Asia Pacific Brain Tumor Therapeutics Market Volume (K Unit), by Country 2024 & 2032
- Figure 57: Asia Pacific Brain Tumor Therapeutics Market Revenue Share (%), by Country 2024 & 2032
- Figure 58: Asia Pacific Brain Tumor Therapeutics Market Volume Share (%), by Country 2024 & 2032
- Figure 59: Middle East and Africa Brain Tumor Therapeutics Market Revenue (Million), by Type of Brain Cancer 2024 & 2032
- Figure 60: Middle East and Africa Brain Tumor Therapeutics Market Volume (K Unit), by Type of Brain Cancer 2024 & 2032
- Figure 61: Middle East and Africa Brain Tumor Therapeutics Market Revenue Share (%), by Type of Brain Cancer 2024 & 2032
- Figure 62: Middle East and Africa Brain Tumor Therapeutics Market Volume Share (%), by Type of Brain Cancer 2024 & 2032
- Figure 63: Middle East and Africa Brain Tumor Therapeutics Market Revenue (Million), by Therapy 2024 & 2032
- Figure 64: Middle East and Africa Brain Tumor Therapeutics Market Volume (K Unit), by Therapy 2024 & 2032
- Figure 65: Middle East and Africa Brain Tumor Therapeutics Market Revenue Share (%), by Therapy 2024 & 2032
- Figure 66: Middle East and Africa Brain Tumor Therapeutics Market Volume Share (%), by Therapy 2024 & 2032
- Figure 67: Middle East and Africa Brain Tumor Therapeutics Market Revenue (Million), by Country 2024 & 2032
- Figure 68: Middle East and Africa Brain Tumor Therapeutics Market Volume (K Unit), by Country 2024 & 2032
- Figure 69: Middle East and Africa Brain Tumor Therapeutics Market Revenue Share (%), by Country 2024 & 2032
- Figure 70: Middle East and Africa Brain Tumor Therapeutics Market Volume Share (%), by Country 2024 & 2032
- Figure 71: South America Brain Tumor Therapeutics Market Revenue (Million), by Type of Brain Cancer 2024 & 2032
- Figure 72: South America Brain Tumor Therapeutics Market Volume (K Unit), by Type of Brain Cancer 2024 & 2032
- Figure 73: South America Brain Tumor Therapeutics Market Revenue Share (%), by Type of Brain Cancer 2024 & 2032
- Figure 74: South America Brain Tumor Therapeutics Market Volume Share (%), by Type of Brain Cancer 2024 & 2032
- Figure 75: South America Brain Tumor Therapeutics Market Revenue (Million), by Therapy 2024 & 2032
- Figure 76: South America Brain Tumor Therapeutics Market Volume (K Unit), by Therapy 2024 & 2032
- Figure 77: South America Brain Tumor Therapeutics Market Revenue Share (%), by Therapy 2024 & 2032
- Figure 78: South America Brain Tumor Therapeutics Market Volume Share (%), by Therapy 2024 & 2032
- Figure 79: South America Brain Tumor Therapeutics Market Revenue (Million), by Country 2024 & 2032
- Figure 80: South America Brain Tumor Therapeutics Market Volume (K Unit), by Country 2024 & 2032
- Figure 81: South America Brain Tumor Therapeutics Market Revenue Share (%), by Country 2024 & 2032
- Figure 82: South America Brain Tumor Therapeutics Market Volume Share (%), by Country 2024 & 2032
List of Tables
- Table 1: Global Brain Tumor Therapeutics Market Revenue Million Forecast, by Region 2019 & 2032
- Table 2: Global Brain Tumor Therapeutics Market Volume K Unit Forecast, by Region 2019 & 2032
- Table 3: Global Brain Tumor Therapeutics Market Revenue Million Forecast, by Type of Brain Cancer 2019 & 2032
- Table 4: Global Brain Tumor Therapeutics Market Volume K Unit Forecast, by Type of Brain Cancer 2019 & 2032
- Table 5: Global Brain Tumor Therapeutics Market Revenue Million Forecast, by Therapy 2019 & 2032
- Table 6: Global Brain Tumor Therapeutics Market Volume K Unit Forecast, by Therapy 2019 & 2032
- Table 7: Global Brain Tumor Therapeutics Market Revenue Million Forecast, by Region 2019 & 2032
- Table 8: Global Brain Tumor Therapeutics Market Volume K Unit Forecast, by Region 2019 & 2032
- Table 9: Global Brain Tumor Therapeutics Market Revenue Million Forecast, by Country 2019 & 2032
- Table 10: Global Brain Tumor Therapeutics Market Volume K Unit Forecast, by Country 2019 & 2032
- Table 11: United States Brain Tumor Therapeutics Market Revenue (Million) Forecast, by Application 2019 & 2032
- Table 12: United States Brain Tumor Therapeutics Market Volume (K Unit) Forecast, by Application 2019 & 2032
- Table 13: Canada Brain Tumor Therapeutics Market Revenue (Million) Forecast, by Application 2019 & 2032
- Table 14: Canada Brain Tumor Therapeutics Market Volume (K Unit) Forecast, by Application 2019 & 2032
- Table 15: Mexico Brain Tumor Therapeutics Market Revenue (Million) Forecast, by Application 2019 & 2032
- Table 16: Mexico Brain Tumor Therapeutics Market Volume (K Unit) Forecast, by Application 2019 & 2032
- Table 17: Global Brain Tumor Therapeutics Market Revenue Million Forecast, by Country 2019 & 2032
- Table 18: Global Brain Tumor Therapeutics Market Volume K Unit Forecast, by Country 2019 & 2032
- Table 19: Germany Brain Tumor Therapeutics Market Revenue (Million) Forecast, by Application 2019 & 2032
- Table 20: Germany Brain Tumor Therapeutics Market Volume (K Unit) Forecast, by Application 2019 & 2032
- Table 21: United Kingdom Brain Tumor Therapeutics Market Revenue (Million) Forecast, by Application 2019 & 2032
- Table 22: United Kingdom Brain Tumor Therapeutics Market Volume (K Unit) Forecast, by Application 2019 & 2032
- Table 23: France Brain Tumor Therapeutics Market Revenue (Million) Forecast, by Application 2019 & 2032
- Table 24: France Brain Tumor Therapeutics Market Volume (K Unit) Forecast, by Application 2019 & 2032
- Table 25: Italy Brain Tumor Therapeutics Market Revenue (Million) Forecast, by Application 2019 & 2032
- Table 26: Italy Brain Tumor Therapeutics Market Volume (K Unit) Forecast, by Application 2019 & 2032
- Table 27: Spain Brain Tumor Therapeutics Market Revenue (Million) Forecast, by Application 2019 & 2032
- Table 28: Spain Brain Tumor Therapeutics Market Volume (K Unit) Forecast, by Application 2019 & 2032
- Table 29: Rest of Europe Brain Tumor Therapeutics Market Revenue (Million) Forecast, by Application 2019 & 2032
- Table 30: Rest of Europe Brain Tumor Therapeutics Market Volume (K Unit) Forecast, by Application 2019 & 2032
- Table 31: Global Brain Tumor Therapeutics Market Revenue Million Forecast, by Country 2019 & 2032
- Table 32: Global Brain Tumor Therapeutics Market Volume K Unit Forecast, by Country 2019 & 2032
- Table 33: China Brain Tumor Therapeutics Market Revenue (Million) Forecast, by Application 2019 & 2032
- Table 34: China Brain Tumor Therapeutics Market Volume (K Unit) Forecast, by Application 2019 & 2032
- Table 35: Japan Brain Tumor Therapeutics Market Revenue (Million) Forecast, by Application 2019 & 2032
- Table 36: Japan Brain Tumor Therapeutics Market Volume (K Unit) Forecast, by Application 2019 & 2032
- Table 37: India Brain Tumor Therapeutics Market Revenue (Million) Forecast, by Application 2019 & 2032
- Table 38: India Brain Tumor Therapeutics Market Volume (K Unit) Forecast, by Application 2019 & 2032
- Table 39: Australia Brain Tumor Therapeutics Market Revenue (Million) Forecast, by Application 2019 & 2032
- Table 40: Australia Brain Tumor Therapeutics Market Volume (K Unit) Forecast, by Application 2019 & 2032
- Table 41: South Korea Brain Tumor Therapeutics Market Revenue (Million) Forecast, by Application 2019 & 2032
- Table 42: South Korea Brain Tumor Therapeutics Market Volume (K Unit) Forecast, by Application 2019 & 2032
- Table 43: Rest of Asia Pacific Brain Tumor Therapeutics Market Revenue (Million) Forecast, by Application 2019 & 2032
- Table 44: Rest of Asia Pacific Brain Tumor Therapeutics Market Volume (K Unit) Forecast, by Application 2019 & 2032
- Table 45: Global Brain Tumor Therapeutics Market Revenue Million Forecast, by Country 2019 & 2032
- Table 46: Global Brain Tumor Therapeutics Market Volume K Unit Forecast, by Country 2019 & 2032
- Table 47: GCC Brain Tumor Therapeutics Market Revenue (Million) Forecast, by Application 2019 & 2032
- Table 48: GCC Brain Tumor Therapeutics Market Volume (K Unit) Forecast, by Application 2019 & 2032
- Table 49: South Africa Brain Tumor Therapeutics Market Revenue (Million) Forecast, by Application 2019 & 2032
- Table 50: South Africa Brain Tumor Therapeutics Market Volume (K Unit) Forecast, by Application 2019 & 2032
- Table 51: Rest of Middle East and Africa Brain Tumor Therapeutics Market Revenue (Million) Forecast, by Application 2019 & 2032
- Table 52: Rest of Middle East and Africa Brain Tumor Therapeutics Market Volume (K Unit) Forecast, by Application 2019 & 2032
- Table 53: Global Brain Tumor Therapeutics Market Revenue Million Forecast, by Country 2019 & 2032
- Table 54: Global Brain Tumor Therapeutics Market Volume K Unit Forecast, by Country 2019 & 2032
- Table 55: Brazil Brain Tumor Therapeutics Market Revenue (Million) Forecast, by Application 2019 & 2032
- Table 56: Brazil Brain Tumor Therapeutics Market Volume (K Unit) Forecast, by Application 2019 & 2032
- Table 57: Argentina Brain Tumor Therapeutics Market Revenue (Million) Forecast, by Application 2019 & 2032
- Table 58: Argentina Brain Tumor Therapeutics Market Volume (K Unit) Forecast, by Application 2019 & 2032
- Table 59: Rest of South America Brain Tumor Therapeutics Market Revenue (Million) Forecast, by Application 2019 & 2032
- Table 60: Rest of South America Brain Tumor Therapeutics Market Volume (K Unit) Forecast, by Application 2019 & 2032
- Table 61: Global Brain Tumor Therapeutics Market Revenue Million Forecast, by Type of Brain Cancer 2019 & 2032
- Table 62: Global Brain Tumor Therapeutics Market Volume K Unit Forecast, by Type of Brain Cancer 2019 & 2032
- Table 63: Global Brain Tumor Therapeutics Market Revenue Million Forecast, by Therapy 2019 & 2032
- Table 64: Global Brain Tumor Therapeutics Market Volume K Unit Forecast, by Therapy 2019 & 2032
- Table 65: Global Brain Tumor Therapeutics Market Revenue Million Forecast, by Country 2019 & 2032
- Table 66: Global Brain Tumor Therapeutics Market Volume K Unit Forecast, by Country 2019 & 2032
- Table 67: United States Brain Tumor Therapeutics Market Revenue (Million) Forecast, by Application 2019 & 2032
- Table 68: United States Brain Tumor Therapeutics Market Volume (K Unit) Forecast, by Application 2019 & 2032
- Table 69: Canada Brain Tumor Therapeutics Market Revenue (Million) Forecast, by Application 2019 & 2032
- Table 70: Canada Brain Tumor Therapeutics Market Volume (K Unit) Forecast, by Application 2019 & 2032
- Table 71: Mexico Brain Tumor Therapeutics Market Revenue (Million) Forecast, by Application 2019 & 2032
- Table 72: Mexico Brain Tumor Therapeutics Market Volume (K Unit) Forecast, by Application 2019 & 2032
- Table 73: Global Brain Tumor Therapeutics Market Revenue Million Forecast, by Type of Brain Cancer 2019 & 2032
- Table 74: Global Brain Tumor Therapeutics Market Volume K Unit Forecast, by Type of Brain Cancer 2019 & 2032
- Table 75: Global Brain Tumor Therapeutics Market Revenue Million Forecast, by Therapy 2019 & 2032
- Table 76: Global Brain Tumor Therapeutics Market Volume K Unit Forecast, by Therapy 2019 & 2032
- Table 77: Global Brain Tumor Therapeutics Market Revenue Million Forecast, by Country 2019 & 2032
- Table 78: Global Brain Tumor Therapeutics Market Volume K Unit Forecast, by Country 2019 & 2032
- Table 79: Germany Brain Tumor Therapeutics Market Revenue (Million) Forecast, by Application 2019 & 2032
- Table 80: Germany Brain Tumor Therapeutics Market Volume (K Unit) Forecast, by Application 2019 & 2032
- Table 81: United Kingdom Brain Tumor Therapeutics Market Revenue (Million) Forecast, by Application 2019 & 2032
- Table 82: United Kingdom Brain Tumor Therapeutics Market Volume (K Unit) Forecast, by Application 2019 & 2032
- Table 83: France Brain Tumor Therapeutics Market Revenue (Million) Forecast, by Application 2019 & 2032
- Table 84: France Brain Tumor Therapeutics Market Volume (K Unit) Forecast, by Application 2019 & 2032
- Table 85: Italy Brain Tumor Therapeutics Market Revenue (Million) Forecast, by Application 2019 & 2032
- Table 86: Italy Brain Tumor Therapeutics Market Volume (K Unit) Forecast, by Application 2019 & 2032
- Table 87: Spain Brain Tumor Therapeutics Market Revenue (Million) Forecast, by Application 2019 & 2032
- Table 88: Spain Brain Tumor Therapeutics Market Volume (K Unit) Forecast, by Application 2019 & 2032
- Table 89: Rest of Europe Brain Tumor Therapeutics Market Revenue (Million) Forecast, by Application 2019 & 2032
- Table 90: Rest of Europe Brain Tumor Therapeutics Market Volume (K Unit) Forecast, by Application 2019 & 2032
- Table 91: Global Brain Tumor Therapeutics Market Revenue Million Forecast, by Type of Brain Cancer 2019 & 2032
- Table 92: Global Brain Tumor Therapeutics Market Volume K Unit Forecast, by Type of Brain Cancer 2019 & 2032
- Table 93: Global Brain Tumor Therapeutics Market Revenue Million Forecast, by Therapy 2019 & 2032
- Table 94: Global Brain Tumor Therapeutics Market Volume K Unit Forecast, by Therapy 2019 & 2032
- Table 95: Global Brain Tumor Therapeutics Market Revenue Million Forecast, by Country 2019 & 2032
- Table 96: Global Brain Tumor Therapeutics Market Volume K Unit Forecast, by Country 2019 & 2032
- Table 97: China Brain Tumor Therapeutics Market Revenue (Million) Forecast, by Application 2019 & 2032
- Table 98: China Brain Tumor Therapeutics Market Volume (K Unit) Forecast, by Application 2019 & 2032
- Table 99: Japan Brain Tumor Therapeutics Market Revenue (Million) Forecast, by Application 2019 & 2032
- Table 100: Japan Brain Tumor Therapeutics Market Volume (K Unit) Forecast, by Application 2019 & 2032
- Table 101: India Brain Tumor Therapeutics Market Revenue (Million) Forecast, by Application 2019 & 2032
- Table 102: India Brain Tumor Therapeutics Market Volume (K Unit) Forecast, by Application 2019 & 2032
- Table 103: Australia Brain Tumor Therapeutics Market Revenue (Million) Forecast, by Application 2019 & 2032
- Table 104: Australia Brain Tumor Therapeutics Market Volume (K Unit) Forecast, by Application 2019 & 2032
- Table 105: South Korea Brain Tumor Therapeutics Market Revenue (Million) Forecast, by Application 2019 & 2032
- Table 106: South Korea Brain Tumor Therapeutics Market Volume (K Unit) Forecast, by Application 2019 & 2032
- Table 107: Rest of Asia Pacific Brain Tumor Therapeutics Market Revenue (Million) Forecast, by Application 2019 & 2032
- Table 108: Rest of Asia Pacific Brain Tumor Therapeutics Market Volume (K Unit) Forecast, by Application 2019 & 2032
- Table 109: Global Brain Tumor Therapeutics Market Revenue Million Forecast, by Type of Brain Cancer 2019 & 2032
- Table 110: Global Brain Tumor Therapeutics Market Volume K Unit Forecast, by Type of Brain Cancer 2019 & 2032
- Table 111: Global Brain Tumor Therapeutics Market Revenue Million Forecast, by Therapy 2019 & 2032
- Table 112: Global Brain Tumor Therapeutics Market Volume K Unit Forecast, by Therapy 2019 & 2032
- Table 113: Global Brain Tumor Therapeutics Market Revenue Million Forecast, by Country 2019 & 2032
- Table 114: Global Brain Tumor Therapeutics Market Volume K Unit Forecast, by Country 2019 & 2032
- Table 115: GCC Brain Tumor Therapeutics Market Revenue (Million) Forecast, by Application 2019 & 2032
- Table 116: GCC Brain Tumor Therapeutics Market Volume (K Unit) Forecast, by Application 2019 & 2032
- Table 117: South Africa Brain Tumor Therapeutics Market Revenue (Million) Forecast, by Application 2019 & 2032
- Table 118: South Africa Brain Tumor Therapeutics Market Volume (K Unit) Forecast, by Application 2019 & 2032
- Table 119: Rest of Middle East and Africa Brain Tumor Therapeutics Market Revenue (Million) Forecast, by Application 2019 & 2032
- Table 120: Rest of Middle East and Africa Brain Tumor Therapeutics Market Volume (K Unit) Forecast, by Application 2019 & 2032
- Table 121: Global Brain Tumor Therapeutics Market Revenue Million Forecast, by Type of Brain Cancer 2019 & 2032
- Table 122: Global Brain Tumor Therapeutics Market Volume K Unit Forecast, by Type of Brain Cancer 2019 & 2032
- Table 123: Global Brain Tumor Therapeutics Market Revenue Million Forecast, by Therapy 2019 & 2032
- Table 124: Global Brain Tumor Therapeutics Market Volume K Unit Forecast, by Therapy 2019 & 2032
- Table 125: Global Brain Tumor Therapeutics Market Revenue Million Forecast, by Country 2019 & 2032
- Table 126: Global Brain Tumor Therapeutics Market Volume K Unit Forecast, by Country 2019 & 2032
- Table 127: Brazil Brain Tumor Therapeutics Market Revenue (Million) Forecast, by Application 2019 & 2032
- Table 128: Brazil Brain Tumor Therapeutics Market Volume (K Unit) Forecast, by Application 2019 & 2032
- Table 129: Argentina Brain Tumor Therapeutics Market Revenue (Million) Forecast, by Application 2019 & 2032
- Table 130: Argentina Brain Tumor Therapeutics Market Volume (K Unit) Forecast, by Application 2019 & 2032
- Table 131: Rest of South America Brain Tumor Therapeutics Market Revenue (Million) Forecast, by Application 2019 & 2032
- Table 132: Rest of South America Brain Tumor Therapeutics Market Volume (K Unit) Forecast, by Application 2019 & 2032
Frequently Asked Questions
1. What is the projected Compound Annual Growth Rate (CAGR) of the Brain Tumor Therapeutics Market?
The projected CAGR is approximately 11.00%.
2. Which companies are prominent players in the Brain Tumor Therapeutics Market?
Key companies in the market include Bayer AG, Novartis AG, Amgen Inc, Merck & Co Inc, F Hoffmann-La Roche Ltd, AstraZeneca PLC, Pfizer Inc , GSK plc, Johnson & Johnson, Eisai Co Ltd, Bristol-Myers Squibb Company.
3. What are the main segments of the Brain Tumor Therapeutics Market?
The market segments include Type of Brain Cancer, Therapy.
4. Can you provide details about the market size?
The market size is estimated to be USD XX Million as of 2022.
5. What are some drivers contributing to market growth?
Rising Incidence of Brain Tumor; Strong R&D Initiatives from Key Players; Increasing Government Initiatives for Cancer Awareness.
6. What are the notable trends driving market growth?
The Immunotherapy Segment is Expected to Register Robust Growth in the Brain Tumor Therapeutics Market Over the Forecast Period.
7. Are there any restraints impacting market growth?
High Cost of Cancer Therapies.
8. Can you provide examples of recent developments in the market?
June 2023: Erasca, Inc., a clinical-stage precision oncology company, received the United States Food and Drug Administration (FDA) Orphan Drug Designation (ODD) to ERAS-801 for the treatment of malignant glioma, which includes glioblastoma (GBM). ERAS-801 is an orally bioavailable, small-molecule EGFR inhibitor that exhibited substantial central nervous system (CNS) penetration in preclinical animal studies.
9. What pricing options are available for accessing the report?
Pricing options include single-user, multi-user, and enterprise licenses priced at USD 4750, USD 5250, and USD 8750 respectively.
10. Is the market size provided in terms of value or volume?
The market size is provided in terms of value, measured in Million and volume, measured in K Unit.
11. Are there any specific market keywords associated with the report?
Yes, the market keyword associated with the report is "Brain Tumor Therapeutics Market," which aids in identifying and referencing the specific market segment covered.
12. How do I determine which pricing option suits my needs best?
The pricing options vary based on user requirements and access needs. Individual users may opt for single-user licenses, while businesses requiring broader access may choose multi-user or enterprise licenses for cost-effective access to the report.
13. Are there any additional resources or data provided in the Brain Tumor Therapeutics Market report?
While the report offers comprehensive insights, it's advisable to review the specific contents or supplementary materials provided to ascertain if additional resources or data are available.
14. How can I stay updated on further developments or reports in the Brain Tumor Therapeutics Market?
To stay informed about further developments, trends, and reports in the Brain Tumor Therapeutics Market, consider subscribing to industry newsletters, following relevant companies and organizations, or regularly checking reputable industry news sources and publications.
Methodology
Step 1 - Identification of Relevant Samples Size from Population Database


Step 2 - Approaches for Defining Global Market Size (Value, Volume* & Price*)

Note*: In applicable scenarios
Step 3 - Data Sources
Primary Research
- Web Analytics
- Survey Reports
- Research Institute
- Latest Research Reports
- Opinion Leaders
Secondary Research
- Annual Reports
- White Paper
- Latest Press Release
- Industry Association
- Paid Database
- Investor Presentations

Step 4 - Data Triangulation
Involves using different sources of information in order to increase the validity of a study
These sources are likely to be stakeholders in a program - participants, other researchers, program staff, other community members, and so on.
Then we put all data in single framework & apply various statistical tools to find out the dynamic on the market.
During the analysis stage, feedback from the stakeholder groups would be compared to determine areas of agreement as well as areas of divergence
