

Key Insights
The Bone Morphogenetic Proteins (BMPs) market, valued at approximately $1.5 billion in 2025, is projected to experience steady growth, exhibiting a Compound Annual Growth Rate (CAGR) of 2.50% from 2025 to 2033. This growth is driven by several key factors. The increasing prevalence of spinal disorders, trauma cases requiring bone regeneration, and the rising demand for reconstructive surgeries are major contributors. Advancements in BMP technology, leading to improved efficacy and reduced side effects, further fuel market expansion. The development of novel delivery systems and targeted therapies is also contributing to this growth. While the market faces certain restraints, such as high treatment costs and potential adverse effects associated with BMP application, the overall market outlook remains positive due to the unmet clinical need for effective bone regeneration solutions. The segment dominated by recombinant human BMPs (rhBMPs) for spinal fusion applications currently holds the largest market share. Key players, including Thermo Fisher Scientific, Zimmer Biomet, and Medtronic, are continuously investing in research and development, enhancing their product portfolios, and strategically expanding their market reach through collaborations and acquisitions, fueling competition and driving innovation within the sector.
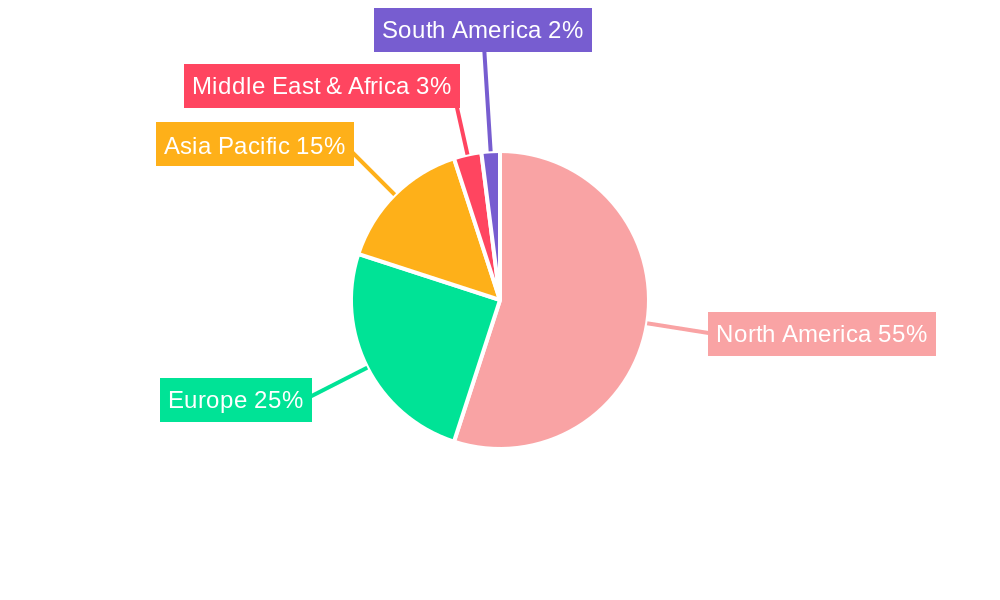
The geographical distribution of the BMPs market reveals strong regional variations. North America, particularly the United States, currently dominates the market, owing to high healthcare expenditure, advanced infrastructure, and a significant number of specialized surgical centers. Europe follows as a substantial market, with Germany and the United Kingdom showing significant demand. The Asia-Pacific region is witnessing accelerated growth, primarily driven by increasing healthcare awareness, rising disposable incomes, and expanding healthcare infrastructure in countries like China and India. Emerging markets in the Middle East and South America are also expected to contribute to market expansion in the coming years, albeit at a slower pace compared to established regions. Future growth will likely be shaped by the ongoing research into minimizing complications, improving efficacy of current therapies, and exploring new applications for BMPs in various bone-related conditions.

Bone Morphogenetic Proteins (BMP) Industry Report: 2019-2033 Forecast
This comprehensive report provides a detailed analysis of the Bone Morphogenetic Proteins (BMP) industry, offering invaluable insights for stakeholders, investors, and industry professionals. The study period covers 2019-2033, with 2025 as the base and estimated year. The report forecasts market trends from 2025 to 2033, leveraging data from the historical period of 2019-2024. The market is valued at XX Million in 2025 and is projected to reach XX Million by 2033, exhibiting a CAGR of XX%. Key players analyzed include Thermo Fischer Scientific, Zimmer Biomet Holdings Inc, Merck KGaA, Integra Lifesciences Holdings Corporation, Ember therapeutics Inc, Medtronic PLC, Bio-Techne (R&D Systems Inc), Johnson & Johnson, Stryker Corporation, and Pfizer Inc.
Bone Morphogenetic Proteins Industry Market Dynamics & Concentration
The Bone Morphogenetic Proteins (BMP) market is characterized by moderate concentration, with several key players holding significant market share. Thermo Fisher Scientific, Zimmer Biomet, and Medtronic are among the leading companies, collectively controlling an estimated 40% of the market in 2025. However, the market is witnessing increasing competition from smaller, specialized firms focusing on innovative BMP-based therapies. Market share dynamics are influenced by factors such as product innovation, regulatory approvals, and successful clinical trials.
- Innovation Drivers: Ongoing research into novel BMP delivery systems, including biocompatible scaffolds and controlled-release formulations, is driving market growth. The development of next-generation BMPs with enhanced efficacy and reduced side effects is also a major catalyst.
- Regulatory Frameworks: Stringent regulatory requirements for biologics and medical devices impact market entry and growth. Variations in regulatory landscapes across different geographies create diverse market dynamics.
- Product Substitutes: Alternative bone grafting materials, such as autografts and allografts, pose competition to BMPs. However, BMPs' superior efficacy in certain applications continues to drive adoption.
- End-User Trends: The increasing prevalence of age-related bone disorders and trauma cases fuels the demand for BMPs in orthopedic and dental applications.
- M&A Activities: The industry has witnessed a moderate level of merger and acquisition (M&A) activity in recent years, with approximately xx M&A deals recorded between 2019 and 2024. These transactions reflect the strategic focus on expanding product portfolios and market access.
Bone Morphogenetic Proteins Industry Industry Trends & Analysis
The BMP market is experiencing robust growth, driven primarily by the increasing prevalence of orthopedic and maxillofacial surgeries. Technological advancements, such as improved delivery systems and targeted BMP therapies, are significantly influencing market expansion. The market shows a high degree of specialization, with companies focusing on specific applications or therapeutic areas. This specialization contributes to the fragmented market structure and rapid innovation. Consumer preference is shifting towards minimally invasive surgical techniques, which drives the demand for BMPs as they enable faster healing and recovery. The competitive landscape is dynamic, with established players and emerging biotech companies vying for market share. The adoption of advanced analytical tools and data-driven decision-making is transforming market dynamics, leading to a more efficient and responsive industry. The global BMP market size is projected to increase at a Compound Annual Growth Rate (CAGR) of XX% from 2025 to 2033. Market penetration of BMPs in certain applications is still relatively low, presenting significant growth opportunities.

Leading Markets & Segments in Bone Morphogenetic Proteins Industry
The North American market currently dominates the global BMP industry, driven by high healthcare expenditure, advanced medical infrastructure, and a large patient pool with orthopedic and dental needs. Within applications, spinal fusion surgery represents the largest segment, followed by trauma and reconstructive surgery. Recombinant human bone morphogenetic protein (rhBMP) is the leading type of BMP used.
Key Drivers in North America:
- High healthcare spending and robust insurance coverage.
- Advanced surgical infrastructure and experienced medical professionals.
- High incidence of age-related bone disorders and trauma cases.
- Favorable regulatory environment promoting innovation.
Dominance Analysis: North America's dominance is attributable to a confluence of factors. The high prevalence of age-related bone conditions like osteoporosis contributes significantly to the demand for effective treatment options like BMPs. Furthermore, the region's advanced healthcare infrastructure and substantial investment in research and development ensure that the market experiences significant growth. The substantial market size and high expenditure on healthcare directly translate to a wider adoption and increased sales of BMP products.
Bone Morphogenetic Proteins Industry Product Developments
Recent advancements focus on improving BMP delivery methods, enhancing efficacy, and minimizing side effects. Novel biocompatible scaffolds and controlled-release systems are being developed to optimize BMP distribution and bone regeneration. There is a growing interest in combination therapies that leverage BMPs alongside other regenerative medicine approaches. This focus on enhancing delivery and safety is driving market growth and expanding treatment options.
Key Drivers of Bone Morphogenetic Proteins Industry Growth
Several factors fuel the growth of the BMP industry. The rising prevalence of age-related bone diseases and trauma cases necessitate effective treatment options. Technological advancements in BMP delivery systems and improved understanding of bone biology enhance the efficacy of BMP therapies. Favorable regulatory environments in several key markets facilitate the adoption of innovative BMP-based products. Increasing healthcare spending and insurance coverage further contribute to market expansion.
Challenges in the Bone Morphogenetic Proteins Industry Market
The BMP market faces challenges, including high production costs, stringent regulatory approvals, and potential side effects associated with some BMP therapies. Supply chain disruptions can impact product availability. Competition from alternative bone grafting materials and the need for extensive clinical trials for new products also present obstacles. The overall impact of these challenges is an estimated xx% reduction in market growth during the forecast period.
Emerging Opportunities in Bone Morphogenetic Proteins Industry
The BMP market presents several exciting opportunities. Advancements in regenerative medicine and tissue engineering are likely to unlock new applications for BMPs beyond orthopedic and dental surgeries. Strategic collaborations between pharmaceutical and biotech companies can accelerate innovation and market expansion. The growing interest in personalized medicine may lead to the development of tailored BMP therapies. Expansion into emerging markets with high unmet medical needs presents substantial potential.
Leading Players in the Bone Morphogenetic Proteins Industry Sector
- Thermo Fischer Scientific
- Zimmer Biomet Holdings Inc
- Merck KGaA
- Integra Lifesciences Holdings Corporation
- Ember therapeutics Inc
- Medtronic PLC
- Bio-Techne (R&D Systems Inc)
- Johnson & Johnson
- Stryker Corporation
- Pfizer Inc
Key Milestones in Bone Morphogenetic Proteins Industry Industry
- August 2022: Orthofix Medical Inc. partnered with CGBio for the development and commercialization of Novosis rhBMP-2 bone growth materials in the US and Canada. This significantly enhances Orthofix's product portfolio and market reach.
- February 2022: Orthofix Medical launched Opus BA, a novel bone scaffold for spinal fusion procedures. This launch expands treatment options and addresses unmet clinical needs.
Strategic Outlook for Bone Morphogenetic Proteins Industry Market
The BMP market exhibits strong growth potential, driven by technological advancements, expanding applications, and a growing global patient population requiring bone regeneration therapies. Strategic partnerships, focused research and development efforts, and expansion into emerging markets are key factors that will determine future success. The market's future hinges on further innovation in delivery systems, combination therapies, and a better understanding of BMP's role in bone regeneration.
Bone Morphogenetic Proteins Industry Segmentation
-
1. Type
- 1.1. Recombin
- 1.2. Recombin
-
2. Application
- 2.1. Spinal Fusion
- 2.2. Trauma
- 2.3. Reconstructive Surgery
- 2.4. Oral-maxillofacial
Bone Morphogenetic Proteins Industry Segmentation By Geography
-
1. North America
- 1.1. United States
- 1.2. Canada
- 1.3. Mexico
-
2. Europe
- 2.1. Germany
- 2.2. United Kingdom
- 2.3. France
- 2.4. Italy
- 2.5. Spain
- 2.6. Rest of Europe
-
3. Asia Pacific
- 3.1. China
- 3.2. Japan
- 3.3. India
- 3.4. Australia
- 3.5. South korea
- 3.6. Rest of Asia Pacific
- 4. Middle East
-
5. GCC
- 5.1. South Africa
- 5.2. Rest of Middle East
-
6. South America
- 6.1. Brazil
- 6.2. Argentina
- 6.3. Rest of South America
Bone Morphogenetic Proteins Industry REPORT HIGHLIGHTS
| Aspects | Details |
|---|---|
| Study Period | 2019-2033 |
| Base Year | 2024 |
| Estimated Year | 2025 |
| Forecast Period | 2025-2033 |
| Historical Period | 2019-2024 |
| Growth Rate | CAGR of 2.50% from 2019-2033 |
| Segmentation |
|
Table of Contents
- 1. Introduction
- 1.1. Research Scope
- 1.2. Market Segmentation
- 1.3. Research Methodology
- 1.4. Definitions and Assumptions
- 2. Executive Summary
- 2.1. Introduction
- 3. Market Dynamics
- 3.1. Introduction
- 3.2. Market Drivers
- 3.2.1. Growing Incidences of Sports-related Injury; Rising Demand for Minimally Invasive Surgeries; Technological Advancements
- 3.3. Market Restrains
- 3.3.1. High Cost of Procedure; Alternative Treatment Availability
- 3.4. Market Trends
- 3.4.1. Spinal Fusion is Expected to Hold the Significant Market Share in the Application Segment
- 4. Market Factor Analysis
- 4.1. Porters Five Forces
- 4.2. Supply/Value Chain
- 4.3. PESTEL analysis
- 4.4. Market Entropy
- 4.5. Patent/Trademark Analysis
- 5. Global Bone Morphogenetic Proteins Industry Analysis, Insights and Forecast, 2019-2031
- 5.1. Market Analysis, Insights and Forecast - by Type
- 5.1.1. Recombin
- 5.1.2. Recombin
- 5.2. Market Analysis, Insights and Forecast - by Application
- 5.2.1. Spinal Fusion
- 5.2.2. Trauma
- 5.2.3. Reconstructive Surgery
- 5.2.4. Oral-maxillofacial
- 5.3. Market Analysis, Insights and Forecast - by Region
- 5.3.1. North America
- 5.3.2. Europe
- 5.3.3. Asia Pacific
- 5.3.4. Middle East
- 5.3.5. GCC
- 5.3.6. South America
- 5.1. Market Analysis, Insights and Forecast - by Type
- 6. North America Bone Morphogenetic Proteins Industry Analysis, Insights and Forecast, 2019-2031
- 6.1. Market Analysis, Insights and Forecast - by Type
- 6.1.1. Recombin
- 6.1.2. Recombin
- 6.2. Market Analysis, Insights and Forecast - by Application
- 6.2.1. Spinal Fusion
- 6.2.2. Trauma
- 6.2.3. Reconstructive Surgery
- 6.2.4. Oral-maxillofacial
- 6.1. Market Analysis, Insights and Forecast - by Type
- 7. Europe Bone Morphogenetic Proteins Industry Analysis, Insights and Forecast, 2019-2031
- 7.1. Market Analysis, Insights and Forecast - by Type
- 7.1.1. Recombin
- 7.1.2. Recombin
- 7.2. Market Analysis, Insights and Forecast - by Application
- 7.2.1. Spinal Fusion
- 7.2.2. Trauma
- 7.2.3. Reconstructive Surgery
- 7.2.4. Oral-maxillofacial
- 7.1. Market Analysis, Insights and Forecast - by Type
- 8. Asia Pacific Bone Morphogenetic Proteins Industry Analysis, Insights and Forecast, 2019-2031
- 8.1. Market Analysis, Insights and Forecast - by Type
- 8.1.1. Recombin
- 8.1.2. Recombin
- 8.2. Market Analysis, Insights and Forecast - by Application
- 8.2.1. Spinal Fusion
- 8.2.2. Trauma
- 8.2.3. Reconstructive Surgery
- 8.2.4. Oral-maxillofacial
- 8.1. Market Analysis, Insights and Forecast - by Type
- 9. Middle East Bone Morphogenetic Proteins Industry Analysis, Insights and Forecast, 2019-2031
- 9.1. Market Analysis, Insights and Forecast - by Type
- 9.1.1. Recombin
- 9.1.2. Recombin
- 9.2. Market Analysis, Insights and Forecast - by Application
- 9.2.1. Spinal Fusion
- 9.2.2. Trauma
- 9.2.3. Reconstructive Surgery
- 9.2.4. Oral-maxillofacial
- 9.1. Market Analysis, Insights and Forecast - by Type
- 10. GCC Bone Morphogenetic Proteins Industry Analysis, Insights and Forecast, 2019-2031
- 10.1. Market Analysis, Insights and Forecast - by Type
- 10.1.1. Recombin
- 10.1.2. Recombin
- 10.2. Market Analysis, Insights and Forecast - by Application
- 10.2.1. Spinal Fusion
- 10.2.2. Trauma
- 10.2.3. Reconstructive Surgery
- 10.2.4. Oral-maxillofacial
- 10.1. Market Analysis, Insights and Forecast - by Type
- 11. South America Bone Morphogenetic Proteins Industry Analysis, Insights and Forecast, 2019-2031
- 11.1. Market Analysis, Insights and Forecast - by Type
- 11.1.1. Recombin
- 11.1.2. Recombin
- 11.2. Market Analysis, Insights and Forecast - by Application
- 11.2.1. Spinal Fusion
- 11.2.2. Trauma
- 11.2.3. Reconstructive Surgery
- 11.2.4. Oral-maxillofacial
- 11.1. Market Analysis, Insights and Forecast - by Type
- 12. North America Bone Morphogenetic Proteins Industry Analysis, Insights and Forecast, 2019-2031
- 12.1. Market Analysis, Insights and Forecast - By Country/Sub-region
- 12.1.1 United States
- 12.1.2 Canada
- 12.1.3 Mexico
- 13. Europe Bone Morphogenetic Proteins Industry Analysis, Insights and Forecast, 2019-2031
- 13.1. Market Analysis, Insights and Forecast - By Country/Sub-region
- 13.1.1 Germany
- 13.1.2 United Kingdom
- 13.1.3 France
- 13.1.4 Italy
- 13.1.5 Spain
- 13.1.6 Rest of Europe
- 14. Asia Pacific Bone Morphogenetic Proteins Industry Analysis, Insights and Forecast, 2019-2031
- 14.1. Market Analysis, Insights and Forecast - By Country/Sub-region
- 14.1.1 China
- 14.1.2 Japan
- 14.1.3 India
- 14.1.4 Australia
- 14.1.5 South korea
- 14.1.6 Rest of Asia Pacific
- 15. Middle East Bone Morphogenetic Proteins Industry Analysis, Insights and Forecast, 2019-2031
- 15.1. Market Analysis, Insights and Forecast - By Country/Sub-region
- 15.1.1 GCC
- 15.1.2 South Africa
- 15.1.3 Rest of Middle East
- 16. South America Bone Morphogenetic Proteins Industry Analysis, Insights and Forecast, 2019-2031
- 16.1. Market Analysis, Insights and Forecast - By Country/Sub-region
- 16.1.1 Brazil
- 16.1.2 Argentina
- 16.1.3 Rest of South America
- 17. Competitive Analysis
- 17.1. Global Market Share Analysis 2024
- 17.2. Company Profiles
- 17.2.1 Thermo Fischer Scientific
- 17.2.1.1. Overview
- 17.2.1.2. Products
- 17.2.1.3. SWOT Analysis
- 17.2.1.4. Recent Developments
- 17.2.1.5. Financials (Based on Availability)
- 17.2.2 Zimmer Biomet Holdings Inc
- 17.2.2.1. Overview
- 17.2.2.2. Products
- 17.2.2.3. SWOT Analysis
- 17.2.2.4. Recent Developments
- 17.2.2.5. Financials (Based on Availability)
- 17.2.3 Merck KGaA
- 17.2.3.1. Overview
- 17.2.3.2. Products
- 17.2.3.3. SWOT Analysis
- 17.2.3.4. Recent Developments
- 17.2.3.5. Financials (Based on Availability)
- 17.2.4 Integra Lifesciences Holdings Corporation
- 17.2.4.1. Overview
- 17.2.4.2. Products
- 17.2.4.3. SWOT Analysis
- 17.2.4.4. Recent Developments
- 17.2.4.5. Financials (Based on Availability)
- 17.2.5 Ember therapeutics Inc
- 17.2.5.1. Overview
- 17.2.5.2. Products
- 17.2.5.3. SWOT Analysis
- 17.2.5.4. Recent Developments
- 17.2.5.5. Financials (Based on Availability)
- 17.2.6 Medtronic PLC
- 17.2.6.1. Overview
- 17.2.6.2. Products
- 17.2.6.3. SWOT Analysis
- 17.2.6.4. Recent Developments
- 17.2.6.5. Financials (Based on Availability)
- 17.2.7 Bio-Techne (R&D Systems Inc )
- 17.2.7.1. Overview
- 17.2.7.2. Products
- 17.2.7.3. SWOT Analysis
- 17.2.7.4. Recent Developments
- 17.2.7.5. Financials (Based on Availability)
- 17.2.8 Johnson & Johnson
- 17.2.8.1. Overview
- 17.2.8.2. Products
- 17.2.8.3. SWOT Analysis
- 17.2.8.4. Recent Developments
- 17.2.8.5. Financials (Based on Availability)
- 17.2.9 Stryker Corporation
- 17.2.9.1. Overview
- 17.2.9.2. Products
- 17.2.9.3. SWOT Analysis
- 17.2.9.4. Recent Developments
- 17.2.9.5. Financials (Based on Availability)
- 17.2.10 Pfizer Inc
- 17.2.10.1. Overview
- 17.2.10.2. Products
- 17.2.10.3. SWOT Analysis
- 17.2.10.4. Recent Developments
- 17.2.10.5. Financials (Based on Availability)
- 17.2.1 Thermo Fischer Scientific
List of Figures
- Figure 1: Global Bone Morphogenetic Proteins Industry Revenue Breakdown (Million, %) by Region 2024 & 2032
- Figure 2: Global Bone Morphogenetic Proteins Industry Volume Breakdown (K Tons, %) by Region 2024 & 2032
- Figure 3: North America Bone Morphogenetic Proteins Industry Revenue (Million), by Country 2024 & 2032
- Figure 4: North America Bone Morphogenetic Proteins Industry Volume (K Tons), by Country 2024 & 2032
- Figure 5: North America Bone Morphogenetic Proteins Industry Revenue Share (%), by Country 2024 & 2032
- Figure 6: North America Bone Morphogenetic Proteins Industry Volume Share (%), by Country 2024 & 2032
- Figure 7: Europe Bone Morphogenetic Proteins Industry Revenue (Million), by Country 2024 & 2032
- Figure 8: Europe Bone Morphogenetic Proteins Industry Volume (K Tons), by Country 2024 & 2032
- Figure 9: Europe Bone Morphogenetic Proteins Industry Revenue Share (%), by Country 2024 & 2032
- Figure 10: Europe Bone Morphogenetic Proteins Industry Volume Share (%), by Country 2024 & 2032
- Figure 11: Asia Pacific Bone Morphogenetic Proteins Industry Revenue (Million), by Country 2024 & 2032
- Figure 12: Asia Pacific Bone Morphogenetic Proteins Industry Volume (K Tons), by Country 2024 & 2032
- Figure 13: Asia Pacific Bone Morphogenetic Proteins Industry Revenue Share (%), by Country 2024 & 2032
- Figure 14: Asia Pacific Bone Morphogenetic Proteins Industry Volume Share (%), by Country 2024 & 2032
- Figure 15: Middle East Bone Morphogenetic Proteins Industry Revenue (Million), by Country 2024 & 2032
- Figure 16: Middle East Bone Morphogenetic Proteins Industry Volume (K Tons), by Country 2024 & 2032
- Figure 17: Middle East Bone Morphogenetic Proteins Industry Revenue Share (%), by Country 2024 & 2032
- Figure 18: Middle East Bone Morphogenetic Proteins Industry Volume Share (%), by Country 2024 & 2032
- Figure 19: South America Bone Morphogenetic Proteins Industry Revenue (Million), by Country 2024 & 2032
- Figure 20: South America Bone Morphogenetic Proteins Industry Volume (K Tons), by Country 2024 & 2032
- Figure 21: South America Bone Morphogenetic Proteins Industry Revenue Share (%), by Country 2024 & 2032
- Figure 22: South America Bone Morphogenetic Proteins Industry Volume Share (%), by Country 2024 & 2032
- Figure 23: North America Bone Morphogenetic Proteins Industry Revenue (Million), by Type 2024 & 2032
- Figure 24: North America Bone Morphogenetic Proteins Industry Volume (K Tons), by Type 2024 & 2032
- Figure 25: North America Bone Morphogenetic Proteins Industry Revenue Share (%), by Type 2024 & 2032
- Figure 26: North America Bone Morphogenetic Proteins Industry Volume Share (%), by Type 2024 & 2032
- Figure 27: North America Bone Morphogenetic Proteins Industry Revenue (Million), by Application 2024 & 2032
- Figure 28: North America Bone Morphogenetic Proteins Industry Volume (K Tons), by Application 2024 & 2032
- Figure 29: North America Bone Morphogenetic Proteins Industry Revenue Share (%), by Application 2024 & 2032
- Figure 30: North America Bone Morphogenetic Proteins Industry Volume Share (%), by Application 2024 & 2032
- Figure 31: North America Bone Morphogenetic Proteins Industry Revenue (Million), by Country 2024 & 2032
- Figure 32: North America Bone Morphogenetic Proteins Industry Volume (K Tons), by Country 2024 & 2032
- Figure 33: North America Bone Morphogenetic Proteins Industry Revenue Share (%), by Country 2024 & 2032
- Figure 34: North America Bone Morphogenetic Proteins Industry Volume Share (%), by Country 2024 & 2032
- Figure 35: Europe Bone Morphogenetic Proteins Industry Revenue (Million), by Type 2024 & 2032
- Figure 36: Europe Bone Morphogenetic Proteins Industry Volume (K Tons), by Type 2024 & 2032
- Figure 37: Europe Bone Morphogenetic Proteins Industry Revenue Share (%), by Type 2024 & 2032
- Figure 38: Europe Bone Morphogenetic Proteins Industry Volume Share (%), by Type 2024 & 2032
- Figure 39: Europe Bone Morphogenetic Proteins Industry Revenue (Million), by Application 2024 & 2032
- Figure 40: Europe Bone Morphogenetic Proteins Industry Volume (K Tons), by Application 2024 & 2032
- Figure 41: Europe Bone Morphogenetic Proteins Industry Revenue Share (%), by Application 2024 & 2032
- Figure 42: Europe Bone Morphogenetic Proteins Industry Volume Share (%), by Application 2024 & 2032
- Figure 43: Europe Bone Morphogenetic Proteins Industry Revenue (Million), by Country 2024 & 2032
- Figure 44: Europe Bone Morphogenetic Proteins Industry Volume (K Tons), by Country 2024 & 2032
- Figure 45: Europe Bone Morphogenetic Proteins Industry Revenue Share (%), by Country 2024 & 2032
- Figure 46: Europe Bone Morphogenetic Proteins Industry Volume Share (%), by Country 2024 & 2032
- Figure 47: Asia Pacific Bone Morphogenetic Proteins Industry Revenue (Million), by Type 2024 & 2032
- Figure 48: Asia Pacific Bone Morphogenetic Proteins Industry Volume (K Tons), by Type 2024 & 2032
- Figure 49: Asia Pacific Bone Morphogenetic Proteins Industry Revenue Share (%), by Type 2024 & 2032
- Figure 50: Asia Pacific Bone Morphogenetic Proteins Industry Volume Share (%), by Type 2024 & 2032
- Figure 51: Asia Pacific Bone Morphogenetic Proteins Industry Revenue (Million), by Application 2024 & 2032
- Figure 52: Asia Pacific Bone Morphogenetic Proteins Industry Volume (K Tons), by Application 2024 & 2032
- Figure 53: Asia Pacific Bone Morphogenetic Proteins Industry Revenue Share (%), by Application 2024 & 2032
- Figure 54: Asia Pacific Bone Morphogenetic Proteins Industry Volume Share (%), by Application 2024 & 2032
- Figure 55: Asia Pacific Bone Morphogenetic Proteins Industry Revenue (Million), by Country 2024 & 2032
- Figure 56: Asia Pacific Bone Morphogenetic Proteins Industry Volume (K Tons), by Country 2024 & 2032
- Figure 57: Asia Pacific Bone Morphogenetic Proteins Industry Revenue Share (%), by Country 2024 & 2032
- Figure 58: Asia Pacific Bone Morphogenetic Proteins Industry Volume Share (%), by Country 2024 & 2032
- Figure 59: Middle East Bone Morphogenetic Proteins Industry Revenue (Million), by Type 2024 & 2032
- Figure 60: Middle East Bone Morphogenetic Proteins Industry Volume (K Tons), by Type 2024 & 2032
- Figure 61: Middle East Bone Morphogenetic Proteins Industry Revenue Share (%), by Type 2024 & 2032
- Figure 62: Middle East Bone Morphogenetic Proteins Industry Volume Share (%), by Type 2024 & 2032
- Figure 63: Middle East Bone Morphogenetic Proteins Industry Revenue (Million), by Application 2024 & 2032
- Figure 64: Middle East Bone Morphogenetic Proteins Industry Volume (K Tons), by Application 2024 & 2032
- Figure 65: Middle East Bone Morphogenetic Proteins Industry Revenue Share (%), by Application 2024 & 2032
- Figure 66: Middle East Bone Morphogenetic Proteins Industry Volume Share (%), by Application 2024 & 2032
- Figure 67: Middle East Bone Morphogenetic Proteins Industry Revenue (Million), by Country 2024 & 2032
- Figure 68: Middle East Bone Morphogenetic Proteins Industry Volume (K Tons), by Country 2024 & 2032
- Figure 69: Middle East Bone Morphogenetic Proteins Industry Revenue Share (%), by Country 2024 & 2032
- Figure 70: Middle East Bone Morphogenetic Proteins Industry Volume Share (%), by Country 2024 & 2032
- Figure 71: GCC Bone Morphogenetic Proteins Industry Revenue (Million), by Type 2024 & 2032
- Figure 72: GCC Bone Morphogenetic Proteins Industry Volume (K Tons), by Type 2024 & 2032
- Figure 73: GCC Bone Morphogenetic Proteins Industry Revenue Share (%), by Type 2024 & 2032
- Figure 74: GCC Bone Morphogenetic Proteins Industry Volume Share (%), by Type 2024 & 2032
- Figure 75: GCC Bone Morphogenetic Proteins Industry Revenue (Million), by Application 2024 & 2032
- Figure 76: GCC Bone Morphogenetic Proteins Industry Volume (K Tons), by Application 2024 & 2032
- Figure 77: GCC Bone Morphogenetic Proteins Industry Revenue Share (%), by Application 2024 & 2032
- Figure 78: GCC Bone Morphogenetic Proteins Industry Volume Share (%), by Application 2024 & 2032
- Figure 79: GCC Bone Morphogenetic Proteins Industry Revenue (Million), by Country 2024 & 2032
- Figure 80: GCC Bone Morphogenetic Proteins Industry Volume (K Tons), by Country 2024 & 2032
- Figure 81: GCC Bone Morphogenetic Proteins Industry Revenue Share (%), by Country 2024 & 2032
- Figure 82: GCC Bone Morphogenetic Proteins Industry Volume Share (%), by Country 2024 & 2032
- Figure 83: South America Bone Morphogenetic Proteins Industry Revenue (Million), by Type 2024 & 2032
- Figure 84: South America Bone Morphogenetic Proteins Industry Volume (K Tons), by Type 2024 & 2032
- Figure 85: South America Bone Morphogenetic Proteins Industry Revenue Share (%), by Type 2024 & 2032
- Figure 86: South America Bone Morphogenetic Proteins Industry Volume Share (%), by Type 2024 & 2032
- Figure 87: South America Bone Morphogenetic Proteins Industry Revenue (Million), by Application 2024 & 2032
- Figure 88: South America Bone Morphogenetic Proteins Industry Volume (K Tons), by Application 2024 & 2032
- Figure 89: South America Bone Morphogenetic Proteins Industry Revenue Share (%), by Application 2024 & 2032
- Figure 90: South America Bone Morphogenetic Proteins Industry Volume Share (%), by Application 2024 & 2032
- Figure 91: South America Bone Morphogenetic Proteins Industry Revenue (Million), by Country 2024 & 2032
- Figure 92: South America Bone Morphogenetic Proteins Industry Volume (K Tons), by Country 2024 & 2032
- Figure 93: South America Bone Morphogenetic Proteins Industry Revenue Share (%), by Country 2024 & 2032
- Figure 94: South America Bone Morphogenetic Proteins Industry Volume Share (%), by Country 2024 & 2032
List of Tables
- Table 1: Global Bone Morphogenetic Proteins Industry Revenue Million Forecast, by Region 2019 & 2032
- Table 2: Global Bone Morphogenetic Proteins Industry Volume K Tons Forecast, by Region 2019 & 2032
- Table 3: Global Bone Morphogenetic Proteins Industry Revenue Million Forecast, by Type 2019 & 2032
- Table 4: Global Bone Morphogenetic Proteins Industry Volume K Tons Forecast, by Type 2019 & 2032
- Table 5: Global Bone Morphogenetic Proteins Industry Revenue Million Forecast, by Application 2019 & 2032
- Table 6: Global Bone Morphogenetic Proteins Industry Volume K Tons Forecast, by Application 2019 & 2032
- Table 7: Global Bone Morphogenetic Proteins Industry Revenue Million Forecast, by Region 2019 & 2032
- Table 8: Global Bone Morphogenetic Proteins Industry Volume K Tons Forecast, by Region 2019 & 2032
- Table 9: Global Bone Morphogenetic Proteins Industry Revenue Million Forecast, by Country 2019 & 2032
- Table 10: Global Bone Morphogenetic Proteins Industry Volume K Tons Forecast, by Country 2019 & 2032
- Table 11: United States Bone Morphogenetic Proteins Industry Revenue (Million) Forecast, by Application 2019 & 2032
- Table 12: United States Bone Morphogenetic Proteins Industry Volume (K Tons) Forecast, by Application 2019 & 2032
- Table 13: Canada Bone Morphogenetic Proteins Industry Revenue (Million) Forecast, by Application 2019 & 2032
- Table 14: Canada Bone Morphogenetic Proteins Industry Volume (K Tons) Forecast, by Application 2019 & 2032
- Table 15: Mexico Bone Morphogenetic Proteins Industry Revenue (Million) Forecast, by Application 2019 & 2032
- Table 16: Mexico Bone Morphogenetic Proteins Industry Volume (K Tons) Forecast, by Application 2019 & 2032
- Table 17: Global Bone Morphogenetic Proteins Industry Revenue Million Forecast, by Country 2019 & 2032
- Table 18: Global Bone Morphogenetic Proteins Industry Volume K Tons Forecast, by Country 2019 & 2032
- Table 19: Germany Bone Morphogenetic Proteins Industry Revenue (Million) Forecast, by Application 2019 & 2032
- Table 20: Germany Bone Morphogenetic Proteins Industry Volume (K Tons) Forecast, by Application 2019 & 2032
- Table 21: United Kingdom Bone Morphogenetic Proteins Industry Revenue (Million) Forecast, by Application 2019 & 2032
- Table 22: United Kingdom Bone Morphogenetic Proteins Industry Volume (K Tons) Forecast, by Application 2019 & 2032
- Table 23: France Bone Morphogenetic Proteins Industry Revenue (Million) Forecast, by Application 2019 & 2032
- Table 24: France Bone Morphogenetic Proteins Industry Volume (K Tons) Forecast, by Application 2019 & 2032
- Table 25: Italy Bone Morphogenetic Proteins Industry Revenue (Million) Forecast, by Application 2019 & 2032
- Table 26: Italy Bone Morphogenetic Proteins Industry Volume (K Tons) Forecast, by Application 2019 & 2032
- Table 27: Spain Bone Morphogenetic Proteins Industry Revenue (Million) Forecast, by Application 2019 & 2032
- Table 28: Spain Bone Morphogenetic Proteins Industry Volume (K Tons) Forecast, by Application 2019 & 2032
- Table 29: Rest of Europe Bone Morphogenetic Proteins Industry Revenue (Million) Forecast, by Application 2019 & 2032
- Table 30: Rest of Europe Bone Morphogenetic Proteins Industry Volume (K Tons) Forecast, by Application 2019 & 2032
- Table 31: Global Bone Morphogenetic Proteins Industry Revenue Million Forecast, by Country 2019 & 2032
- Table 32: Global Bone Morphogenetic Proteins Industry Volume K Tons Forecast, by Country 2019 & 2032
- Table 33: China Bone Morphogenetic Proteins Industry Revenue (Million) Forecast, by Application 2019 & 2032
- Table 34: China Bone Morphogenetic Proteins Industry Volume (K Tons) Forecast, by Application 2019 & 2032
- Table 35: Japan Bone Morphogenetic Proteins Industry Revenue (Million) Forecast, by Application 2019 & 2032
- Table 36: Japan Bone Morphogenetic Proteins Industry Volume (K Tons) Forecast, by Application 2019 & 2032
- Table 37: India Bone Morphogenetic Proteins Industry Revenue (Million) Forecast, by Application 2019 & 2032
- Table 38: India Bone Morphogenetic Proteins Industry Volume (K Tons) Forecast, by Application 2019 & 2032
- Table 39: Australia Bone Morphogenetic Proteins Industry Revenue (Million) Forecast, by Application 2019 & 2032
- Table 40: Australia Bone Morphogenetic Proteins Industry Volume (K Tons) Forecast, by Application 2019 & 2032
- Table 41: South korea Bone Morphogenetic Proteins Industry Revenue (Million) Forecast, by Application 2019 & 2032
- Table 42: South korea Bone Morphogenetic Proteins Industry Volume (K Tons) Forecast, by Application 2019 & 2032
- Table 43: Rest of Asia Pacific Bone Morphogenetic Proteins Industry Revenue (Million) Forecast, by Application 2019 & 2032
- Table 44: Rest of Asia Pacific Bone Morphogenetic Proteins Industry Volume (K Tons) Forecast, by Application 2019 & 2032
- Table 45: Global Bone Morphogenetic Proteins Industry Revenue Million Forecast, by Country 2019 & 2032
- Table 46: Global Bone Morphogenetic Proteins Industry Volume K Tons Forecast, by Country 2019 & 2032
- Table 47: GCC Bone Morphogenetic Proteins Industry Revenue (Million) Forecast, by Application 2019 & 2032
- Table 48: GCC Bone Morphogenetic Proteins Industry Volume (K Tons) Forecast, by Application 2019 & 2032
- Table 49: South Africa Bone Morphogenetic Proteins Industry Revenue (Million) Forecast, by Application 2019 & 2032
- Table 50: South Africa Bone Morphogenetic Proteins Industry Volume (K Tons) Forecast, by Application 2019 & 2032
- Table 51: Rest of Middle East Bone Morphogenetic Proteins Industry Revenue (Million) Forecast, by Application 2019 & 2032
- Table 52: Rest of Middle East Bone Morphogenetic Proteins Industry Volume (K Tons) Forecast, by Application 2019 & 2032
- Table 53: Global Bone Morphogenetic Proteins Industry Revenue Million Forecast, by Country 2019 & 2032
- Table 54: Global Bone Morphogenetic Proteins Industry Volume K Tons Forecast, by Country 2019 & 2032
- Table 55: Brazil Bone Morphogenetic Proteins Industry Revenue (Million) Forecast, by Application 2019 & 2032
- Table 56: Brazil Bone Morphogenetic Proteins Industry Volume (K Tons) Forecast, by Application 2019 & 2032
- Table 57: Argentina Bone Morphogenetic Proteins Industry Revenue (Million) Forecast, by Application 2019 & 2032
- Table 58: Argentina Bone Morphogenetic Proteins Industry Volume (K Tons) Forecast, by Application 2019 & 2032
- Table 59: Rest of South America Bone Morphogenetic Proteins Industry Revenue (Million) Forecast, by Application 2019 & 2032
- Table 60: Rest of South America Bone Morphogenetic Proteins Industry Volume (K Tons) Forecast, by Application 2019 & 2032
- Table 61: Global Bone Morphogenetic Proteins Industry Revenue Million Forecast, by Type 2019 & 2032
- Table 62: Global Bone Morphogenetic Proteins Industry Volume K Tons Forecast, by Type 2019 & 2032
- Table 63: Global Bone Morphogenetic Proteins Industry Revenue Million Forecast, by Application 2019 & 2032
- Table 64: Global Bone Morphogenetic Proteins Industry Volume K Tons Forecast, by Application 2019 & 2032
- Table 65: Global Bone Morphogenetic Proteins Industry Revenue Million Forecast, by Country 2019 & 2032
- Table 66: Global Bone Morphogenetic Proteins Industry Volume K Tons Forecast, by Country 2019 & 2032
- Table 67: United States Bone Morphogenetic Proteins Industry Revenue (Million) Forecast, by Application 2019 & 2032
- Table 68: United States Bone Morphogenetic Proteins Industry Volume (K Tons) Forecast, by Application 2019 & 2032
- Table 69: Canada Bone Morphogenetic Proteins Industry Revenue (Million) Forecast, by Application 2019 & 2032
- Table 70: Canada Bone Morphogenetic Proteins Industry Volume (K Tons) Forecast, by Application 2019 & 2032
- Table 71: Mexico Bone Morphogenetic Proteins Industry Revenue (Million) Forecast, by Application 2019 & 2032
- Table 72: Mexico Bone Morphogenetic Proteins Industry Volume (K Tons) Forecast, by Application 2019 & 2032
- Table 73: Global Bone Morphogenetic Proteins Industry Revenue Million Forecast, by Type 2019 & 2032
- Table 74: Global Bone Morphogenetic Proteins Industry Volume K Tons Forecast, by Type 2019 & 2032
- Table 75: Global Bone Morphogenetic Proteins Industry Revenue Million Forecast, by Application 2019 & 2032
- Table 76: Global Bone Morphogenetic Proteins Industry Volume K Tons Forecast, by Application 2019 & 2032
- Table 77: Global Bone Morphogenetic Proteins Industry Revenue Million Forecast, by Country 2019 & 2032
- Table 78: Global Bone Morphogenetic Proteins Industry Volume K Tons Forecast, by Country 2019 & 2032
- Table 79: Germany Bone Morphogenetic Proteins Industry Revenue (Million) Forecast, by Application 2019 & 2032
- Table 80: Germany Bone Morphogenetic Proteins Industry Volume (K Tons) Forecast, by Application 2019 & 2032
- Table 81: United Kingdom Bone Morphogenetic Proteins Industry Revenue (Million) Forecast, by Application 2019 & 2032
- Table 82: United Kingdom Bone Morphogenetic Proteins Industry Volume (K Tons) Forecast, by Application 2019 & 2032
- Table 83: France Bone Morphogenetic Proteins Industry Revenue (Million) Forecast, by Application 2019 & 2032
- Table 84: France Bone Morphogenetic Proteins Industry Volume (K Tons) Forecast, by Application 2019 & 2032
- Table 85: Italy Bone Morphogenetic Proteins Industry Revenue (Million) Forecast, by Application 2019 & 2032
- Table 86: Italy Bone Morphogenetic Proteins Industry Volume (K Tons) Forecast, by Application 2019 & 2032
- Table 87: Spain Bone Morphogenetic Proteins Industry Revenue (Million) Forecast, by Application 2019 & 2032
- Table 88: Spain Bone Morphogenetic Proteins Industry Volume (K Tons) Forecast, by Application 2019 & 2032
- Table 89: Rest of Europe Bone Morphogenetic Proteins Industry Revenue (Million) Forecast, by Application 2019 & 2032
- Table 90: Rest of Europe Bone Morphogenetic Proteins Industry Volume (K Tons) Forecast, by Application 2019 & 2032
- Table 91: Global Bone Morphogenetic Proteins Industry Revenue Million Forecast, by Type 2019 & 2032
- Table 92: Global Bone Morphogenetic Proteins Industry Volume K Tons Forecast, by Type 2019 & 2032
- Table 93: Global Bone Morphogenetic Proteins Industry Revenue Million Forecast, by Application 2019 & 2032
- Table 94: Global Bone Morphogenetic Proteins Industry Volume K Tons Forecast, by Application 2019 & 2032
- Table 95: Global Bone Morphogenetic Proteins Industry Revenue Million Forecast, by Country 2019 & 2032
- Table 96: Global Bone Morphogenetic Proteins Industry Volume K Tons Forecast, by Country 2019 & 2032
- Table 97: China Bone Morphogenetic Proteins Industry Revenue (Million) Forecast, by Application 2019 & 2032
- Table 98: China Bone Morphogenetic Proteins Industry Volume (K Tons) Forecast, by Application 2019 & 2032
- Table 99: Japan Bone Morphogenetic Proteins Industry Revenue (Million) Forecast, by Application 2019 & 2032
- Table 100: Japan Bone Morphogenetic Proteins Industry Volume (K Tons) Forecast, by Application 2019 & 2032
- Table 101: India Bone Morphogenetic Proteins Industry Revenue (Million) Forecast, by Application 2019 & 2032
- Table 102: India Bone Morphogenetic Proteins Industry Volume (K Tons) Forecast, by Application 2019 & 2032
- Table 103: Australia Bone Morphogenetic Proteins Industry Revenue (Million) Forecast, by Application 2019 & 2032
- Table 104: Australia Bone Morphogenetic Proteins Industry Volume (K Tons) Forecast, by Application 2019 & 2032
- Table 105: South korea Bone Morphogenetic Proteins Industry Revenue (Million) Forecast, by Application 2019 & 2032
- Table 106: South korea Bone Morphogenetic Proteins Industry Volume (K Tons) Forecast, by Application 2019 & 2032
- Table 107: Rest of Asia Pacific Bone Morphogenetic Proteins Industry Revenue (Million) Forecast, by Application 2019 & 2032
- Table 108: Rest of Asia Pacific Bone Morphogenetic Proteins Industry Volume (K Tons) Forecast, by Application 2019 & 2032
- Table 109: Global Bone Morphogenetic Proteins Industry Revenue Million Forecast, by Type 2019 & 2032
- Table 110: Global Bone Morphogenetic Proteins Industry Volume K Tons Forecast, by Type 2019 & 2032
- Table 111: Global Bone Morphogenetic Proteins Industry Revenue Million Forecast, by Application 2019 & 2032
- Table 112: Global Bone Morphogenetic Proteins Industry Volume K Tons Forecast, by Application 2019 & 2032
- Table 113: Global Bone Morphogenetic Proteins Industry Revenue Million Forecast, by Country 2019 & 2032
- Table 114: Global Bone Morphogenetic Proteins Industry Volume K Tons Forecast, by Country 2019 & 2032
- Table 115: Global Bone Morphogenetic Proteins Industry Revenue Million Forecast, by Type 2019 & 2032
- Table 116: Global Bone Morphogenetic Proteins Industry Volume K Tons Forecast, by Type 2019 & 2032
- Table 117: Global Bone Morphogenetic Proteins Industry Revenue Million Forecast, by Application 2019 & 2032
- Table 118: Global Bone Morphogenetic Proteins Industry Volume K Tons Forecast, by Application 2019 & 2032
- Table 119: Global Bone Morphogenetic Proteins Industry Revenue Million Forecast, by Country 2019 & 2032
- Table 120: Global Bone Morphogenetic Proteins Industry Volume K Tons Forecast, by Country 2019 & 2032
- Table 121: South Africa Bone Morphogenetic Proteins Industry Revenue (Million) Forecast, by Application 2019 & 2032
- Table 122: South Africa Bone Morphogenetic Proteins Industry Volume (K Tons) Forecast, by Application 2019 & 2032
- Table 123: Rest of Middle East Bone Morphogenetic Proteins Industry Revenue (Million) Forecast, by Application 2019 & 2032
- Table 124: Rest of Middle East Bone Morphogenetic Proteins Industry Volume (K Tons) Forecast, by Application 2019 & 2032
- Table 125: Global Bone Morphogenetic Proteins Industry Revenue Million Forecast, by Type 2019 & 2032
- Table 126: Global Bone Morphogenetic Proteins Industry Volume K Tons Forecast, by Type 2019 & 2032
- Table 127: Global Bone Morphogenetic Proteins Industry Revenue Million Forecast, by Application 2019 & 2032
- Table 128: Global Bone Morphogenetic Proteins Industry Volume K Tons Forecast, by Application 2019 & 2032
- Table 129: Global Bone Morphogenetic Proteins Industry Revenue Million Forecast, by Country 2019 & 2032
- Table 130: Global Bone Morphogenetic Proteins Industry Volume K Tons Forecast, by Country 2019 & 2032
- Table 131: Brazil Bone Morphogenetic Proteins Industry Revenue (Million) Forecast, by Application 2019 & 2032
- Table 132: Brazil Bone Morphogenetic Proteins Industry Volume (K Tons) Forecast, by Application 2019 & 2032
- Table 133: Argentina Bone Morphogenetic Proteins Industry Revenue (Million) Forecast, by Application 2019 & 2032
- Table 134: Argentina Bone Morphogenetic Proteins Industry Volume (K Tons) Forecast, by Application 2019 & 2032
- Table 135: Rest of South America Bone Morphogenetic Proteins Industry Revenue (Million) Forecast, by Application 2019 & 2032
- Table 136: Rest of South America Bone Morphogenetic Proteins Industry Volume (K Tons) Forecast, by Application 2019 & 2032
Frequently Asked Questions
1. What is the projected Compound Annual Growth Rate (CAGR) of the Bone Morphogenetic Proteins Industry?
The projected CAGR is approximately 2.50%.
2. Which companies are prominent players in the Bone Morphogenetic Proteins Industry?
Key companies in the market include Thermo Fischer Scientific, Zimmer Biomet Holdings Inc , Merck KGaA, Integra Lifesciences Holdings Corporation, Ember therapeutics Inc, Medtronic PLC, Bio-Techne (R&D Systems Inc ), Johnson & Johnson, Stryker Corporation, Pfizer Inc.
3. What are the main segments of the Bone Morphogenetic Proteins Industry?
The market segments include Type, Application.
4. Can you provide details about the market size?
The market size is estimated to be USD XX Million as of 2022.
5. What are some drivers contributing to market growth?
Growing Incidences of Sports-related Injury; Rising Demand for Minimally Invasive Surgeries; Technological Advancements.
6. What are the notable trends driving market growth?
Spinal Fusion is Expected to Hold the Significant Market Share in the Application Segment.
7. Are there any restraints impacting market growth?
High Cost of Procedure; Alternative Treatment Availability.
8. Can you provide examples of recent developments in the market?
In August 2022, Orthofix Medical Inc. entered into a strategic partnership agreement with CGBio, for the clinical development and commercialization of Novosis recombinant human bone morphogenetic protein-2 (rhBMP-2) bone growth materials and other future tissue regenerative solutions for the United States and Canadian markets.
9. What pricing options are available for accessing the report?
Pricing options include single-user, multi-user, and enterprise licenses priced at USD 4750, USD 5250, and USD 8750 respectively.
10. Is the market size provided in terms of value or volume?
The market size is provided in terms of value, measured in Million and volume, measured in K Tons.
11. Are there any specific market keywords associated with the report?
Yes, the market keyword associated with the report is "Bone Morphogenetic Proteins Industry," which aids in identifying and referencing the specific market segment covered.
12. How do I determine which pricing option suits my needs best?
The pricing options vary based on user requirements and access needs. Individual users may opt for single-user licenses, while businesses requiring broader access may choose multi-user or enterprise licenses for cost-effective access to the report.
13. Are there any additional resources or data provided in the Bone Morphogenetic Proteins Industry report?
While the report offers comprehensive insights, it's advisable to review the specific contents or supplementary materials provided to ascertain if additional resources or data are available.
14. How can I stay updated on further developments or reports in the Bone Morphogenetic Proteins Industry?
To stay informed about further developments, trends, and reports in the Bone Morphogenetic Proteins Industry, consider subscribing to industry newsletters, following relevant companies and organizations, or regularly checking reputable industry news sources and publications.
Methodology
Step 1 - Identification of Relevant Samples Size from Population Database


Step 2 - Approaches for Defining Global Market Size (Value, Volume* & Price*)

Note*: In applicable scenarios
Step 3 - Data Sources
Primary Research
- Web Analytics
- Survey Reports
- Research Institute
- Latest Research Reports
- Opinion Leaders
Secondary Research
- Annual Reports
- White Paper
- Latest Press Release
- Industry Association
- Paid Database
- Investor Presentations

Step 4 - Data Triangulation
Involves using different sources of information in order to increase the validity of a study
These sources are likely to be stakeholders in a program - participants, other researchers, program staff, other community members, and so on.
Then we put all data in single framework & apply various statistical tools to find out the dynamic on the market.
During the analysis stage, feedback from the stakeholder groups would be compared to determine areas of agreement as well as areas of divergence
