

Key Insights
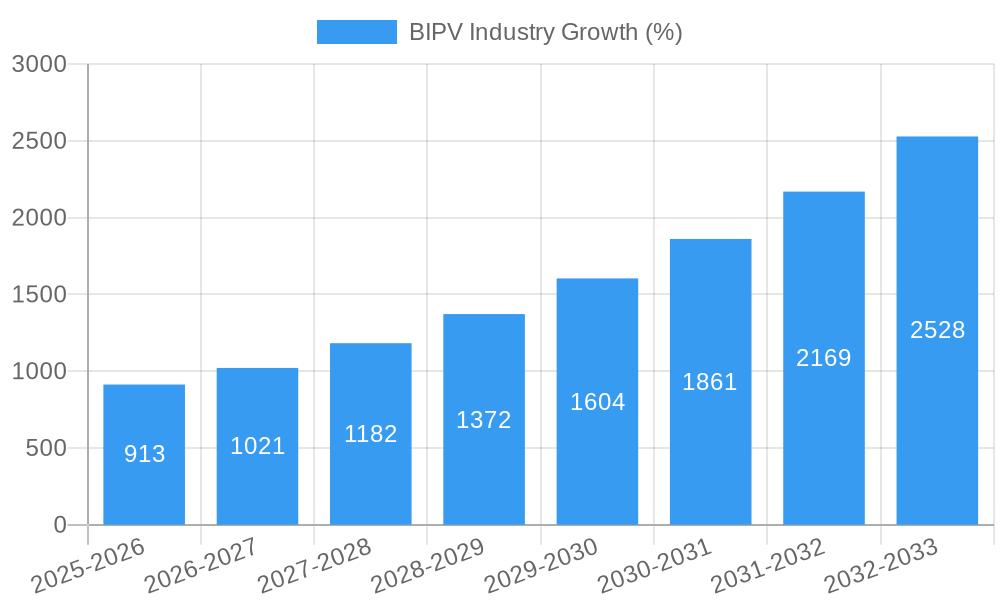
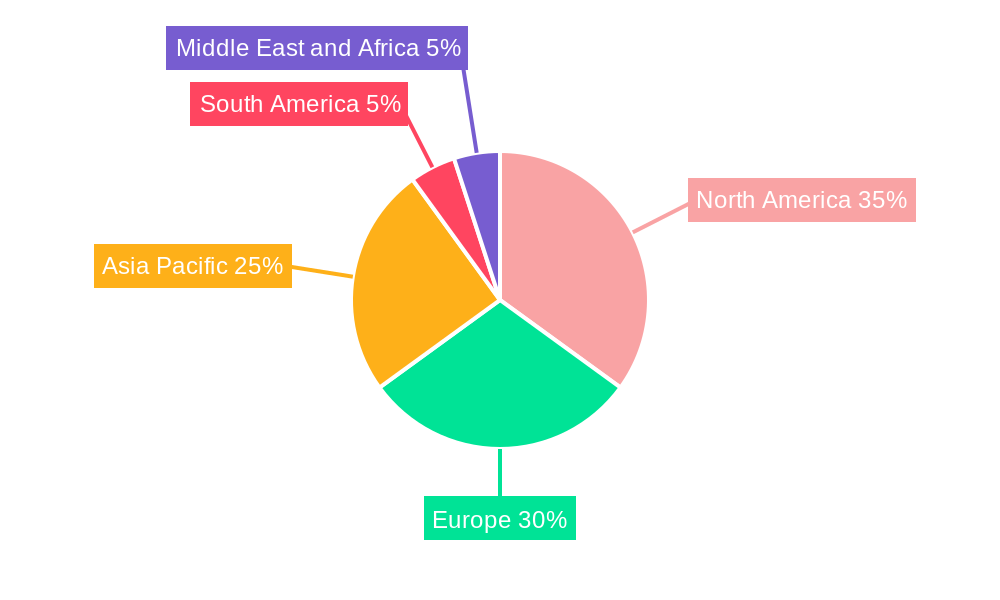
The Building-Integrated Photovoltaics (BIPV) market is experiencing robust growth, projected to reach a substantial size driven by increasing demand for sustainable energy solutions and aesthetically pleasing renewable energy integration. The market's Compound Annual Growth Rate (CAGR) of 14.79% from 2019-2033 signifies a significant upward trajectory, fueled by supportive government policies promoting renewable energy adoption, rising energy costs, and technological advancements leading to improved efficiency and reduced costs of BIPV systems. The thin-film PV segment is expected to witness strong growth due to its flexibility and suitability for various architectural designs, while the crystalline PV segment maintains a significant market share owing to its higher efficiency. The commercial and industrial end-user segment is anticipated to dominate, driven by large-scale installations and cost-effectiveness considerations, although the residential segment is also poised for growth as awareness of BIPV's benefits increases and technology becomes more accessible. Geographic analysis indicates strong growth across regions, with North America and Europe leading the market due to established renewable energy infrastructure and supportive regulatory environments; however, the Asia-Pacific region presents significant potential for future expansion owing to its rapid economic growth and increasing urbanization.
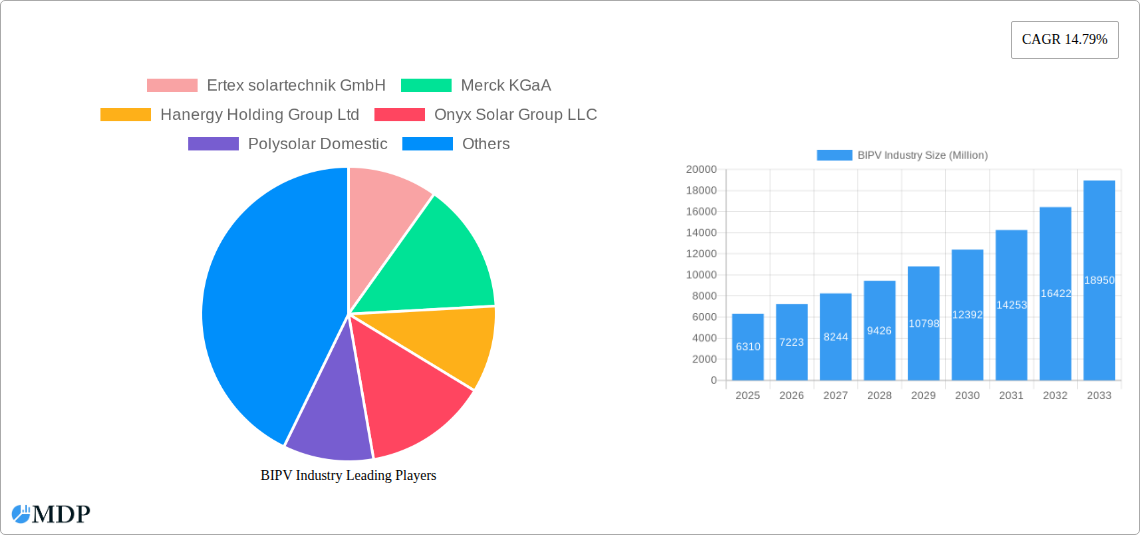
The competitive landscape is dynamic, with a mix of established players and emerging innovators. Key players such as Ertex Solartechnik GmbH, Merck KGaA, and Hanergy Holding Group Ltd. are actively engaged in research and development, focusing on improving BIPV efficiency, durability, and aesthetics. The market is witnessing strategic partnerships and collaborations to drive innovation and expand market penetration. Challenges include higher initial investment costs compared to traditional PV systems and the need for specialized installation expertise. However, ongoing technological advancements are addressing these challenges, making BIPV increasingly cost-competitive and accessible. Future growth will be driven by further efficiency improvements, standardization of installation processes, and innovative product designs that seamlessly integrate with building aesthetics. Government incentives, including tax breaks and subsidies, will play a crucial role in accelerating market adoption and fostering further growth in this promising sector.
Building Integrated Photovoltaics (BIPV) Industry Report: 2019-2033
This comprehensive report provides an in-depth analysis of the global BIPV industry, projecting a market value of $XX Million by 2033. It covers market dynamics, leading players, technological advancements, and future growth opportunities, offering invaluable insights for stakeholders across the value chain. The report is based on meticulous research covering the historical period (2019-2024), the base year (2025), and the forecast period (2025-2033).
BIPV Industry Market Dynamics & Concentration
The BIPV market, valued at $XX Million in 2025, is characterized by moderate concentration, with several key players vying for market share. Innovation is a key driver, with ongoing advancements in thin-film and crystalline PV technologies pushing efficiency and cost reduction. Stringent environmental regulations globally are increasingly favoring BIPV solutions, while the availability of alternative energy sources presents a competitive challenge. End-user trends show a strong shift towards sustainable building practices, particularly in the commercial and industrial segments, driving demand. Significant M&A activity indicates a consolidation trend within the industry.
- Market Concentration: The top five players collectively hold approximately xx% of the market share in 2025.
- M&A Activity: A total of xx M&A deals were recorded between 2019 and 2024.
- Innovation Drivers: Advances in thin-film and perovskite solar cell technologies, improved energy efficiency, and aesthetically pleasing designs.
- Regulatory Frameworks: Government incentives, building codes, and renewable energy mandates are key factors influencing market growth.
- Product Substitutes: Traditional roofing materials and separate solar panel installations remain primary competitors.
BIPV Industry Industry Trends & Analysis
The BIPV market exhibits a robust Compound Annual Growth Rate (CAGR) of xx% during the forecast period (2025-2033). This growth is fueled by the increasing adoption of sustainable building practices, stringent environmental regulations, and the decreasing cost of solar energy. Technological disruptions, such as advancements in flexible solar cells and transparent PV panels, are further accelerating market penetration. Consumer preference is shifting towards aesthetically integrated solar solutions, demanding seamless integration with building designs. Intense competition among established and emerging players fosters innovation and price competitiveness. Market penetration is expected to reach xx% by 2033, driven by strong demand from the commercial and industrial sectors.
Leading Markets & Segments in BIPV Industry
The Commercial & Industrial segment is currently the dominant end-user market, accounting for approximately xx% of the total revenue in 2025. Geographically, Europe holds a significant market share, driven by favorable government policies and a strong emphasis on renewable energy integration.
- Key Drivers for Commercial & Industrial Dominance:
- Higher initial investment capacity.
- Long-term cost savings from reduced energy bills.
- Enhanced brand image and sustainability credentials.
- Key Drivers for European Market Leadership:
- Stringent environmental regulations and renewable energy targets.
- Government incentives and subsidies for BIPV installations.
- Strong focus on sustainable building practices.
- Crystalline PV currently dominates the technology segment.
BIPV Industry Product Developments
Recent advancements focus on enhancing aesthetics, efficiency, and ease of integration. Products include flexible solar panels, semi-transparent panels suitable for windows, and integrated roofing systems that seamlessly blend solar functionality with architectural design. These innovations address critical challenges in market adoption, such as high installation costs and aesthetic limitations.
Key Drivers of BIPV Industry Growth
The BIPV market is driven by a confluence of factors. Technological advancements in improving efficiency and reducing costs are paramount. Stringent environmental regulations worldwide are pushing for greener building materials, while government incentives and subsidies are making BIPV a more economically viable option. Increasing awareness about sustainability among building owners further fuels market adoption. For instance, the partnership between ArcelorMittal and BP2 highlights the collaborative efforts to improve product sustainability.
Challenges in the BIPV Industry Market
High initial investment costs, coupled with complex installation processes, remain major barriers to entry. Supply chain disruptions and the availability of raw materials pose significant challenges. Intense competition from established players necessitates innovation and cost-effectiveness. Furthermore, regulatory hurdles in various regions can impede market growth, particularly in the residential segment.
Emerging Opportunities in BIPV Industry
The long-term growth of the BIPV industry hinges on technological breakthroughs, such as the development of more efficient and cost-effective solar cells. Strategic partnerships between manufacturers, building developers, and technology providers are crucial. Expansion into developing economies with strong solar irradiation and a growing construction sector presents significant opportunities.
Leading Players in the BIPV Industry Sector
- Ertex solartechnik GmbH
- Merck KGaA
- Hanergy Holding Group Ltd
- Onyx Solar Group LLC
- Polysolar Domestic
- Nanoflex Power Corporation
- Solarday
- AGC Inc
- Changzhou Almaden Co Ltd
- Issol SA
Key Milestones in BIPV Industry Industry
- September 2022: Saint-Gobain's strategic partnership with Megasol strengthens the BIPV module manufacturing capacity.
- April 2023: ArcelorMittal and BP2's collaboration introduces low-carbon steel for integrated photovoltaic roofs, signaling sustainability improvements within the industry.
Strategic Outlook for BIPV Industry Market
The BIPV market holds immense potential for growth, driven by escalating demand for sustainable building solutions and advancements in photovoltaic technology. Strategic partnerships, technological innovations, and supportive government policies will play pivotal roles in shaping the industry's future. The focus on cost reduction, improved efficiency, and aesthetic appeal will define success in this dynamic market.
BIPV Industry Segmentation
-
1. Type
- 1.1. Thin-film PV
- 1.2. Crystalline PV
-
2. End User
- 2.1. Residential
- 2.2. Commercial and Industrial
BIPV Industry Segmentation By Geography
-
1. North America
- 1.1. United States
- 1.2. Canada
- 1.3. Rest of North America
-
2. Europe
- 2.1. Germany
- 2.2. France
- 2.3. United Kingdom
- 2.4. Turkey
- 2.5. Spain
- 2.6. NORDIC
- 2.7. Russia
- 2.8. Rest of Europe
-
3. Asia Pacific
- 3.1. China
- 3.2. India
- 3.3. Japan
- 3.4. South Korea
- 3.5. Malaysia
- 3.6. Thailand
- 3.7. Indonesia
- 3.8. Vietnam
- 3.9. Rest of Asia Pacific
-
4. South America
- 4.1. Brazil
- 4.2. Argentina
- 4.3. Colombia
- 4.4. Rest of South America
-
5. Middle East and Africa
- 5.1. Saudi Arabia
- 5.2. United Arab Emirates
- 5.3. South Africa
- 5.4. Nigeria
- 5.5. Qatar
- 5.6. Egypt
- 5.7. Rest of Middle East and Africa
BIPV Industry REPORT HIGHLIGHTS
| Aspects | Details |
|---|---|
| Study Period | 2019-2033 |
| Base Year | 2024 |
| Estimated Year | 2025 |
| Forecast Period | 2025-2033 |
| Historical Period | 2019-2024 |
| Growth Rate | CAGR of 14.79% from 2019-2033 |
| Segmentation |
|
Table of Contents
- 1. Introduction
- 1.1. Research Scope
- 1.2. Market Segmentation
- 1.3. Research Methodology
- 1.4. Definitions and Assumptions
- 2. Executive Summary
- 2.1. Introduction
- 3. Market Dynamics
- 3.1. Introduction
- 3.2. Market Drivers
- 3.2.1. 4.; Reduction in Energy Bills Due to Self-Power Consumption4.; Increasing Installation of Solar PV Modules in Residential Segment
- 3.3. Market Restrains
- 3.3.1. 4.; High Installation Cost as Compared to Rooftop PV Systems
- 3.4. Market Trends
- 3.4.1. Crystalline PV Expected to Dominate the Market
- 4. Market Factor Analysis
- 4.1. Porters Five Forces
- 4.2. Supply/Value Chain
- 4.3. PESTEL analysis
- 4.4. Market Entropy
- 4.5. Patent/Trademark Analysis
- 5. Global BIPV Industry Analysis, Insights and Forecast, 2019-2031
- 5.1. Market Analysis, Insights and Forecast - by Type
- 5.1.1. Thin-film PV
- 5.1.2. Crystalline PV
- 5.2. Market Analysis, Insights and Forecast - by End User
- 5.2.1. Residential
- 5.2.2. Commercial and Industrial
- 5.3. Market Analysis, Insights and Forecast - by Region
- 5.3.1. North America
- 5.3.2. Europe
- 5.3.3. Asia Pacific
- 5.3.4. South America
- 5.3.5. Middle East and Africa
- 5.1. Market Analysis, Insights and Forecast - by Type
- 6. North America BIPV Industry Analysis, Insights and Forecast, 2019-2031
- 6.1. Market Analysis, Insights and Forecast - by Type
- 6.1.1. Thin-film PV
- 6.1.2. Crystalline PV
- 6.2. Market Analysis, Insights and Forecast - by End User
- 6.2.1. Residential
- 6.2.2. Commercial and Industrial
- 6.1. Market Analysis, Insights and Forecast - by Type
- 7. Europe BIPV Industry Analysis, Insights and Forecast, 2019-2031
- 7.1. Market Analysis, Insights and Forecast - by Type
- 7.1.1. Thin-film PV
- 7.1.2. Crystalline PV
- 7.2. Market Analysis, Insights and Forecast - by End User
- 7.2.1. Residential
- 7.2.2. Commercial and Industrial
- 7.1. Market Analysis, Insights and Forecast - by Type
- 8. Asia Pacific BIPV Industry Analysis, Insights and Forecast, 2019-2031
- 8.1. Market Analysis, Insights and Forecast - by Type
- 8.1.1. Thin-film PV
- 8.1.2. Crystalline PV
- 8.2. Market Analysis, Insights and Forecast - by End User
- 8.2.1. Residential
- 8.2.2. Commercial and Industrial
- 8.1. Market Analysis, Insights and Forecast - by Type
- 9. South America BIPV Industry Analysis, Insights and Forecast, 2019-2031
- 9.1. Market Analysis, Insights and Forecast - by Type
- 9.1.1. Thin-film PV
- 9.1.2. Crystalline PV
- 9.2. Market Analysis, Insights and Forecast - by End User
- 9.2.1. Residential
- 9.2.2. Commercial and Industrial
- 9.1. Market Analysis, Insights and Forecast - by Type
- 10. Middle East and Africa BIPV Industry Analysis, Insights and Forecast, 2019-2031
- 10.1. Market Analysis, Insights and Forecast - by Type
- 10.1.1. Thin-film PV
- 10.1.2. Crystalline PV
- 10.2. Market Analysis, Insights and Forecast - by End User
- 10.2.1. Residential
- 10.2.2. Commercial and Industrial
- 10.1. Market Analysis, Insights and Forecast - by Type
- 11. North America BIPV Industry Analysis, Insights and Forecast, 2019-2031
- 11.1. Market Analysis, Insights and Forecast - By Country/Sub-region
- 11.1.1 United States
- 11.1.2 Canada
- 11.1.3 Rest of North America
- 12. Europe BIPV Industry Analysis, Insights and Forecast, 2019-2031
- 12.1. Market Analysis, Insights and Forecast - By Country/Sub-region
- 12.1.1 Germany
- 12.1.2 France
- 12.1.3 United Kingdom
- 12.1.4 Rest of Europe
- 13. Asia Pacific BIPV Industry Analysis, Insights and Forecast, 2019-2031
- 13.1. Market Analysis, Insights and Forecast - By Country/Sub-region
- 13.1.1 China
- 13.1.2 India
- 13.1.3 Japan
- 13.1.4 South Korea
- 13.1.5 Rest of Asia Pacific
- 14. South America BIPV Industry Analysis, Insights and Forecast, 2019-2031
- 14.1. Market Analysis, Insights and Forecast - By Country/Sub-region
- 14.1.1 Brazil
- 14.1.2 Argentina
- 14.1.3 Rest of South America
- 15. Middle East and Africa BIPV Industry Analysis, Insights and Forecast, 2019-2031
- 15.1. Market Analysis, Insights and Forecast - By Country/Sub-region
- 15.1.1 Saudi Arabia
- 15.1.2 United Arab Emirates
- 15.1.3 South Africa
- 15.1.4 Rest of Middle East and Africa
- 16. Competitive Analysis
- 16.1. Global Market Share Analysis 2024
- 16.2. Company Profiles
- 16.2.1 Ertex solartechnik GmbH
- 16.2.1.1. Overview
- 16.2.1.2. Products
- 16.2.1.3. SWOT Analysis
- 16.2.1.4. Recent Developments
- 16.2.1.5. Financials (Based on Availability)
- 16.2.2 Merck KGaA
- 16.2.2.1. Overview
- 16.2.2.2. Products
- 16.2.2.3. SWOT Analysis
- 16.2.2.4. Recent Developments
- 16.2.2.5. Financials (Based on Availability)
- 16.2.3 Hanergy Holding Group Ltd
- 16.2.3.1. Overview
- 16.2.3.2. Products
- 16.2.3.3. SWOT Analysis
- 16.2.3.4. Recent Developments
- 16.2.3.5. Financials (Based on Availability)
- 16.2.4 Onyx Solar Group LLC
- 16.2.4.1. Overview
- 16.2.4.2. Products
- 16.2.4.3. SWOT Analysis
- 16.2.4.4. Recent Developments
- 16.2.4.5. Financials (Based on Availability)
- 16.2.5 Polysolar Domestic
- 16.2.5.1. Overview
- 16.2.5.2. Products
- 16.2.5.3. SWOT Analysis
- 16.2.5.4. Recent Developments
- 16.2.5.5. Financials (Based on Availability)
- 16.2.6 Nanoflex Power Corporation
- 16.2.6.1. Overview
- 16.2.6.2. Products
- 16.2.6.3. SWOT Analysis
- 16.2.6.4. Recent Developments
- 16.2.6.5. Financials (Based on Availability)
- 16.2.7 Solarday
- 16.2.7.1. Overview
- 16.2.7.2. Products
- 16.2.7.3. SWOT Analysis
- 16.2.7.4. Recent Developments
- 16.2.7.5. Financials (Based on Availability)
- 16.2.8 AGC Inc
- 16.2.8.1. Overview
- 16.2.8.2. Products
- 16.2.8.3. SWOT Analysis
- 16.2.8.4. Recent Developments
- 16.2.8.5. Financials (Based on Availability)
- 16.2.9 Changzhou Almaden Co Ltd
- 16.2.9.1. Overview
- 16.2.9.2. Products
- 16.2.9.3. SWOT Analysis
- 16.2.9.4. Recent Developments
- 16.2.9.5. Financials (Based on Availability)
- 16.2.10 Issol SA
- 16.2.10.1. Overview
- 16.2.10.2. Products
- 16.2.10.3. SWOT Analysis
- 16.2.10.4. Recent Developments
- 16.2.10.5. Financials (Based on Availability)
- 16.2.1 Ertex solartechnik GmbH
List of Figures
- Figure 1: Global BIPV Industry Revenue Breakdown (Million, %) by Region 2024 & 2032
- Figure 2: Global BIPV Industry Volume Breakdown (Gigawatt, %) by Region 2024 & 2032
- Figure 3: North America BIPV Industry Revenue (Million), by Country 2024 & 2032
- Figure 4: North America BIPV Industry Volume (Gigawatt), by Country 2024 & 2032
- Figure 5: North America BIPV Industry Revenue Share (%), by Country 2024 & 2032
- Figure 6: North America BIPV Industry Volume Share (%), by Country 2024 & 2032
- Figure 7: Europe BIPV Industry Revenue (Million), by Country 2024 & 2032
- Figure 8: Europe BIPV Industry Volume (Gigawatt), by Country 2024 & 2032
- Figure 9: Europe BIPV Industry Revenue Share (%), by Country 2024 & 2032
- Figure 10: Europe BIPV Industry Volume Share (%), by Country 2024 & 2032
- Figure 11: Asia Pacific BIPV Industry Revenue (Million), by Country 2024 & 2032
- Figure 12: Asia Pacific BIPV Industry Volume (Gigawatt), by Country 2024 & 2032
- Figure 13: Asia Pacific BIPV Industry Revenue Share (%), by Country 2024 & 2032
- Figure 14: Asia Pacific BIPV Industry Volume Share (%), by Country 2024 & 2032
- Figure 15: South America BIPV Industry Revenue (Million), by Country 2024 & 2032
- Figure 16: South America BIPV Industry Volume (Gigawatt), by Country 2024 & 2032
- Figure 17: South America BIPV Industry Revenue Share (%), by Country 2024 & 2032
- Figure 18: South America BIPV Industry Volume Share (%), by Country 2024 & 2032
- Figure 19: Middle East and Africa BIPV Industry Revenue (Million), by Country 2024 & 2032
- Figure 20: Middle East and Africa BIPV Industry Volume (Gigawatt), by Country 2024 & 2032
- Figure 21: Middle East and Africa BIPV Industry Revenue Share (%), by Country 2024 & 2032
- Figure 22: Middle East and Africa BIPV Industry Volume Share (%), by Country 2024 & 2032
- Figure 23: North America BIPV Industry Revenue (Million), by Type 2024 & 2032
- Figure 24: North America BIPV Industry Volume (Gigawatt), by Type 2024 & 2032
- Figure 25: North America BIPV Industry Revenue Share (%), by Type 2024 & 2032
- Figure 26: North America BIPV Industry Volume Share (%), by Type 2024 & 2032
- Figure 27: North America BIPV Industry Revenue (Million), by End User 2024 & 2032
- Figure 28: North America BIPV Industry Volume (Gigawatt), by End User 2024 & 2032
- Figure 29: North America BIPV Industry Revenue Share (%), by End User 2024 & 2032
- Figure 30: North America BIPV Industry Volume Share (%), by End User 2024 & 2032
- Figure 31: North America BIPV Industry Revenue (Million), by Country 2024 & 2032
- Figure 32: North America BIPV Industry Volume (Gigawatt), by Country 2024 & 2032
- Figure 33: North America BIPV Industry Revenue Share (%), by Country 2024 & 2032
- Figure 34: North America BIPV Industry Volume Share (%), by Country 2024 & 2032
- Figure 35: Europe BIPV Industry Revenue (Million), by Type 2024 & 2032
- Figure 36: Europe BIPV Industry Volume (Gigawatt), by Type 2024 & 2032
- Figure 37: Europe BIPV Industry Revenue Share (%), by Type 2024 & 2032
- Figure 38: Europe BIPV Industry Volume Share (%), by Type 2024 & 2032
- Figure 39: Europe BIPV Industry Revenue (Million), by End User 2024 & 2032
- Figure 40: Europe BIPV Industry Volume (Gigawatt), by End User 2024 & 2032
- Figure 41: Europe BIPV Industry Revenue Share (%), by End User 2024 & 2032
- Figure 42: Europe BIPV Industry Volume Share (%), by End User 2024 & 2032
- Figure 43: Europe BIPV Industry Revenue (Million), by Country 2024 & 2032
- Figure 44: Europe BIPV Industry Volume (Gigawatt), by Country 2024 & 2032
- Figure 45: Europe BIPV Industry Revenue Share (%), by Country 2024 & 2032
- Figure 46: Europe BIPV Industry Volume Share (%), by Country 2024 & 2032
- Figure 47: Asia Pacific BIPV Industry Revenue (Million), by Type 2024 & 2032
- Figure 48: Asia Pacific BIPV Industry Volume (Gigawatt), by Type 2024 & 2032
- Figure 49: Asia Pacific BIPV Industry Revenue Share (%), by Type 2024 & 2032
- Figure 50: Asia Pacific BIPV Industry Volume Share (%), by Type 2024 & 2032
- Figure 51: Asia Pacific BIPV Industry Revenue (Million), by End User 2024 & 2032
- Figure 52: Asia Pacific BIPV Industry Volume (Gigawatt), by End User 2024 & 2032
- Figure 53: Asia Pacific BIPV Industry Revenue Share (%), by End User 2024 & 2032
- Figure 54: Asia Pacific BIPV Industry Volume Share (%), by End User 2024 & 2032
- Figure 55: Asia Pacific BIPV Industry Revenue (Million), by Country 2024 & 2032
- Figure 56: Asia Pacific BIPV Industry Volume (Gigawatt), by Country 2024 & 2032
- Figure 57: Asia Pacific BIPV Industry Revenue Share (%), by Country 2024 & 2032
- Figure 58: Asia Pacific BIPV Industry Volume Share (%), by Country 2024 & 2032
- Figure 59: South America BIPV Industry Revenue (Million), by Type 2024 & 2032
- Figure 60: South America BIPV Industry Volume (Gigawatt), by Type 2024 & 2032
- Figure 61: South America BIPV Industry Revenue Share (%), by Type 2024 & 2032
- Figure 62: South America BIPV Industry Volume Share (%), by Type 2024 & 2032
- Figure 63: South America BIPV Industry Revenue (Million), by End User 2024 & 2032
- Figure 64: South America BIPV Industry Volume (Gigawatt), by End User 2024 & 2032
- Figure 65: South America BIPV Industry Revenue Share (%), by End User 2024 & 2032
- Figure 66: South America BIPV Industry Volume Share (%), by End User 2024 & 2032
- Figure 67: South America BIPV Industry Revenue (Million), by Country 2024 & 2032
- Figure 68: South America BIPV Industry Volume (Gigawatt), by Country 2024 & 2032
- Figure 69: South America BIPV Industry Revenue Share (%), by Country 2024 & 2032
- Figure 70: South America BIPV Industry Volume Share (%), by Country 2024 & 2032
- Figure 71: Middle East and Africa BIPV Industry Revenue (Million), by Type 2024 & 2032
- Figure 72: Middle East and Africa BIPV Industry Volume (Gigawatt), by Type 2024 & 2032
- Figure 73: Middle East and Africa BIPV Industry Revenue Share (%), by Type 2024 & 2032
- Figure 74: Middle East and Africa BIPV Industry Volume Share (%), by Type 2024 & 2032
- Figure 75: Middle East and Africa BIPV Industry Revenue (Million), by End User 2024 & 2032
- Figure 76: Middle East and Africa BIPV Industry Volume (Gigawatt), by End User 2024 & 2032
- Figure 77: Middle East and Africa BIPV Industry Revenue Share (%), by End User 2024 & 2032
- Figure 78: Middle East and Africa BIPV Industry Volume Share (%), by End User 2024 & 2032
- Figure 79: Middle East and Africa BIPV Industry Revenue (Million), by Country 2024 & 2032
- Figure 80: Middle East and Africa BIPV Industry Volume (Gigawatt), by Country 2024 & 2032
- Figure 81: Middle East and Africa BIPV Industry Revenue Share (%), by Country 2024 & 2032
- Figure 82: Middle East and Africa BIPV Industry Volume Share (%), by Country 2024 & 2032
List of Tables
- Table 1: Global BIPV Industry Revenue Million Forecast, by Region 2019 & 2032
- Table 2: Global BIPV Industry Volume Gigawatt Forecast, by Region 2019 & 2032
- Table 3: Global BIPV Industry Revenue Million Forecast, by Type 2019 & 2032
- Table 4: Global BIPV Industry Volume Gigawatt Forecast, by Type 2019 & 2032
- Table 5: Global BIPV Industry Revenue Million Forecast, by End User 2019 & 2032
- Table 6: Global BIPV Industry Volume Gigawatt Forecast, by End User 2019 & 2032
- Table 7: Global BIPV Industry Revenue Million Forecast, by Region 2019 & 2032
- Table 8: Global BIPV Industry Volume Gigawatt Forecast, by Region 2019 & 2032
- Table 9: Global BIPV Industry Revenue Million Forecast, by Country 2019 & 2032
- Table 10: Global BIPV Industry Volume Gigawatt Forecast, by Country 2019 & 2032
- Table 11: United States BIPV Industry Revenue (Million) Forecast, by Application 2019 & 2032
- Table 12: United States BIPV Industry Volume (Gigawatt) Forecast, by Application 2019 & 2032
- Table 13: Canada BIPV Industry Revenue (Million) Forecast, by Application 2019 & 2032
- Table 14: Canada BIPV Industry Volume (Gigawatt) Forecast, by Application 2019 & 2032
- Table 15: Rest of North America BIPV Industry Revenue (Million) Forecast, by Application 2019 & 2032
- Table 16: Rest of North America BIPV Industry Volume (Gigawatt) Forecast, by Application 2019 & 2032
- Table 17: Global BIPV Industry Revenue Million Forecast, by Country 2019 & 2032
- Table 18: Global BIPV Industry Volume Gigawatt Forecast, by Country 2019 & 2032
- Table 19: Germany BIPV Industry Revenue (Million) Forecast, by Application 2019 & 2032
- Table 20: Germany BIPV Industry Volume (Gigawatt) Forecast, by Application 2019 & 2032
- Table 21: France BIPV Industry Revenue (Million) Forecast, by Application 2019 & 2032
- Table 22: France BIPV Industry Volume (Gigawatt) Forecast, by Application 2019 & 2032
- Table 23: United Kingdom BIPV Industry Revenue (Million) Forecast, by Application 2019 & 2032
- Table 24: United Kingdom BIPV Industry Volume (Gigawatt) Forecast, by Application 2019 & 2032
- Table 25: Rest of Europe BIPV Industry Revenue (Million) Forecast, by Application 2019 & 2032
- Table 26: Rest of Europe BIPV Industry Volume (Gigawatt) Forecast, by Application 2019 & 2032
- Table 27: Global BIPV Industry Revenue Million Forecast, by Country 2019 & 2032
- Table 28: Global BIPV Industry Volume Gigawatt Forecast, by Country 2019 & 2032
- Table 29: China BIPV Industry Revenue (Million) Forecast, by Application 2019 & 2032
- Table 30: China BIPV Industry Volume (Gigawatt) Forecast, by Application 2019 & 2032
- Table 31: India BIPV Industry Revenue (Million) Forecast, by Application 2019 & 2032
- Table 32: India BIPV Industry Volume (Gigawatt) Forecast, by Application 2019 & 2032
- Table 33: Japan BIPV Industry Revenue (Million) Forecast, by Application 2019 & 2032
- Table 34: Japan BIPV Industry Volume (Gigawatt) Forecast, by Application 2019 & 2032
- Table 35: South Korea BIPV Industry Revenue (Million) Forecast, by Application 2019 & 2032
- Table 36: South Korea BIPV Industry Volume (Gigawatt) Forecast, by Application 2019 & 2032
- Table 37: Rest of Asia Pacific BIPV Industry Revenue (Million) Forecast, by Application 2019 & 2032
- Table 38: Rest of Asia Pacific BIPV Industry Volume (Gigawatt) Forecast, by Application 2019 & 2032
- Table 39: Global BIPV Industry Revenue Million Forecast, by Country 2019 & 2032
- Table 40: Global BIPV Industry Volume Gigawatt Forecast, by Country 2019 & 2032
- Table 41: Brazil BIPV Industry Revenue (Million) Forecast, by Application 2019 & 2032
- Table 42: Brazil BIPV Industry Volume (Gigawatt) Forecast, by Application 2019 & 2032
- Table 43: Argentina BIPV Industry Revenue (Million) Forecast, by Application 2019 & 2032
- Table 44: Argentina BIPV Industry Volume (Gigawatt) Forecast, by Application 2019 & 2032
- Table 45: Rest of South America BIPV Industry Revenue (Million) Forecast, by Application 2019 & 2032
- Table 46: Rest of South America BIPV Industry Volume (Gigawatt) Forecast, by Application 2019 & 2032
- Table 47: Global BIPV Industry Revenue Million Forecast, by Country 2019 & 2032
- Table 48: Global BIPV Industry Volume Gigawatt Forecast, by Country 2019 & 2032
- Table 49: Saudi Arabia BIPV Industry Revenue (Million) Forecast, by Application 2019 & 2032
- Table 50: Saudi Arabia BIPV Industry Volume (Gigawatt) Forecast, by Application 2019 & 2032
- Table 51: United Arab Emirates BIPV Industry Revenue (Million) Forecast, by Application 2019 & 2032
- Table 52: United Arab Emirates BIPV Industry Volume (Gigawatt) Forecast, by Application 2019 & 2032
- Table 53: South Africa BIPV Industry Revenue (Million) Forecast, by Application 2019 & 2032
- Table 54: South Africa BIPV Industry Volume (Gigawatt) Forecast, by Application 2019 & 2032
- Table 55: Rest of Middle East and Africa BIPV Industry Revenue (Million) Forecast, by Application 2019 & 2032
- Table 56: Rest of Middle East and Africa BIPV Industry Volume (Gigawatt) Forecast, by Application 2019 & 2032
- Table 57: Global BIPV Industry Revenue Million Forecast, by Type 2019 & 2032
- Table 58: Global BIPV Industry Volume Gigawatt Forecast, by Type 2019 & 2032
- Table 59: Global BIPV Industry Revenue Million Forecast, by End User 2019 & 2032
- Table 60: Global BIPV Industry Volume Gigawatt Forecast, by End User 2019 & 2032
- Table 61: Global BIPV Industry Revenue Million Forecast, by Country 2019 & 2032
- Table 62: Global BIPV Industry Volume Gigawatt Forecast, by Country 2019 & 2032
- Table 63: United States BIPV Industry Revenue (Million) Forecast, by Application 2019 & 2032
- Table 64: United States BIPV Industry Volume (Gigawatt) Forecast, by Application 2019 & 2032
- Table 65: Canada BIPV Industry Revenue (Million) Forecast, by Application 2019 & 2032
- Table 66: Canada BIPV Industry Volume (Gigawatt) Forecast, by Application 2019 & 2032
- Table 67: Rest of North America BIPV Industry Revenue (Million) Forecast, by Application 2019 & 2032
- Table 68: Rest of North America BIPV Industry Volume (Gigawatt) Forecast, by Application 2019 & 2032
- Table 69: Global BIPV Industry Revenue Million Forecast, by Type 2019 & 2032
- Table 70: Global BIPV Industry Volume Gigawatt Forecast, by Type 2019 & 2032
- Table 71: Global BIPV Industry Revenue Million Forecast, by End User 2019 & 2032
- Table 72: Global BIPV Industry Volume Gigawatt Forecast, by End User 2019 & 2032
- Table 73: Global BIPV Industry Revenue Million Forecast, by Country 2019 & 2032
- Table 74: Global BIPV Industry Volume Gigawatt Forecast, by Country 2019 & 2032
- Table 75: Germany BIPV Industry Revenue (Million) Forecast, by Application 2019 & 2032
- Table 76: Germany BIPV Industry Volume (Gigawatt) Forecast, by Application 2019 & 2032
- Table 77: France BIPV Industry Revenue (Million) Forecast, by Application 2019 & 2032
- Table 78: France BIPV Industry Volume (Gigawatt) Forecast, by Application 2019 & 2032
- Table 79: United Kingdom BIPV Industry Revenue (Million) Forecast, by Application 2019 & 2032
- Table 80: United Kingdom BIPV Industry Volume (Gigawatt) Forecast, by Application 2019 & 2032
- Table 81: Turkey BIPV Industry Revenue (Million) Forecast, by Application 2019 & 2032
- Table 82: Turkey BIPV Industry Volume (Gigawatt) Forecast, by Application 2019 & 2032
- Table 83: Spain BIPV Industry Revenue (Million) Forecast, by Application 2019 & 2032
- Table 84: Spain BIPV Industry Volume (Gigawatt) Forecast, by Application 2019 & 2032
- Table 85: NORDIC BIPV Industry Revenue (Million) Forecast, by Application 2019 & 2032
- Table 86: NORDIC BIPV Industry Volume (Gigawatt) Forecast, by Application 2019 & 2032
- Table 87: Russia BIPV Industry Revenue (Million) Forecast, by Application 2019 & 2032
- Table 88: Russia BIPV Industry Volume (Gigawatt) Forecast, by Application 2019 & 2032
- Table 89: Rest of Europe BIPV Industry Revenue (Million) Forecast, by Application 2019 & 2032
- Table 90: Rest of Europe BIPV Industry Volume (Gigawatt) Forecast, by Application 2019 & 2032
- Table 91: Global BIPV Industry Revenue Million Forecast, by Type 2019 & 2032
- Table 92: Global BIPV Industry Volume Gigawatt Forecast, by Type 2019 & 2032
- Table 93: Global BIPV Industry Revenue Million Forecast, by End User 2019 & 2032
- Table 94: Global BIPV Industry Volume Gigawatt Forecast, by End User 2019 & 2032
- Table 95: Global BIPV Industry Revenue Million Forecast, by Country 2019 & 2032
- Table 96: Global BIPV Industry Volume Gigawatt Forecast, by Country 2019 & 2032
- Table 97: China BIPV Industry Revenue (Million) Forecast, by Application 2019 & 2032
- Table 98: China BIPV Industry Volume (Gigawatt) Forecast, by Application 2019 & 2032
- Table 99: India BIPV Industry Revenue (Million) Forecast, by Application 2019 & 2032
- Table 100: India BIPV Industry Volume (Gigawatt) Forecast, by Application 2019 & 2032
- Table 101: Japan BIPV Industry Revenue (Million) Forecast, by Application 2019 & 2032
- Table 102: Japan BIPV Industry Volume (Gigawatt) Forecast, by Application 2019 & 2032
- Table 103: South Korea BIPV Industry Revenue (Million) Forecast, by Application 2019 & 2032
- Table 104: South Korea BIPV Industry Volume (Gigawatt) Forecast, by Application 2019 & 2032
- Table 105: Malaysia BIPV Industry Revenue (Million) Forecast, by Application 2019 & 2032
- Table 106: Malaysia BIPV Industry Volume (Gigawatt) Forecast, by Application 2019 & 2032
- Table 107: Thailand BIPV Industry Revenue (Million) Forecast, by Application 2019 & 2032
- Table 108: Thailand BIPV Industry Volume (Gigawatt) Forecast, by Application 2019 & 2032
- Table 109: Indonesia BIPV Industry Revenue (Million) Forecast, by Application 2019 & 2032
- Table 110: Indonesia BIPV Industry Volume (Gigawatt) Forecast, by Application 2019 & 2032
- Table 111: Vietnam BIPV Industry Revenue (Million) Forecast, by Application 2019 & 2032
- Table 112: Vietnam BIPV Industry Volume (Gigawatt) Forecast, by Application 2019 & 2032
- Table 113: Rest of Asia Pacific BIPV Industry Revenue (Million) Forecast, by Application 2019 & 2032
- Table 114: Rest of Asia Pacific BIPV Industry Volume (Gigawatt) Forecast, by Application 2019 & 2032
- Table 115: Global BIPV Industry Revenue Million Forecast, by Type 2019 & 2032
- Table 116: Global BIPV Industry Volume Gigawatt Forecast, by Type 2019 & 2032
- Table 117: Global BIPV Industry Revenue Million Forecast, by End User 2019 & 2032
- Table 118: Global BIPV Industry Volume Gigawatt Forecast, by End User 2019 & 2032
- Table 119: Global BIPV Industry Revenue Million Forecast, by Country 2019 & 2032
- Table 120: Global BIPV Industry Volume Gigawatt Forecast, by Country 2019 & 2032
- Table 121: Brazil BIPV Industry Revenue (Million) Forecast, by Application 2019 & 2032
- Table 122: Brazil BIPV Industry Volume (Gigawatt) Forecast, by Application 2019 & 2032
- Table 123: Argentina BIPV Industry Revenue (Million) Forecast, by Application 2019 & 2032
- Table 124: Argentina BIPV Industry Volume (Gigawatt) Forecast, by Application 2019 & 2032
- Table 125: Colombia BIPV Industry Revenue (Million) Forecast, by Application 2019 & 2032
- Table 126: Colombia BIPV Industry Volume (Gigawatt) Forecast, by Application 2019 & 2032
- Table 127: Rest of South America BIPV Industry Revenue (Million) Forecast, by Application 2019 & 2032
- Table 128: Rest of South America BIPV Industry Volume (Gigawatt) Forecast, by Application 2019 & 2032
- Table 129: Global BIPV Industry Revenue Million Forecast, by Type 2019 & 2032
- Table 130: Global BIPV Industry Volume Gigawatt Forecast, by Type 2019 & 2032
- Table 131: Global BIPV Industry Revenue Million Forecast, by End User 2019 & 2032
- Table 132: Global BIPV Industry Volume Gigawatt Forecast, by End User 2019 & 2032
- Table 133: Global BIPV Industry Revenue Million Forecast, by Country 2019 & 2032
- Table 134: Global BIPV Industry Volume Gigawatt Forecast, by Country 2019 & 2032
- Table 135: Saudi Arabia BIPV Industry Revenue (Million) Forecast, by Application 2019 & 2032
- Table 136: Saudi Arabia BIPV Industry Volume (Gigawatt) Forecast, by Application 2019 & 2032
- Table 137: United Arab Emirates BIPV Industry Revenue (Million) Forecast, by Application 2019 & 2032
- Table 138: United Arab Emirates BIPV Industry Volume (Gigawatt) Forecast, by Application 2019 & 2032
- Table 139: South Africa BIPV Industry Revenue (Million) Forecast, by Application 2019 & 2032
- Table 140: South Africa BIPV Industry Volume (Gigawatt) Forecast, by Application 2019 & 2032
- Table 141: Nigeria BIPV Industry Revenue (Million) Forecast, by Application 2019 & 2032
- Table 142: Nigeria BIPV Industry Volume (Gigawatt) Forecast, by Application 2019 & 2032
- Table 143: Qatar BIPV Industry Revenue (Million) Forecast, by Application 2019 & 2032
- Table 144: Qatar BIPV Industry Volume (Gigawatt) Forecast, by Application 2019 & 2032
- Table 145: Egypt BIPV Industry Revenue (Million) Forecast, by Application 2019 & 2032
- Table 146: Egypt BIPV Industry Volume (Gigawatt) Forecast, by Application 2019 & 2032
- Table 147: Rest of Middle East and Africa BIPV Industry Revenue (Million) Forecast, by Application 2019 & 2032
- Table 148: Rest of Middle East and Africa BIPV Industry Volume (Gigawatt) Forecast, by Application 2019 & 2032
Frequently Asked Questions
1. What is the projected Compound Annual Growth Rate (CAGR) of the BIPV Industry?
The projected CAGR is approximately 14.79%.
2. Which companies are prominent players in the BIPV Industry?
Key companies in the market include Ertex solartechnik GmbH, Merck KGaA, Hanergy Holding Group Ltd, Onyx Solar Group LLC, Polysolar Domestic, Nanoflex Power Corporation, Solarday, AGC Inc, Changzhou Almaden Co Ltd, Issol SA.
3. What are the main segments of the BIPV Industry?
The market segments include Type, End User.
4. Can you provide details about the market size?
The market size is estimated to be USD 6.31 Million as of 2022.
5. What are some drivers contributing to market growth?
4.; Reduction in Energy Bills Due to Self-Power Consumption4.; Increasing Installation of Solar PV Modules in Residential Segment.
6. What are the notable trends driving market growth?
Crystalline PV Expected to Dominate the Market.
7. Are there any restraints impacting market growth?
4.; High Installation Cost as Compared to Rooftop PV Systems.
8. Can you provide examples of recent developments in the market?
April 2023: ArcelorMittal announced joining forces with BP2 to supply low carbon-emissions steel for BP2's new product, the SOLROOF integrated photovoltaic roof. BP2's integrated photovoltaic FIT VOLT panels will likely be produced solely using XCarb recycled and renewably produced steel, obtained using a minimum of 75% scrap steel and providing 100% renewable electricity.
9. What pricing options are available for accessing the report?
Pricing options include single-user, multi-user, and enterprise licenses priced at USD 4750, USD 5250, and USD 8750 respectively.
10. Is the market size provided in terms of value or volume?
The market size is provided in terms of value, measured in Million and volume, measured in Gigawatt.
11. Are there any specific market keywords associated with the report?
Yes, the market keyword associated with the report is "BIPV Industry," which aids in identifying and referencing the specific market segment covered.
12. How do I determine which pricing option suits my needs best?
The pricing options vary based on user requirements and access needs. Individual users may opt for single-user licenses, while businesses requiring broader access may choose multi-user or enterprise licenses for cost-effective access to the report.
13. Are there any additional resources or data provided in the BIPV Industry report?
While the report offers comprehensive insights, it's advisable to review the specific contents or supplementary materials provided to ascertain if additional resources or data are available.
14. How can I stay updated on further developments or reports in the BIPV Industry?
To stay informed about further developments, trends, and reports in the BIPV Industry, consider subscribing to industry newsletters, following relevant companies and organizations, or regularly checking reputable industry news sources and publications.
Methodology
Step 1 - Identification of Relevant Samples Size from Population Database


Step 2 - Approaches for Defining Global Market Size (Value, Volume* & Price*)

Note*: In applicable scenarios
Step 3 - Data Sources
Primary Research
- Web Analytics
- Survey Reports
- Research Institute
- Latest Research Reports
- Opinion Leaders
Secondary Research
- Annual Reports
- White Paper
- Latest Press Release
- Industry Association
- Paid Database
- Investor Presentations

Step 4 - Data Triangulation
Involves using different sources of information in order to increase the validity of a study
These sources are likely to be stakeholders in a program - participants, other researchers, program staff, other community members, and so on.
Then we put all data in single framework & apply various statistical tools to find out the dynamic on the market.
During the analysis stage, feedback from the stakeholder groups would be compared to determine areas of agreement as well as areas of divergence
