

Key Insights
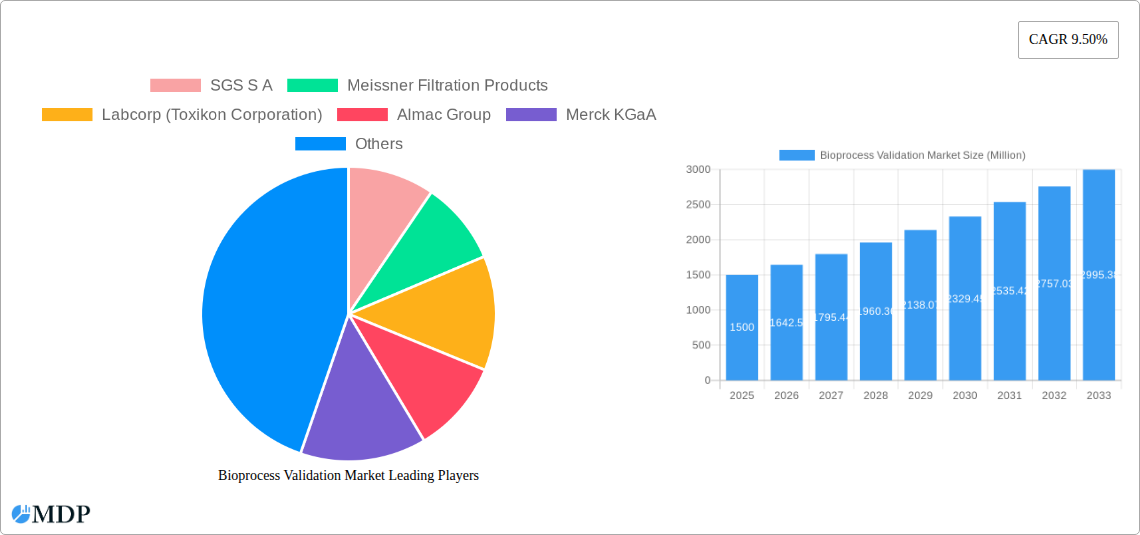
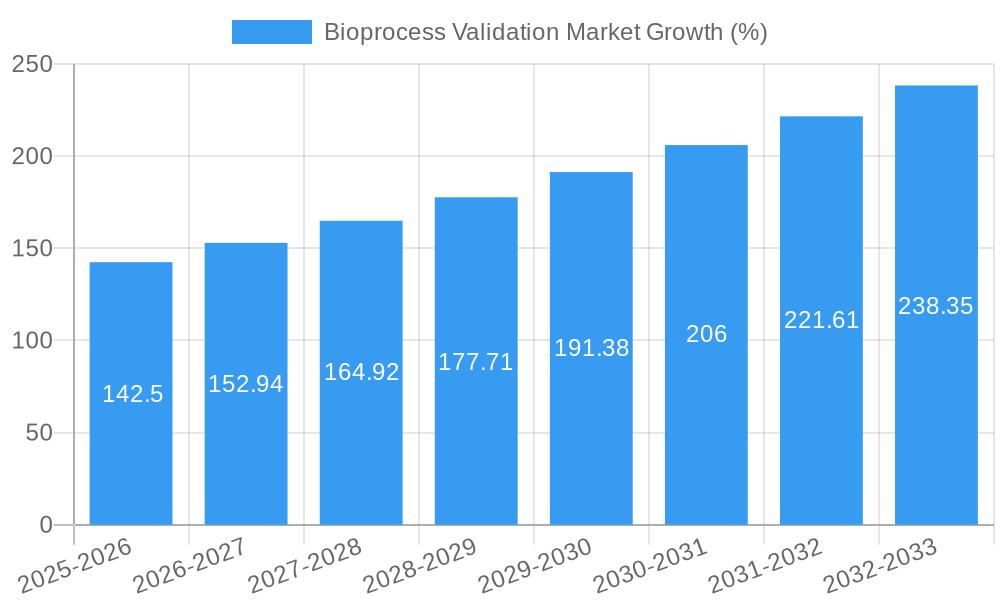
The bioprocess validation market, currently experiencing robust growth, is projected to reach a substantial size, driven by the increasing demand for biopharmaceuticals and advanced therapies. The market's 9.50% CAGR from 2019-2024 indicates strong momentum. Key drivers include the rising prevalence of chronic diseases globally, necessitating innovative drug development and manufacturing processes. Stringent regulatory requirements for biopharmaceutical products further fuel the need for comprehensive validation services, ensuring product quality, safety, and efficacy. Technological advancements, such as automation and digitalization in bioprocessing, are streamlining validation processes and improving efficiency. Growth is further propelled by the expansion of contract development and manufacturing organizations (CDMOs), which rely heavily on external validation services. The market is segmented by test type (extractables, microbiological, physiochemical, integrity, compatibility), process component (filters, containers, bioreactors), and end-user (pharmaceutical companies, CDMOs). The pharmaceutical and biotechnology sector, particularly in North America and Europe, constitutes a significant portion of the market due to robust regulatory frameworks and established biopharmaceutical industries. However, challenges remain, including high costs associated with validation and the complexity of testing various bioprocess components.
Looking ahead, the market is poised for continued expansion. The increasing adoption of continuous manufacturing processes and the development of novel cell and gene therapies will create new opportunities for bioprocess validation service providers. Expansion into emerging markets in Asia Pacific and other regions is also anticipated, driven by growing healthcare spending and increasing investments in biopharmaceutical manufacturing capabilities. Companies specializing in validation services will need to adapt to these trends by investing in advanced technologies and expanding their service portfolios to stay competitive. A strong focus on quality control and regulatory compliance will remain paramount, ensuring patient safety and adherence to industry standards. The competition within the market is intense, with leading players such as SGS, Merck KGaA, and Thermo Fisher Scientific vying for market share through strategic acquisitions, partnerships, and service innovation. The market's future trajectory hinges on advancements in bioprocessing technology, regulatory landscape changes, and the evolving needs of the biopharmaceutical industry.
Bioprocess Validation Market: A Comprehensive Report (2019-2033)
This comprehensive report provides a detailed analysis of the Bioprocess Validation Market, offering invaluable insights for industry stakeholders, investors, and strategic decision-makers. With a study period spanning 2019-2033, a base year of 2025, and a forecast period of 2025-2033, this report offers a robust understanding of historical trends, current market dynamics, and future growth projections. The market is segmented by Test Type, Process Component, and End-User, offering granular analysis across key market drivers. The report incorporates data and analysis to predict a market value of xx Million by 2033.
Bioprocess Validation Market Market Dynamics & Concentration
The Bioprocess Validation Market is characterized by a moderately concentrated landscape, with several key players holding significant market share. The market's growth is driven by factors such as the increasing demand for biopharmaceuticals, stringent regulatory requirements for bioprocess validation, and continuous technological advancements. Innovation plays a crucial role, with companies investing heavily in R&D to develop advanced testing methodologies and equipment. The regulatory landscape, particularly in regions like North America and Europe, significantly impacts market growth, influencing the adoption of new technologies and validation strategies. Product substitutes are limited, with the core focus on ensuring the safety and efficacy of biopharmaceutical products. End-user trends show a growing preference for outsourcing validation services to specialized contract research organizations (CROs), driven by cost-effectiveness and expertise. M&A activities have been moderate over the historical period (2019-2024), with approximately xx M&A deals recorded, leading to xx% market consolidation. Key players like SGS S A, Thermo Fisher Scientific, and Sartorius AG are major players contributing significantly to the market's dynamics.
Bioprocess Validation Market Industry Trends & Analysis
The Bioprocess Validation Market exhibits a robust Compound Annual Growth Rate (CAGR) of xx% during the forecast period (2025-2033), driven by several key factors. The rising prevalence of chronic diseases globally fuels demand for biopharmaceuticals, consequently increasing the need for thorough validation processes. Technological advancements, particularly in automation and data analytics, are enhancing the efficiency and accuracy of bioprocess validation, further driving market growth. Consumer preferences are increasingly focused on the safety and efficacy of biopharmaceuticals, reinforcing the need for rigorous validation procedures. Competitive dynamics are shaped by continuous innovation, strategic partnerships, and the expansion of service offerings by key players. Market penetration of advanced technologies such as AI and machine learning in validation processes is steadily increasing, indicating future trends in automation and cost-optimization. This growth is further supported by the increasing adoption of advanced analytical techniques for extractables and leachables testing and the rise in demand for personalized medicines.
Leading Markets & Segments in Bioprocess Validation Market
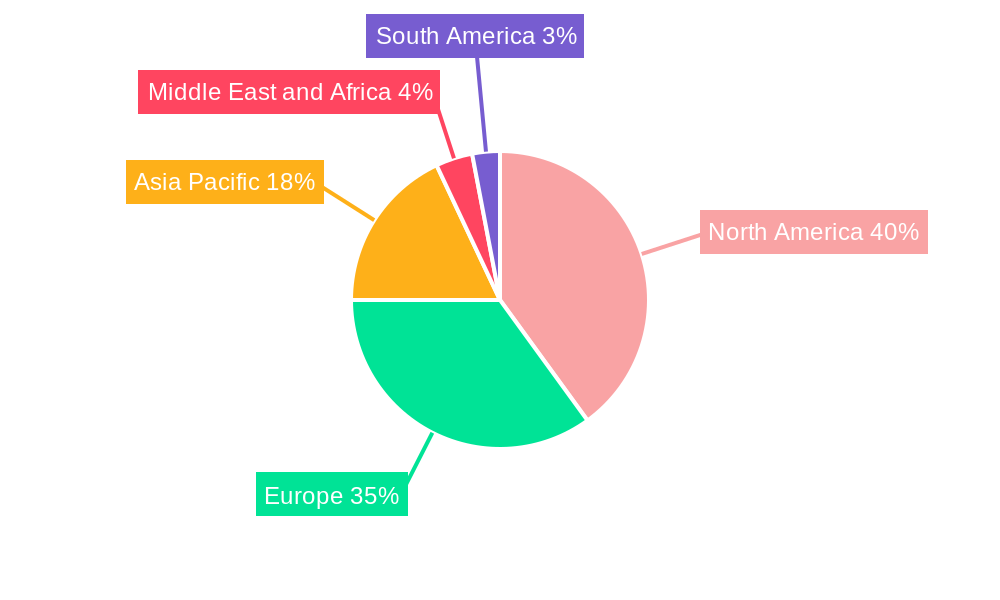
North America currently holds the largest market share, driven by robust pharmaceutical and biotechnology industries, high regulatory standards, and substantial investments in R&D. Within the segments:
By Test Type: Extractables Testing Services and Microbiological Testing Services are the leading segments, benefiting from high regulatory scrutiny and safety concerns.
By Process Component: Filter elements, media containers and bags, and bioreactors are dominating segments, owing to their importance in maintaining product sterility and purity.
By End User: Pharmaceutical & Biotechnology Companies represent the largest market segment due to their extensive biopharmaceutical manufacturing activities.
Key Drivers for North America:
- Stringent regulatory environment driving adoption of validation services
- Strong presence of major pharmaceutical and biotechnology companies
- High investments in research and development activities
Key Drivers for Europe:
- Growing biopharmaceutical manufacturing industry
- Favorable government policies supporting the sector
- Advanced research infrastructure and expertise
Key Drivers for Asia Pacific:
- Rapid expansion of pharmaceutical and biotechnology industries
- Increasing disposable incomes driving greater healthcare spending
- Government initiatives supporting domestic manufacturing
Bioprocess Validation Market Product Developments
Recent years have witnessed significant product innovations in the Bioprocess Validation Market, focusing on the development of more efficient, automated, and accurate testing methods. Companies are integrating advanced technologies like Artificial Intelligence (AI) and Machine Learning (ML) into their validation services to improve data analysis and decision-making. Miniaturized testing systems are becoming increasingly popular, offering cost-effectiveness and reducing the environmental footprint. The focus remains on developing methods that enhance the speed and precision of validation processes, while maintaining regulatory compliance. This continuous improvement in technology and service offerings enhances competitive advantages.
Key Drivers of Bioprocess Validation Market Growth
The growth of the Bioprocess Validation Market is primarily fueled by technological advancements, stringent regulatory requirements, and the rising demand for biopharmaceuticals. The increasing prevalence of chronic diseases globally boosts demand for biopharmaceuticals, necessitating robust validation protocols. Advancements in analytical techniques enable more efficient and precise testing methods. Stringent regulatory frameworks in developed regions mandate thorough validation procedures.
Challenges in the Bioprocess Validation Market Market
Significant challenges confronting the Bioprocess Validation Market include stringent regulatory requirements, which involve substantial investment in compliance. Supply chain disruptions can impact the availability of critical materials and equipment, leading to delays and increased costs. Intense competition among established players and emerging companies exerts pressure on pricing and margins. These factors together can create significant hurdles to growth.
Emerging Opportunities in Bioprocess Validation Market
The Bioprocess Validation Market is poised for substantial growth driven by several exciting opportunities. The development of innovative, faster, and cost-effective validation technologies is a prominent driver. Strategic collaborations between testing service providers and pharmaceutical companies foster efficient validation processes. Expansion into emerging markets with growing biopharmaceutical industries offers significant potential for growth.
Leading Players in the Bioprocess Validation Market Sector
- SGS S A
- Meissner Filtration Products
- Labcorp (Toxikon Corporation)
- Almac Group
- Merck KGaA
- Eurofins Scientific
- Cobetter Filtration Equipments Co Ltd
- Pall Corporation
- Sartorius AG
- Thermo Fisher Scientific
- DOC S r l
Key Milestones in Bioprocess Validation Market Industry
May 2022: Qosina launched its new Bioprocess Resource Center, providing valuable information for the bioprocess industry, promoting best practices and facilitating knowledge sharing.
September 2022: Eppendorf SE expanded its bioprocess site in Jülich, Germany, enhancing production capabilities and bolstering its position in the market. This expansion signals growing investment and confidence in the bioprocess sector.
Strategic Outlook for Bioprocess Validation Market Market
The Bioprocess Validation Market is projected to witness sustained growth, driven by technological advancements, evolving regulatory landscapes, and a persistently high demand for biopharmaceuticals. Strategic opportunities exist for companies to invest in innovative technologies, establish strategic partnerships, and expand into emerging markets. Focus on developing efficient and cost-effective validation solutions will be crucial to maintain a competitive edge in this rapidly evolving market.
Bioprocess Validation Market Segmentation
-
1. Test Type
- 1.1. Extractables Testing Services
- 1.2. Microbiological Testing Services
- 1.3. Physiochemical Testing Services
- 1.4. Integrity Testing Services
- 1.5. Compatibility Testing Services
- 1.6. Other Testing Services
-
2. Process Component
- 2.1. Filter Elements
- 2.2. Media containers and bags
- 2.3. Freezing And Thawing Process Bags
- 2.4. Mixing Systems
- 2.5. Bioreactors
- 2.6. Transfer Systems
- 2.7. Others
-
3. End User
- 3.1. Pharmaceutical & Biotechnology Companies
- 3.2. Contract Development & Manufacturing Organizations
- 3.3. Other End Users
Bioprocess Validation Market Segmentation By Geography
-
1. North America
- 1.1. United States
- 1.2. Canada
- 1.3. Mexico
-
2. Europe
- 2.1. Germany
- 2.2. United Kingdom
- 2.3. France
- 2.4. Italy
- 2.5. Spain
- 2.6. Rest of Europe
-
3. Asia Pacific
- 3.1. China
- 3.2. Japan
- 3.3. India
- 3.4. Australia
- 3.5. South Korea
- 3.6. Rest of Asia Pacific
-
4. Middle East and Africa
- 4.1. GCC
- 4.2. South Africa
- 4.3. Rest of Middle East and Africa
-
5. South America
- 5.1. Brazil
- 5.2. Argentina
- 5.3. Rest of South America
Bioprocess Validation Market REPORT HIGHLIGHTS
| Aspects | Details |
|---|---|
| Study Period | 2019-2033 |
| Base Year | 2024 |
| Estimated Year | 2025 |
| Forecast Period | 2025-2033 |
| Historical Period | 2019-2024 |
| Growth Rate | CAGR of 9.50% from 2019-2033 |
| Segmentation |
|
Table of Contents
- 1. Introduction
- 1.1. Research Scope
- 1.2. Market Segmentation
- 1.3. Research Methodology
- 1.4. Definitions and Assumptions
- 2. Executive Summary
- 2.1. Introduction
- 3. Market Dynamics
- 3.1. Introduction
- 3.2. Market Drivers
- 3.2.1. Increasing Demand for Biopharmaceuticals; Increasing Demand for Outsourcing Bioprocess Validation; Rising Life Science R&D Expenditure
- 3.3. Market Restrains
- 3.3.1. Issues Related to Extractables & Leachables
- 3.4. Market Trends
- 3.4.1. Bioreactor Expected to Hold Significant Market Share
- 4. Market Factor Analysis
- 4.1. Porters Five Forces
- 4.2. Supply/Value Chain
- 4.3. PESTEL analysis
- 4.4. Market Entropy
- 4.5. Patent/Trademark Analysis
- 5. Global Bioprocess Validation Market Analysis, Insights and Forecast, 2019-2031
- 5.1. Market Analysis, Insights and Forecast - by Test Type
- 5.1.1. Extractables Testing Services
- 5.1.2. Microbiological Testing Services
- 5.1.3. Physiochemical Testing Services
- 5.1.4. Integrity Testing Services
- 5.1.5. Compatibility Testing Services
- 5.1.6. Other Testing Services
- 5.2. Market Analysis, Insights and Forecast - by Process Component
- 5.2.1. Filter Elements
- 5.2.2. Media containers and bags
- 5.2.3. Freezing And Thawing Process Bags
- 5.2.4. Mixing Systems
- 5.2.5. Bioreactors
- 5.2.6. Transfer Systems
- 5.2.7. Others
- 5.3. Market Analysis, Insights and Forecast - by End User
- 5.3.1. Pharmaceutical & Biotechnology Companies
- 5.3.2. Contract Development & Manufacturing Organizations
- 5.3.3. Other End Users
- 5.4. Market Analysis, Insights and Forecast - by Region
- 5.4.1. North America
- 5.4.2. Europe
- 5.4.3. Asia Pacific
- 5.4.4. Middle East and Africa
- 5.4.5. South America
- 5.1. Market Analysis, Insights and Forecast - by Test Type
- 6. North America Bioprocess Validation Market Analysis, Insights and Forecast, 2019-2031
- 6.1. Market Analysis, Insights and Forecast - by Test Type
- 6.1.1. Extractables Testing Services
- 6.1.2. Microbiological Testing Services
- 6.1.3. Physiochemical Testing Services
- 6.1.4. Integrity Testing Services
- 6.1.5. Compatibility Testing Services
- 6.1.6. Other Testing Services
- 6.2. Market Analysis, Insights and Forecast - by Process Component
- 6.2.1. Filter Elements
- 6.2.2. Media containers and bags
- 6.2.3. Freezing And Thawing Process Bags
- 6.2.4. Mixing Systems
- 6.2.5. Bioreactors
- 6.2.6. Transfer Systems
- 6.2.7. Others
- 6.3. Market Analysis, Insights and Forecast - by End User
- 6.3.1. Pharmaceutical & Biotechnology Companies
- 6.3.2. Contract Development & Manufacturing Organizations
- 6.3.3. Other End Users
- 6.1. Market Analysis, Insights and Forecast - by Test Type
- 7. Europe Bioprocess Validation Market Analysis, Insights and Forecast, 2019-2031
- 7.1. Market Analysis, Insights and Forecast - by Test Type
- 7.1.1. Extractables Testing Services
- 7.1.2. Microbiological Testing Services
- 7.1.3. Physiochemical Testing Services
- 7.1.4. Integrity Testing Services
- 7.1.5. Compatibility Testing Services
- 7.1.6. Other Testing Services
- 7.2. Market Analysis, Insights and Forecast - by Process Component
- 7.2.1. Filter Elements
- 7.2.2. Media containers and bags
- 7.2.3. Freezing And Thawing Process Bags
- 7.2.4. Mixing Systems
- 7.2.5. Bioreactors
- 7.2.6. Transfer Systems
- 7.2.7. Others
- 7.3. Market Analysis, Insights and Forecast - by End User
- 7.3.1. Pharmaceutical & Biotechnology Companies
- 7.3.2. Contract Development & Manufacturing Organizations
- 7.3.3. Other End Users
- 7.1. Market Analysis, Insights and Forecast - by Test Type
- 8. Asia Pacific Bioprocess Validation Market Analysis, Insights and Forecast, 2019-2031
- 8.1. Market Analysis, Insights and Forecast - by Test Type
- 8.1.1. Extractables Testing Services
- 8.1.2. Microbiological Testing Services
- 8.1.3. Physiochemical Testing Services
- 8.1.4. Integrity Testing Services
- 8.1.5. Compatibility Testing Services
- 8.1.6. Other Testing Services
- 8.2. Market Analysis, Insights and Forecast - by Process Component
- 8.2.1. Filter Elements
- 8.2.2. Media containers and bags
- 8.2.3. Freezing And Thawing Process Bags
- 8.2.4. Mixing Systems
- 8.2.5. Bioreactors
- 8.2.6. Transfer Systems
- 8.2.7. Others
- 8.3. Market Analysis, Insights and Forecast - by End User
- 8.3.1. Pharmaceutical & Biotechnology Companies
- 8.3.2. Contract Development & Manufacturing Organizations
- 8.3.3. Other End Users
- 8.1. Market Analysis, Insights and Forecast - by Test Type
- 9. Middle East and Africa Bioprocess Validation Market Analysis, Insights and Forecast, 2019-2031
- 9.1. Market Analysis, Insights and Forecast - by Test Type
- 9.1.1. Extractables Testing Services
- 9.1.2. Microbiological Testing Services
- 9.1.3. Physiochemical Testing Services
- 9.1.4. Integrity Testing Services
- 9.1.5. Compatibility Testing Services
- 9.1.6. Other Testing Services
- 9.2. Market Analysis, Insights and Forecast - by Process Component
- 9.2.1. Filter Elements
- 9.2.2. Media containers and bags
- 9.2.3. Freezing And Thawing Process Bags
- 9.2.4. Mixing Systems
- 9.2.5. Bioreactors
- 9.2.6. Transfer Systems
- 9.2.7. Others
- 9.3. Market Analysis, Insights and Forecast - by End User
- 9.3.1. Pharmaceutical & Biotechnology Companies
- 9.3.2. Contract Development & Manufacturing Organizations
- 9.3.3. Other End Users
- 9.1. Market Analysis, Insights and Forecast - by Test Type
- 10. South America Bioprocess Validation Market Analysis, Insights and Forecast, 2019-2031
- 10.1. Market Analysis, Insights and Forecast - by Test Type
- 10.1.1. Extractables Testing Services
- 10.1.2. Microbiological Testing Services
- 10.1.3. Physiochemical Testing Services
- 10.1.4. Integrity Testing Services
- 10.1.5. Compatibility Testing Services
- 10.1.6. Other Testing Services
- 10.2. Market Analysis, Insights and Forecast - by Process Component
- 10.2.1. Filter Elements
- 10.2.2. Media containers and bags
- 10.2.3. Freezing And Thawing Process Bags
- 10.2.4. Mixing Systems
- 10.2.5. Bioreactors
- 10.2.6. Transfer Systems
- 10.2.7. Others
- 10.3. Market Analysis, Insights and Forecast - by End User
- 10.3.1. Pharmaceutical & Biotechnology Companies
- 10.3.2. Contract Development & Manufacturing Organizations
- 10.3.3. Other End Users
- 10.1. Market Analysis, Insights and Forecast - by Test Type
- 11. North America Bioprocess Validation Market Analysis, Insights and Forecast, 2019-2031
- 11.1. Market Analysis, Insights and Forecast - By Country/Sub-region
- 11.1.1 United States
- 11.1.2 Canada
- 11.1.3 Mexico
- 12. Europe Bioprocess Validation Market Analysis, Insights and Forecast, 2019-2031
- 12.1. Market Analysis, Insights and Forecast - By Country/Sub-region
- 12.1.1 Germany
- 12.1.2 United Kingdom
- 12.1.3 France
- 12.1.4 Italy
- 12.1.5 Spain
- 12.1.6 Rest of Europe
- 13. Asia Pacific Bioprocess Validation Market Analysis, Insights and Forecast, 2019-2031
- 13.1. Market Analysis, Insights and Forecast - By Country/Sub-region
- 13.1.1 China
- 13.1.2 Japan
- 13.1.3 India
- 13.1.4 Australia
- 13.1.5 South Korea
- 13.1.6 Rest of Asia Pacific
- 14. Middle East and Africa Bioprocess Validation Market Analysis, Insights and Forecast, 2019-2031
- 14.1. Market Analysis, Insights and Forecast - By Country/Sub-region
- 14.1.1 GCC
- 14.1.2 South Africa
- 14.1.3 Rest of Middle East and Africa
- 15. South America Bioprocess Validation Market Analysis, Insights and Forecast, 2019-2031
- 15.1. Market Analysis, Insights and Forecast - By Country/Sub-region
- 15.1.1 Brazil
- 15.1.2 Argentina
- 15.1.3 Rest of South America
- 16. Competitive Analysis
- 16.1. Global Market Share Analysis 2024
- 16.2. Company Profiles
- 16.2.1 SGS S A
- 16.2.1.1. Overview
- 16.2.1.2. Products
- 16.2.1.3. SWOT Analysis
- 16.2.1.4. Recent Developments
- 16.2.1.5. Financials (Based on Availability)
- 16.2.2 Meissner Filtration Products
- 16.2.2.1. Overview
- 16.2.2.2. Products
- 16.2.2.3. SWOT Analysis
- 16.2.2.4. Recent Developments
- 16.2.2.5. Financials (Based on Availability)
- 16.2.3 Labcorp (Toxikon Corporation)
- 16.2.3.1. Overview
- 16.2.3.2. Products
- 16.2.3.3. SWOT Analysis
- 16.2.3.4. Recent Developments
- 16.2.3.5. Financials (Based on Availability)
- 16.2.4 Almac Group
- 16.2.4.1. Overview
- 16.2.4.2. Products
- 16.2.4.3. SWOT Analysis
- 16.2.4.4. Recent Developments
- 16.2.4.5. Financials (Based on Availability)
- 16.2.5 Merck KGaA
- 16.2.5.1. Overview
- 16.2.5.2. Products
- 16.2.5.3. SWOT Analysis
- 16.2.5.4. Recent Developments
- 16.2.5.5. Financials (Based on Availability)
- 16.2.6 Eurofins Scientific
- 16.2.6.1. Overview
- 16.2.6.2. Products
- 16.2.6.3. SWOT Analysis
- 16.2.6.4. Recent Developments
- 16.2.6.5. Financials (Based on Availability)
- 16.2.7 Cobetter Filtration Equipments Co Ltd
- 16.2.7.1. Overview
- 16.2.7.2. Products
- 16.2.7.3. SWOT Analysis
- 16.2.7.4. Recent Developments
- 16.2.7.5. Financials (Based on Availability)
- 16.2.8 Pall Corporation
- 16.2.8.1. Overview
- 16.2.8.2. Products
- 16.2.8.3. SWOT Analysis
- 16.2.8.4. Recent Developments
- 16.2.8.5. Financials (Based on Availability)
- 16.2.9 Sartorius AG
- 16.2.9.1. Overview
- 16.2.9.2. Products
- 16.2.9.3. SWOT Analysis
- 16.2.9.4. Recent Developments
- 16.2.9.5. Financials (Based on Availability)
- 16.2.10 Thermo Fisher Scientific
- 16.2.10.1. Overview
- 16.2.10.2. Products
- 16.2.10.3. SWOT Analysis
- 16.2.10.4. Recent Developments
- 16.2.10.5. Financials (Based on Availability)
- 16.2.11 DOC S r l
- 16.2.11.1. Overview
- 16.2.11.2. Products
- 16.2.11.3. SWOT Analysis
- 16.2.11.4. Recent Developments
- 16.2.11.5. Financials (Based on Availability)
- 16.2.1 SGS S A
List of Figures
- Figure 1: Global Bioprocess Validation Market Revenue Breakdown (Million, %) by Region 2024 & 2032
- Figure 2: Global Bioprocess Validation Market Volume Breakdown (K Unit, %) by Region 2024 & 2032
- Figure 3: North America Bioprocess Validation Market Revenue (Million), by Country 2024 & 2032
- Figure 4: North America Bioprocess Validation Market Volume (K Unit), by Country 2024 & 2032
- Figure 5: North America Bioprocess Validation Market Revenue Share (%), by Country 2024 & 2032
- Figure 6: North America Bioprocess Validation Market Volume Share (%), by Country 2024 & 2032
- Figure 7: Europe Bioprocess Validation Market Revenue (Million), by Country 2024 & 2032
- Figure 8: Europe Bioprocess Validation Market Volume (K Unit), by Country 2024 & 2032
- Figure 9: Europe Bioprocess Validation Market Revenue Share (%), by Country 2024 & 2032
- Figure 10: Europe Bioprocess Validation Market Volume Share (%), by Country 2024 & 2032
- Figure 11: Asia Pacific Bioprocess Validation Market Revenue (Million), by Country 2024 & 2032
- Figure 12: Asia Pacific Bioprocess Validation Market Volume (K Unit), by Country 2024 & 2032
- Figure 13: Asia Pacific Bioprocess Validation Market Revenue Share (%), by Country 2024 & 2032
- Figure 14: Asia Pacific Bioprocess Validation Market Volume Share (%), by Country 2024 & 2032
- Figure 15: Middle East and Africa Bioprocess Validation Market Revenue (Million), by Country 2024 & 2032
- Figure 16: Middle East and Africa Bioprocess Validation Market Volume (K Unit), by Country 2024 & 2032
- Figure 17: Middle East and Africa Bioprocess Validation Market Revenue Share (%), by Country 2024 & 2032
- Figure 18: Middle East and Africa Bioprocess Validation Market Volume Share (%), by Country 2024 & 2032
- Figure 19: South America Bioprocess Validation Market Revenue (Million), by Country 2024 & 2032
- Figure 20: South America Bioprocess Validation Market Volume (K Unit), by Country 2024 & 2032
- Figure 21: South America Bioprocess Validation Market Revenue Share (%), by Country 2024 & 2032
- Figure 22: South America Bioprocess Validation Market Volume Share (%), by Country 2024 & 2032
- Figure 23: North America Bioprocess Validation Market Revenue (Million), by Test Type 2024 & 2032
- Figure 24: North America Bioprocess Validation Market Volume (K Unit), by Test Type 2024 & 2032
- Figure 25: North America Bioprocess Validation Market Revenue Share (%), by Test Type 2024 & 2032
- Figure 26: North America Bioprocess Validation Market Volume Share (%), by Test Type 2024 & 2032
- Figure 27: North America Bioprocess Validation Market Revenue (Million), by Process Component 2024 & 2032
- Figure 28: North America Bioprocess Validation Market Volume (K Unit), by Process Component 2024 & 2032
- Figure 29: North America Bioprocess Validation Market Revenue Share (%), by Process Component 2024 & 2032
- Figure 30: North America Bioprocess Validation Market Volume Share (%), by Process Component 2024 & 2032
- Figure 31: North America Bioprocess Validation Market Revenue (Million), by End User 2024 & 2032
- Figure 32: North America Bioprocess Validation Market Volume (K Unit), by End User 2024 & 2032
- Figure 33: North America Bioprocess Validation Market Revenue Share (%), by End User 2024 & 2032
- Figure 34: North America Bioprocess Validation Market Volume Share (%), by End User 2024 & 2032
- Figure 35: North America Bioprocess Validation Market Revenue (Million), by Country 2024 & 2032
- Figure 36: North America Bioprocess Validation Market Volume (K Unit), by Country 2024 & 2032
- Figure 37: North America Bioprocess Validation Market Revenue Share (%), by Country 2024 & 2032
- Figure 38: North America Bioprocess Validation Market Volume Share (%), by Country 2024 & 2032
- Figure 39: Europe Bioprocess Validation Market Revenue (Million), by Test Type 2024 & 2032
- Figure 40: Europe Bioprocess Validation Market Volume (K Unit), by Test Type 2024 & 2032
- Figure 41: Europe Bioprocess Validation Market Revenue Share (%), by Test Type 2024 & 2032
- Figure 42: Europe Bioprocess Validation Market Volume Share (%), by Test Type 2024 & 2032
- Figure 43: Europe Bioprocess Validation Market Revenue (Million), by Process Component 2024 & 2032
- Figure 44: Europe Bioprocess Validation Market Volume (K Unit), by Process Component 2024 & 2032
- Figure 45: Europe Bioprocess Validation Market Revenue Share (%), by Process Component 2024 & 2032
- Figure 46: Europe Bioprocess Validation Market Volume Share (%), by Process Component 2024 & 2032
- Figure 47: Europe Bioprocess Validation Market Revenue (Million), by End User 2024 & 2032
- Figure 48: Europe Bioprocess Validation Market Volume (K Unit), by End User 2024 & 2032
- Figure 49: Europe Bioprocess Validation Market Revenue Share (%), by End User 2024 & 2032
- Figure 50: Europe Bioprocess Validation Market Volume Share (%), by End User 2024 & 2032
- Figure 51: Europe Bioprocess Validation Market Revenue (Million), by Country 2024 & 2032
- Figure 52: Europe Bioprocess Validation Market Volume (K Unit), by Country 2024 & 2032
- Figure 53: Europe Bioprocess Validation Market Revenue Share (%), by Country 2024 & 2032
- Figure 54: Europe Bioprocess Validation Market Volume Share (%), by Country 2024 & 2032
- Figure 55: Asia Pacific Bioprocess Validation Market Revenue (Million), by Test Type 2024 & 2032
- Figure 56: Asia Pacific Bioprocess Validation Market Volume (K Unit), by Test Type 2024 & 2032
- Figure 57: Asia Pacific Bioprocess Validation Market Revenue Share (%), by Test Type 2024 & 2032
- Figure 58: Asia Pacific Bioprocess Validation Market Volume Share (%), by Test Type 2024 & 2032
- Figure 59: Asia Pacific Bioprocess Validation Market Revenue (Million), by Process Component 2024 & 2032
- Figure 60: Asia Pacific Bioprocess Validation Market Volume (K Unit), by Process Component 2024 & 2032
- Figure 61: Asia Pacific Bioprocess Validation Market Revenue Share (%), by Process Component 2024 & 2032
- Figure 62: Asia Pacific Bioprocess Validation Market Volume Share (%), by Process Component 2024 & 2032
- Figure 63: Asia Pacific Bioprocess Validation Market Revenue (Million), by End User 2024 & 2032
- Figure 64: Asia Pacific Bioprocess Validation Market Volume (K Unit), by End User 2024 & 2032
- Figure 65: Asia Pacific Bioprocess Validation Market Revenue Share (%), by End User 2024 & 2032
- Figure 66: Asia Pacific Bioprocess Validation Market Volume Share (%), by End User 2024 & 2032
- Figure 67: Asia Pacific Bioprocess Validation Market Revenue (Million), by Country 2024 & 2032
- Figure 68: Asia Pacific Bioprocess Validation Market Volume (K Unit), by Country 2024 & 2032
- Figure 69: Asia Pacific Bioprocess Validation Market Revenue Share (%), by Country 2024 & 2032
- Figure 70: Asia Pacific Bioprocess Validation Market Volume Share (%), by Country 2024 & 2032
- Figure 71: Middle East and Africa Bioprocess Validation Market Revenue (Million), by Test Type 2024 & 2032
- Figure 72: Middle East and Africa Bioprocess Validation Market Volume (K Unit), by Test Type 2024 & 2032
- Figure 73: Middle East and Africa Bioprocess Validation Market Revenue Share (%), by Test Type 2024 & 2032
- Figure 74: Middle East and Africa Bioprocess Validation Market Volume Share (%), by Test Type 2024 & 2032
- Figure 75: Middle East and Africa Bioprocess Validation Market Revenue (Million), by Process Component 2024 & 2032
- Figure 76: Middle East and Africa Bioprocess Validation Market Volume (K Unit), by Process Component 2024 & 2032
- Figure 77: Middle East and Africa Bioprocess Validation Market Revenue Share (%), by Process Component 2024 & 2032
- Figure 78: Middle East and Africa Bioprocess Validation Market Volume Share (%), by Process Component 2024 & 2032
- Figure 79: Middle East and Africa Bioprocess Validation Market Revenue (Million), by End User 2024 & 2032
- Figure 80: Middle East and Africa Bioprocess Validation Market Volume (K Unit), by End User 2024 & 2032
- Figure 81: Middle East and Africa Bioprocess Validation Market Revenue Share (%), by End User 2024 & 2032
- Figure 82: Middle East and Africa Bioprocess Validation Market Volume Share (%), by End User 2024 & 2032
- Figure 83: Middle East and Africa Bioprocess Validation Market Revenue (Million), by Country 2024 & 2032
- Figure 84: Middle East and Africa Bioprocess Validation Market Volume (K Unit), by Country 2024 & 2032
- Figure 85: Middle East and Africa Bioprocess Validation Market Revenue Share (%), by Country 2024 & 2032
- Figure 86: Middle East and Africa Bioprocess Validation Market Volume Share (%), by Country 2024 & 2032
- Figure 87: South America Bioprocess Validation Market Revenue (Million), by Test Type 2024 & 2032
- Figure 88: South America Bioprocess Validation Market Volume (K Unit), by Test Type 2024 & 2032
- Figure 89: South America Bioprocess Validation Market Revenue Share (%), by Test Type 2024 & 2032
- Figure 90: South America Bioprocess Validation Market Volume Share (%), by Test Type 2024 & 2032
- Figure 91: South America Bioprocess Validation Market Revenue (Million), by Process Component 2024 & 2032
- Figure 92: South America Bioprocess Validation Market Volume (K Unit), by Process Component 2024 & 2032
- Figure 93: South America Bioprocess Validation Market Revenue Share (%), by Process Component 2024 & 2032
- Figure 94: South America Bioprocess Validation Market Volume Share (%), by Process Component 2024 & 2032
- Figure 95: South America Bioprocess Validation Market Revenue (Million), by End User 2024 & 2032
- Figure 96: South America Bioprocess Validation Market Volume (K Unit), by End User 2024 & 2032
- Figure 97: South America Bioprocess Validation Market Revenue Share (%), by End User 2024 & 2032
- Figure 98: South America Bioprocess Validation Market Volume Share (%), by End User 2024 & 2032
- Figure 99: South America Bioprocess Validation Market Revenue (Million), by Country 2024 & 2032
- Figure 100: South America Bioprocess Validation Market Volume (K Unit), by Country 2024 & 2032
- Figure 101: South America Bioprocess Validation Market Revenue Share (%), by Country 2024 & 2032
- Figure 102: South America Bioprocess Validation Market Volume Share (%), by Country 2024 & 2032
List of Tables
- Table 1: Global Bioprocess Validation Market Revenue Million Forecast, by Region 2019 & 2032
- Table 2: Global Bioprocess Validation Market Volume K Unit Forecast, by Region 2019 & 2032
- Table 3: Global Bioprocess Validation Market Revenue Million Forecast, by Test Type 2019 & 2032
- Table 4: Global Bioprocess Validation Market Volume K Unit Forecast, by Test Type 2019 & 2032
- Table 5: Global Bioprocess Validation Market Revenue Million Forecast, by Process Component 2019 & 2032
- Table 6: Global Bioprocess Validation Market Volume K Unit Forecast, by Process Component 2019 & 2032
- Table 7: Global Bioprocess Validation Market Revenue Million Forecast, by End User 2019 & 2032
- Table 8: Global Bioprocess Validation Market Volume K Unit Forecast, by End User 2019 & 2032
- Table 9: Global Bioprocess Validation Market Revenue Million Forecast, by Region 2019 & 2032
- Table 10: Global Bioprocess Validation Market Volume K Unit Forecast, by Region 2019 & 2032
- Table 11: Global Bioprocess Validation Market Revenue Million Forecast, by Country 2019 & 2032
- Table 12: Global Bioprocess Validation Market Volume K Unit Forecast, by Country 2019 & 2032
- Table 13: United States Bioprocess Validation Market Revenue (Million) Forecast, by Application 2019 & 2032
- Table 14: United States Bioprocess Validation Market Volume (K Unit) Forecast, by Application 2019 & 2032
- Table 15: Canada Bioprocess Validation Market Revenue (Million) Forecast, by Application 2019 & 2032
- Table 16: Canada Bioprocess Validation Market Volume (K Unit) Forecast, by Application 2019 & 2032
- Table 17: Mexico Bioprocess Validation Market Revenue (Million) Forecast, by Application 2019 & 2032
- Table 18: Mexico Bioprocess Validation Market Volume (K Unit) Forecast, by Application 2019 & 2032
- Table 19: Global Bioprocess Validation Market Revenue Million Forecast, by Country 2019 & 2032
- Table 20: Global Bioprocess Validation Market Volume K Unit Forecast, by Country 2019 & 2032
- Table 21: Germany Bioprocess Validation Market Revenue (Million) Forecast, by Application 2019 & 2032
- Table 22: Germany Bioprocess Validation Market Volume (K Unit) Forecast, by Application 2019 & 2032
- Table 23: United Kingdom Bioprocess Validation Market Revenue (Million) Forecast, by Application 2019 & 2032
- Table 24: United Kingdom Bioprocess Validation Market Volume (K Unit) Forecast, by Application 2019 & 2032
- Table 25: France Bioprocess Validation Market Revenue (Million) Forecast, by Application 2019 & 2032
- Table 26: France Bioprocess Validation Market Volume (K Unit) Forecast, by Application 2019 & 2032
- Table 27: Italy Bioprocess Validation Market Revenue (Million) Forecast, by Application 2019 & 2032
- Table 28: Italy Bioprocess Validation Market Volume (K Unit) Forecast, by Application 2019 & 2032
- Table 29: Spain Bioprocess Validation Market Revenue (Million) Forecast, by Application 2019 & 2032
- Table 30: Spain Bioprocess Validation Market Volume (K Unit) Forecast, by Application 2019 & 2032
- Table 31: Rest of Europe Bioprocess Validation Market Revenue (Million) Forecast, by Application 2019 & 2032
- Table 32: Rest of Europe Bioprocess Validation Market Volume (K Unit) Forecast, by Application 2019 & 2032
- Table 33: Global Bioprocess Validation Market Revenue Million Forecast, by Country 2019 & 2032
- Table 34: Global Bioprocess Validation Market Volume K Unit Forecast, by Country 2019 & 2032
- Table 35: China Bioprocess Validation Market Revenue (Million) Forecast, by Application 2019 & 2032
- Table 36: China Bioprocess Validation Market Volume (K Unit) Forecast, by Application 2019 & 2032
- Table 37: Japan Bioprocess Validation Market Revenue (Million) Forecast, by Application 2019 & 2032
- Table 38: Japan Bioprocess Validation Market Volume (K Unit) Forecast, by Application 2019 & 2032
- Table 39: India Bioprocess Validation Market Revenue (Million) Forecast, by Application 2019 & 2032
- Table 40: India Bioprocess Validation Market Volume (K Unit) Forecast, by Application 2019 & 2032
- Table 41: Australia Bioprocess Validation Market Revenue (Million) Forecast, by Application 2019 & 2032
- Table 42: Australia Bioprocess Validation Market Volume (K Unit) Forecast, by Application 2019 & 2032
- Table 43: South Korea Bioprocess Validation Market Revenue (Million) Forecast, by Application 2019 & 2032
- Table 44: South Korea Bioprocess Validation Market Volume (K Unit) Forecast, by Application 2019 & 2032
- Table 45: Rest of Asia Pacific Bioprocess Validation Market Revenue (Million) Forecast, by Application 2019 & 2032
- Table 46: Rest of Asia Pacific Bioprocess Validation Market Volume (K Unit) Forecast, by Application 2019 & 2032
- Table 47: Global Bioprocess Validation Market Revenue Million Forecast, by Country 2019 & 2032
- Table 48: Global Bioprocess Validation Market Volume K Unit Forecast, by Country 2019 & 2032
- Table 49: GCC Bioprocess Validation Market Revenue (Million) Forecast, by Application 2019 & 2032
- Table 50: GCC Bioprocess Validation Market Volume (K Unit) Forecast, by Application 2019 & 2032
- Table 51: South Africa Bioprocess Validation Market Revenue (Million) Forecast, by Application 2019 & 2032
- Table 52: South Africa Bioprocess Validation Market Volume (K Unit) Forecast, by Application 2019 & 2032
- Table 53: Rest of Middle East and Africa Bioprocess Validation Market Revenue (Million) Forecast, by Application 2019 & 2032
- Table 54: Rest of Middle East and Africa Bioprocess Validation Market Volume (K Unit) Forecast, by Application 2019 & 2032
- Table 55: Global Bioprocess Validation Market Revenue Million Forecast, by Country 2019 & 2032
- Table 56: Global Bioprocess Validation Market Volume K Unit Forecast, by Country 2019 & 2032
- Table 57: Brazil Bioprocess Validation Market Revenue (Million) Forecast, by Application 2019 & 2032
- Table 58: Brazil Bioprocess Validation Market Volume (K Unit) Forecast, by Application 2019 & 2032
- Table 59: Argentina Bioprocess Validation Market Revenue (Million) Forecast, by Application 2019 & 2032
- Table 60: Argentina Bioprocess Validation Market Volume (K Unit) Forecast, by Application 2019 & 2032
- Table 61: Rest of South America Bioprocess Validation Market Revenue (Million) Forecast, by Application 2019 & 2032
- Table 62: Rest of South America Bioprocess Validation Market Volume (K Unit) Forecast, by Application 2019 & 2032
- Table 63: Global Bioprocess Validation Market Revenue Million Forecast, by Test Type 2019 & 2032
- Table 64: Global Bioprocess Validation Market Volume K Unit Forecast, by Test Type 2019 & 2032
- Table 65: Global Bioprocess Validation Market Revenue Million Forecast, by Process Component 2019 & 2032
- Table 66: Global Bioprocess Validation Market Volume K Unit Forecast, by Process Component 2019 & 2032
- Table 67: Global Bioprocess Validation Market Revenue Million Forecast, by End User 2019 & 2032
- Table 68: Global Bioprocess Validation Market Volume K Unit Forecast, by End User 2019 & 2032
- Table 69: Global Bioprocess Validation Market Revenue Million Forecast, by Country 2019 & 2032
- Table 70: Global Bioprocess Validation Market Volume K Unit Forecast, by Country 2019 & 2032
- Table 71: United States Bioprocess Validation Market Revenue (Million) Forecast, by Application 2019 & 2032
- Table 72: United States Bioprocess Validation Market Volume (K Unit) Forecast, by Application 2019 & 2032
- Table 73: Canada Bioprocess Validation Market Revenue (Million) Forecast, by Application 2019 & 2032
- Table 74: Canada Bioprocess Validation Market Volume (K Unit) Forecast, by Application 2019 & 2032
- Table 75: Mexico Bioprocess Validation Market Revenue (Million) Forecast, by Application 2019 & 2032
- Table 76: Mexico Bioprocess Validation Market Volume (K Unit) Forecast, by Application 2019 & 2032
- Table 77: Global Bioprocess Validation Market Revenue Million Forecast, by Test Type 2019 & 2032
- Table 78: Global Bioprocess Validation Market Volume K Unit Forecast, by Test Type 2019 & 2032
- Table 79: Global Bioprocess Validation Market Revenue Million Forecast, by Process Component 2019 & 2032
- Table 80: Global Bioprocess Validation Market Volume K Unit Forecast, by Process Component 2019 & 2032
- Table 81: Global Bioprocess Validation Market Revenue Million Forecast, by End User 2019 & 2032
- Table 82: Global Bioprocess Validation Market Volume K Unit Forecast, by End User 2019 & 2032
- Table 83: Global Bioprocess Validation Market Revenue Million Forecast, by Country 2019 & 2032
- Table 84: Global Bioprocess Validation Market Volume K Unit Forecast, by Country 2019 & 2032
- Table 85: Germany Bioprocess Validation Market Revenue (Million) Forecast, by Application 2019 & 2032
- Table 86: Germany Bioprocess Validation Market Volume (K Unit) Forecast, by Application 2019 & 2032
- Table 87: United Kingdom Bioprocess Validation Market Revenue (Million) Forecast, by Application 2019 & 2032
- Table 88: United Kingdom Bioprocess Validation Market Volume (K Unit) Forecast, by Application 2019 & 2032
- Table 89: France Bioprocess Validation Market Revenue (Million) Forecast, by Application 2019 & 2032
- Table 90: France Bioprocess Validation Market Volume (K Unit) Forecast, by Application 2019 & 2032
- Table 91: Italy Bioprocess Validation Market Revenue (Million) Forecast, by Application 2019 & 2032
- Table 92: Italy Bioprocess Validation Market Volume (K Unit) Forecast, by Application 2019 & 2032
- Table 93: Spain Bioprocess Validation Market Revenue (Million) Forecast, by Application 2019 & 2032
- Table 94: Spain Bioprocess Validation Market Volume (K Unit) Forecast, by Application 2019 & 2032
- Table 95: Rest of Europe Bioprocess Validation Market Revenue (Million) Forecast, by Application 2019 & 2032
- Table 96: Rest of Europe Bioprocess Validation Market Volume (K Unit) Forecast, by Application 2019 & 2032
- Table 97: Global Bioprocess Validation Market Revenue Million Forecast, by Test Type 2019 & 2032
- Table 98: Global Bioprocess Validation Market Volume K Unit Forecast, by Test Type 2019 & 2032
- Table 99: Global Bioprocess Validation Market Revenue Million Forecast, by Process Component 2019 & 2032
- Table 100: Global Bioprocess Validation Market Volume K Unit Forecast, by Process Component 2019 & 2032
- Table 101: Global Bioprocess Validation Market Revenue Million Forecast, by End User 2019 & 2032
- Table 102: Global Bioprocess Validation Market Volume K Unit Forecast, by End User 2019 & 2032
- Table 103: Global Bioprocess Validation Market Revenue Million Forecast, by Country 2019 & 2032
- Table 104: Global Bioprocess Validation Market Volume K Unit Forecast, by Country 2019 & 2032
- Table 105: China Bioprocess Validation Market Revenue (Million) Forecast, by Application 2019 & 2032
- Table 106: China Bioprocess Validation Market Volume (K Unit) Forecast, by Application 2019 & 2032
- Table 107: Japan Bioprocess Validation Market Revenue (Million) Forecast, by Application 2019 & 2032
- Table 108: Japan Bioprocess Validation Market Volume (K Unit) Forecast, by Application 2019 & 2032
- Table 109: India Bioprocess Validation Market Revenue (Million) Forecast, by Application 2019 & 2032
- Table 110: India Bioprocess Validation Market Volume (K Unit) Forecast, by Application 2019 & 2032
- Table 111: Australia Bioprocess Validation Market Revenue (Million) Forecast, by Application 2019 & 2032
- Table 112: Australia Bioprocess Validation Market Volume (K Unit) Forecast, by Application 2019 & 2032
- Table 113: South Korea Bioprocess Validation Market Revenue (Million) Forecast, by Application 2019 & 2032
- Table 114: South Korea Bioprocess Validation Market Volume (K Unit) Forecast, by Application 2019 & 2032
- Table 115: Rest of Asia Pacific Bioprocess Validation Market Revenue (Million) Forecast, by Application 2019 & 2032
- Table 116: Rest of Asia Pacific Bioprocess Validation Market Volume (K Unit) Forecast, by Application 2019 & 2032
- Table 117: Global Bioprocess Validation Market Revenue Million Forecast, by Test Type 2019 & 2032
- Table 118: Global Bioprocess Validation Market Volume K Unit Forecast, by Test Type 2019 & 2032
- Table 119: Global Bioprocess Validation Market Revenue Million Forecast, by Process Component 2019 & 2032
- Table 120: Global Bioprocess Validation Market Volume K Unit Forecast, by Process Component 2019 & 2032
- Table 121: Global Bioprocess Validation Market Revenue Million Forecast, by End User 2019 & 2032
- Table 122: Global Bioprocess Validation Market Volume K Unit Forecast, by End User 2019 & 2032
- Table 123: Global Bioprocess Validation Market Revenue Million Forecast, by Country 2019 & 2032
- Table 124: Global Bioprocess Validation Market Volume K Unit Forecast, by Country 2019 & 2032
- Table 125: GCC Bioprocess Validation Market Revenue (Million) Forecast, by Application 2019 & 2032
- Table 126: GCC Bioprocess Validation Market Volume (K Unit) Forecast, by Application 2019 & 2032
- Table 127: South Africa Bioprocess Validation Market Revenue (Million) Forecast, by Application 2019 & 2032
- Table 128: South Africa Bioprocess Validation Market Volume (K Unit) Forecast, by Application 2019 & 2032
- Table 129: Rest of Middle East and Africa Bioprocess Validation Market Revenue (Million) Forecast, by Application 2019 & 2032
- Table 130: Rest of Middle East and Africa Bioprocess Validation Market Volume (K Unit) Forecast, by Application 2019 & 2032
- Table 131: Global Bioprocess Validation Market Revenue Million Forecast, by Test Type 2019 & 2032
- Table 132: Global Bioprocess Validation Market Volume K Unit Forecast, by Test Type 2019 & 2032
- Table 133: Global Bioprocess Validation Market Revenue Million Forecast, by Process Component 2019 & 2032
- Table 134: Global Bioprocess Validation Market Volume K Unit Forecast, by Process Component 2019 & 2032
- Table 135: Global Bioprocess Validation Market Revenue Million Forecast, by End User 2019 & 2032
- Table 136: Global Bioprocess Validation Market Volume K Unit Forecast, by End User 2019 & 2032
- Table 137: Global Bioprocess Validation Market Revenue Million Forecast, by Country 2019 & 2032
- Table 138: Global Bioprocess Validation Market Volume K Unit Forecast, by Country 2019 & 2032
- Table 139: Brazil Bioprocess Validation Market Revenue (Million) Forecast, by Application 2019 & 2032
- Table 140: Brazil Bioprocess Validation Market Volume (K Unit) Forecast, by Application 2019 & 2032
- Table 141: Argentina Bioprocess Validation Market Revenue (Million) Forecast, by Application 2019 & 2032
- Table 142: Argentina Bioprocess Validation Market Volume (K Unit) Forecast, by Application 2019 & 2032
- Table 143: Rest of South America Bioprocess Validation Market Revenue (Million) Forecast, by Application 2019 & 2032
- Table 144: Rest of South America Bioprocess Validation Market Volume (K Unit) Forecast, by Application 2019 & 2032
Frequently Asked Questions
1. What is the projected Compound Annual Growth Rate (CAGR) of the Bioprocess Validation Market?
The projected CAGR is approximately 9.50%.
2. Which companies are prominent players in the Bioprocess Validation Market?
Key companies in the market include SGS S A, Meissner Filtration Products, Labcorp (Toxikon Corporation), Almac Group, Merck KGaA, Eurofins Scientific, Cobetter Filtration Equipments Co Ltd, Pall Corporation, Sartorius AG, Thermo Fisher Scientific, DOC S r l.
3. What are the main segments of the Bioprocess Validation Market?
The market segments include Test Type, Process Component, End User.
4. Can you provide details about the market size?
The market size is estimated to be USD XX Million as of 2022.
5. What are some drivers contributing to market growth?
Increasing Demand for Biopharmaceuticals; Increasing Demand for Outsourcing Bioprocess Validation; Rising Life Science R&D Expenditure.
6. What are the notable trends driving market growth?
Bioreactor Expected to Hold Significant Market Share.
7. Are there any restraints impacting market growth?
Issues Related to Extractables & Leachables.
8. Can you provide examples of recent developments in the market?
May 2022: Qosina launched its new Bioprocess Resource Center, an information source for the bioprocess industry.
9. What pricing options are available for accessing the report?
Pricing options include single-user, multi-user, and enterprise licenses priced at USD 4750, USD 5250, and USD 8750 respectively.
10. Is the market size provided in terms of value or volume?
The market size is provided in terms of value, measured in Million and volume, measured in K Unit.
11. Are there any specific market keywords associated with the report?
Yes, the market keyword associated with the report is "Bioprocess Validation Market," which aids in identifying and referencing the specific market segment covered.
12. How do I determine which pricing option suits my needs best?
The pricing options vary based on user requirements and access needs. Individual users may opt for single-user licenses, while businesses requiring broader access may choose multi-user or enterprise licenses for cost-effective access to the report.
13. Are there any additional resources or data provided in the Bioprocess Validation Market report?
While the report offers comprehensive insights, it's advisable to review the specific contents or supplementary materials provided to ascertain if additional resources or data are available.
14. How can I stay updated on further developments or reports in the Bioprocess Validation Market?
To stay informed about further developments, trends, and reports in the Bioprocess Validation Market, consider subscribing to industry newsletters, following relevant companies and organizations, or regularly checking reputable industry news sources and publications.
Methodology
Step 1 - Identification of Relevant Samples Size from Population Database


Step 2 - Approaches for Defining Global Market Size (Value, Volume* & Price*)

Note*: In applicable scenarios
Step 3 - Data Sources
Primary Research
- Web Analytics
- Survey Reports
- Research Institute
- Latest Research Reports
- Opinion Leaders
Secondary Research
- Annual Reports
- White Paper
- Latest Press Release
- Industry Association
- Paid Database
- Investor Presentations

Step 4 - Data Triangulation
Involves using different sources of information in order to increase the validity of a study
These sources are likely to be stakeholders in a program - participants, other researchers, program staff, other community members, and so on.
Then we put all data in single framework & apply various statistical tools to find out the dynamic on the market.
During the analysis stage, feedback from the stakeholder groups would be compared to determine areas of agreement as well as areas of divergence
