

Key Insights
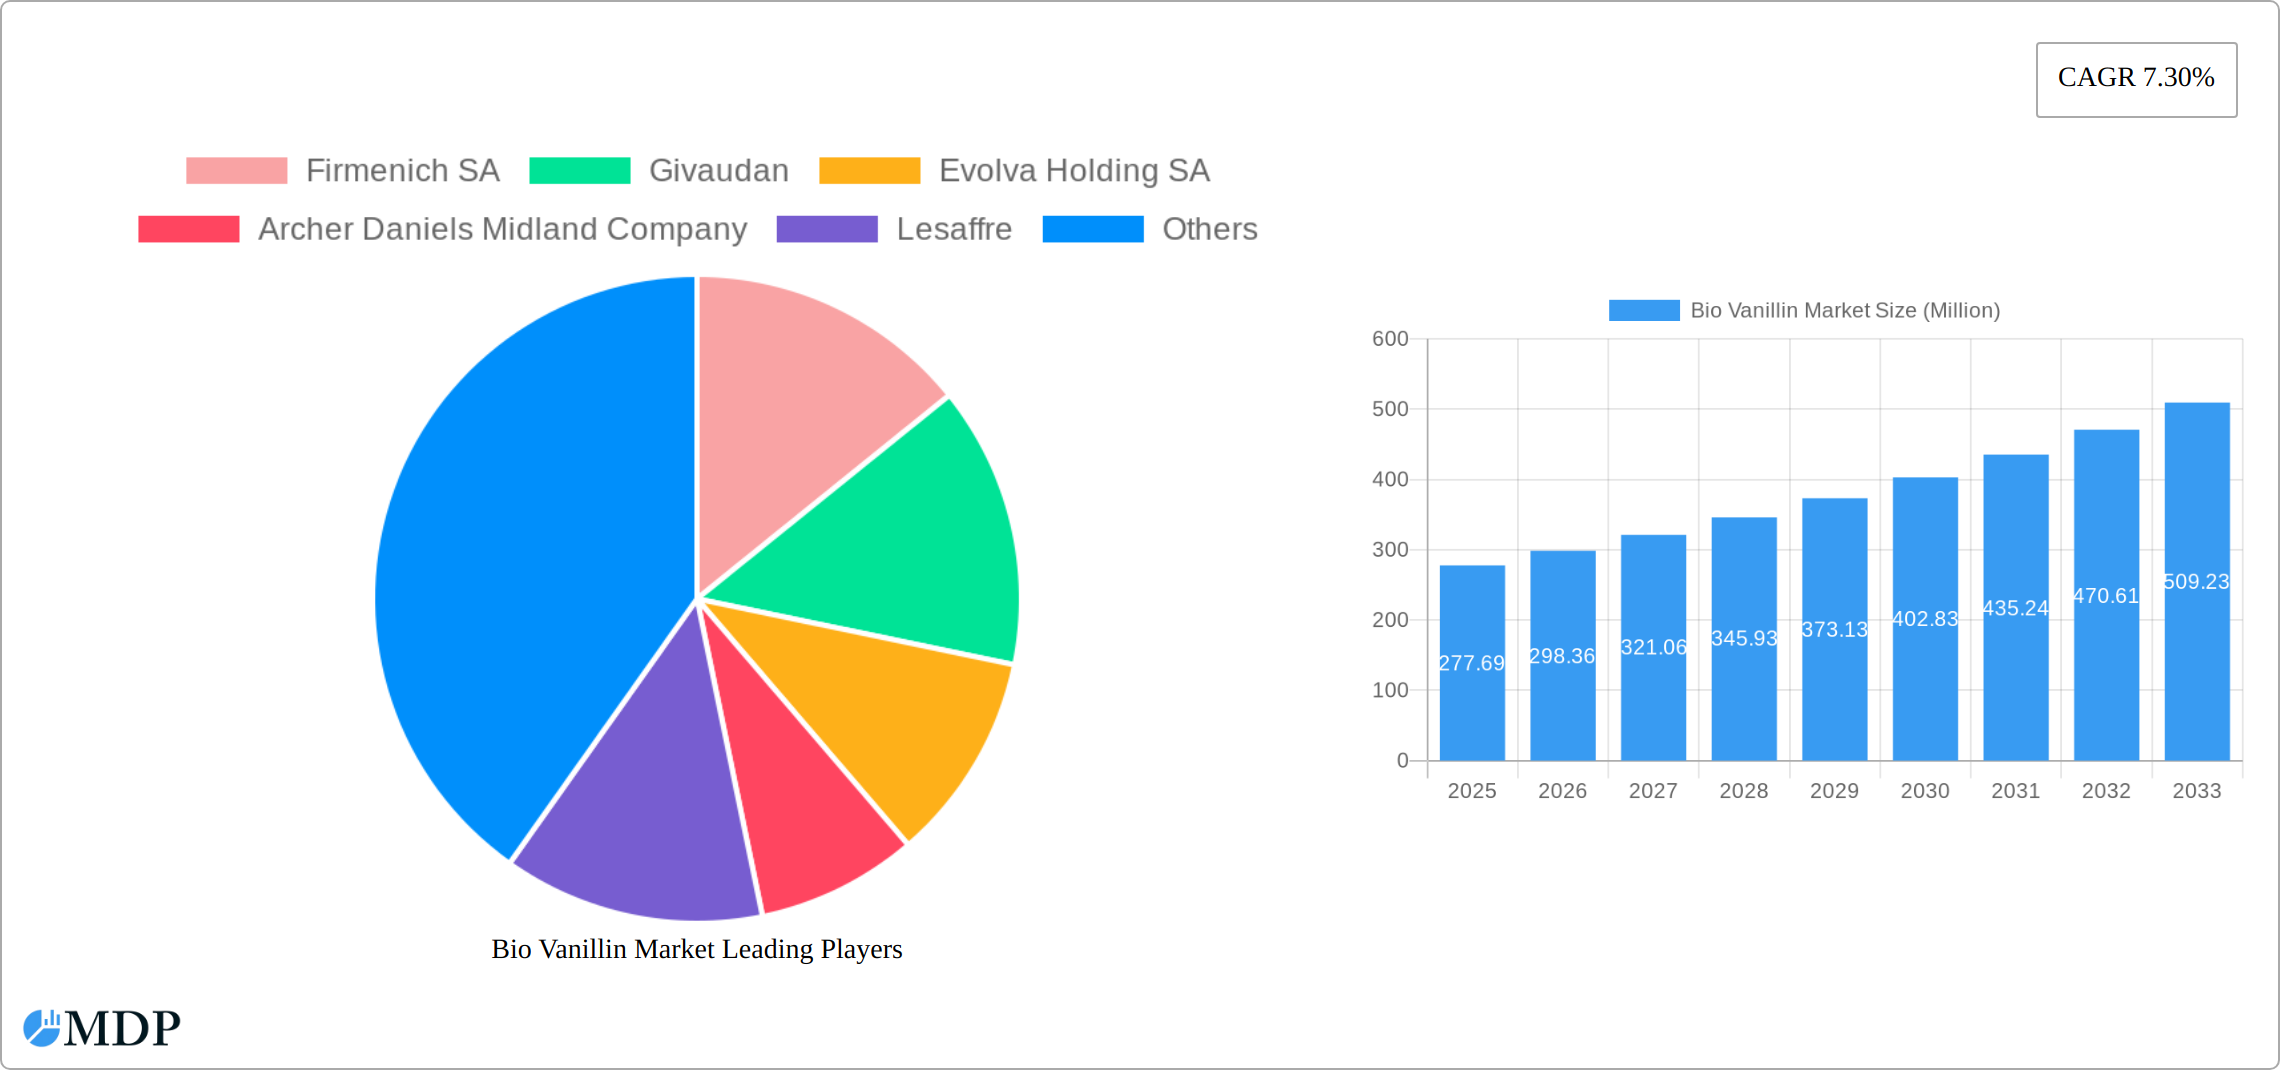
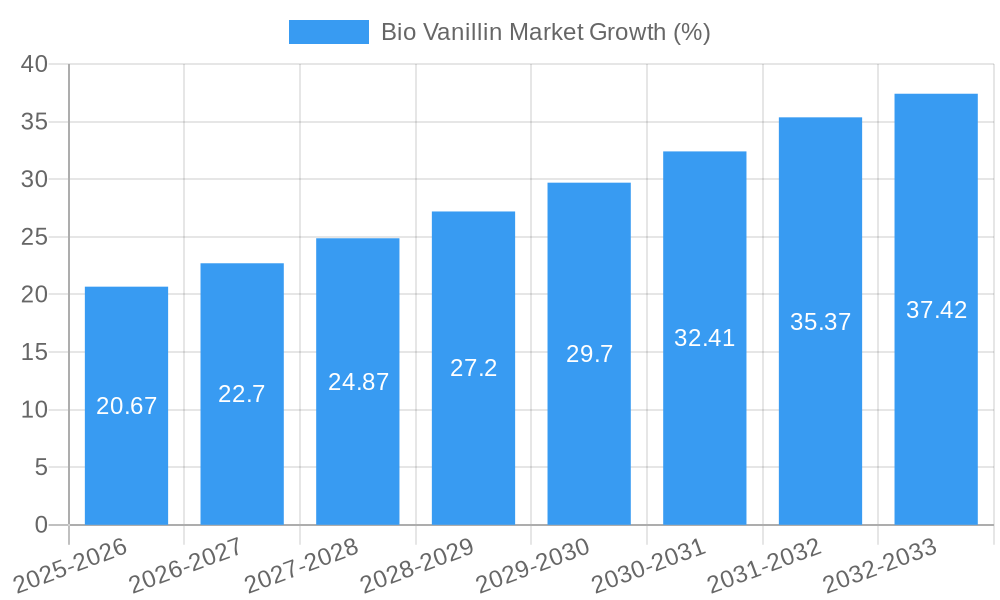
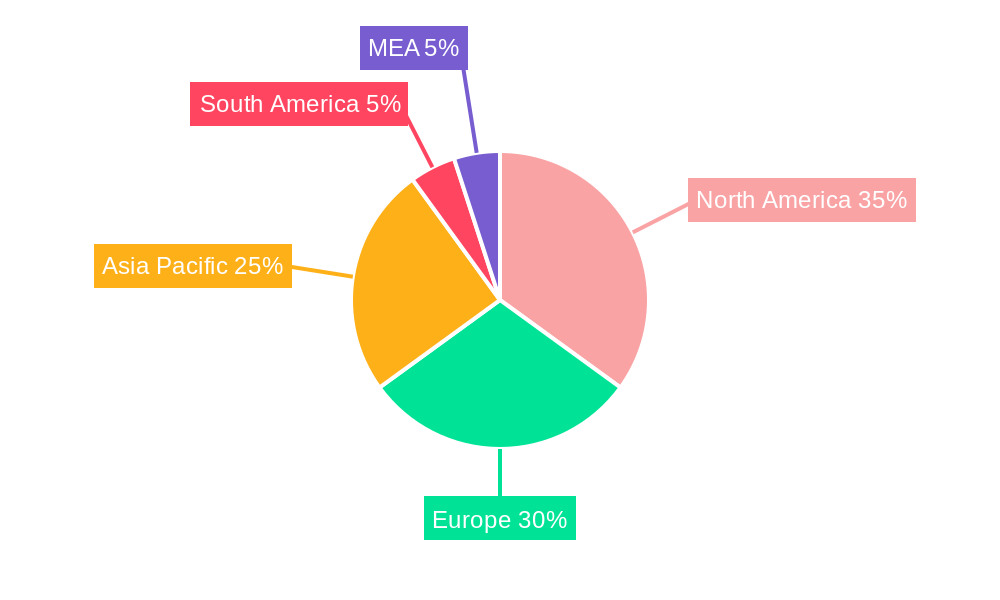
The global bio vanillin market, valued at $277.69 million in 2025, is projected to experience robust growth, driven by increasing consumer demand for natural and clean-label food and beverage products. This surge in demand is fueled by heightened health consciousness and a growing preference for natural ingredients over synthetic alternatives. The food and beverage sector remains the dominant application segment, accounting for a significant portion of overall market share, followed by the pharmaceutical and fragrance industries. Factors like stringent regulations on synthetic vanillin and the rising popularity of plant-based foods are further propelling market expansion. Key players, including Firmenich SA, Givaudan, and Evolva Holding SA, are strategically investing in research and development to enhance bio-based production methods and expand their product portfolios. Geographical expansion is also a key driver, with North America and Europe currently holding substantial market shares, but the Asia-Pacific region showing the most promising growth potential due to its burgeoning food and beverage industry and increasing disposable incomes. The market's steady CAGR of 7.30% from 2019-2033 signifies consistent expansion, projecting a substantial market size by 2033.
While the market faces certain restraints, such as the relatively higher cost of production compared to synthetic vanillin and potential supply chain challenges, ongoing innovation and technological advancements are mitigating these issues. The development of more efficient and cost-effective bio-production processes, coupled with increasing government support for sustainable practices in the food industry, is expected to overcome these limitations. The market's segmentation by application allows for targeted strategies, with companies focusing on specific segments to maximize their market penetration. The continued focus on sustainability, consumer preference for natural ingredients, and technological advancements in bio-production will collectively shape the bio vanillin market's trajectory in the coming years, securing its position as a significant player in the global flavor and fragrance industry.
Bio Vanillin Market: A Comprehensive Report [2019-2033]
This comprehensive report provides an in-depth analysis of the global Bio Vanillin Market, offering invaluable insights for industry stakeholders, investors, and strategic decision-makers. The study covers the period from 2019 to 2033, with 2025 as the base and estimated year. Our analysis leverages rigorous research methodologies and incorporates key market trends, competitive dynamics, and future growth projections. The report is meticulously structured to deliver actionable intelligence, empowering you to navigate the complexities of this dynamic market effectively. Expect detailed breakdowns of market size (in Millions), CAGR, and segment-specific growth drivers. Download now to gain a competitive edge!
Bio Vanillin Market Market Dynamics & Concentration
The Bio Vanillin market is experiencing significant growth driven by increasing demand from the food and beverage, pharmaceutical, and fragrance industries. Market concentration is moderate, with several key players holding substantial market share. Firmenich SA, Givaudan, and Evolva Holding SA are among the leading companies, collectively holding an estimated xx% market share in 2025. Innovation in bio-based production methods and sustainable sourcing is a key driver, while regulatory frameworks concerning food additives and flavoring agents play a significant role. The market has witnessed a modest number of M&A activities in recent years, with approximately xx deals recorded between 2019 and 2024. Product substitutes, such as synthetic vanillin, present a competitive challenge, but the growing preference for natural and sustainably sourced ingredients fuels the demand for bio-vanillin. End-user trends towards clean-label products and health-conscious consumption further enhance the market outlook.
Bio Vanillin Market Industry Trends & Analysis
The Bio Vanillin market exhibits a robust growth trajectory, with a projected CAGR of xx% during the forecast period (2025-2033). Technological advancements in fermentation processes and bio-catalytic synthesis are streamlining production and reducing costs, boosting market penetration. The increasing consumer preference for natural and organic products is a primary growth driver. This trend is particularly prominent in developed economies with rising health awareness. The competitive landscape is characterized by both established players and emerging biotech companies, leading to intense innovation and pricing competition. Market growth is further fueled by expanding applications in diverse sectors, including pharmaceuticals and personal care products. However, challenges associated with the scalability of bio-based production and fluctuating raw material prices need careful consideration.
Leading Markets & Segments in Bio Vanillin Market
The Food & Beverage segment dominates the Bio Vanillin market, accounting for approximately xx% of the total market value in 2025. This is primarily driven by the increasing demand for natural flavors and aromas in processed foods and beverages.
Key Drivers for Food & Beverage Segment Dominance:
- Growing demand for natural food ingredients
- Increased consumer awareness of synthetic vanillin
- Expanding food processing industry in developing economies
The Asia-Pacific region emerges as the leading geographic market, showcasing significant growth potential due to:
- Rapid economic expansion and rising disposable incomes
- Expanding food and beverage industries
- Favorable government policies supporting the natural food sector
Detailed analysis of other segments (Pharmaceutical and Fragrance) indicates a steady, albeit slower, growth trajectory compared to the Food & Beverage segment. Their growth is tied to the adoption of natural ingredients in pharmaceutical formulations and high-end fragrances.
Bio Vanillin Market Product Developments
Recent product innovations focus on enhancing the quality and purity of bio-vanillin while optimizing production processes to achieve cost-effectiveness. This includes the development of improved fermentation strains and enzymatic synthesis methods. Companies are striving to create bio-vanillin products with superior sensory properties and extended shelf life. These advancements address market demands for higher-quality, natural ingredients, providing competitive advantages.
Key Drivers of Bio Vanillin Market Growth
Several factors are propelling the growth of the Bio Vanillin market. Firstly, the rising consumer preference for natural and clean-label products is a significant driver. Secondly, technological advancements in bio-production, such as improved fermentation techniques, are lowering costs and improving efficiency. Finally, favorable government regulations and incentives supporting sustainable and bio-based products are further boosting market growth.
Challenges in the Bio Vanillin Market Market
The Bio Vanillin market faces challenges including the relatively high production cost compared to synthetic vanillin, fluctuating raw material prices affecting profitability, and intense competition from established synthetic vanillin manufacturers. The regulatory landscape for food additives and natural flavors can also introduce complexities and barriers to market entry for new players. These factors combine to potentially limit market expansion in certain regions or segments.
Emerging Opportunities in Bio Vanillin Market
Significant opportunities exist for long-term growth in the Bio Vanillin market. Strategic partnerships and collaborations between bio-tech companies and established food and fragrance players can facilitate innovation and market penetration. Technological breakthroughs, such as the development of high-yield fermentation strains, hold the potential to significantly reduce production costs. Furthermore, expanding into niche applications within the pharmaceutical and personal care industries can unlock significant new revenue streams.
Leading Players in the Bio Vanillin Market Sector
- Firmenich SA
- Givaudan
- Evolva Holding SA
- Archer Daniels Midland Company
- Lesaffre
- Advanced Biotech
- AUROCHEMICAL
- Apple Flavor & Fragrance Group Co Ltd
Key Milestones in Bio Vanillin Market Industry
- 2020: Evolva Holding SA launched a new, high-yield bio-vanillin production process.
- 2022: A significant merger between two key players in the bio-vanillin sector resulted in expanded market reach and production capacity.
- 2023: A new regulatory approval for bio-vanillin as a food additive in a major market stimulated market growth. (Specific details pending further research)
- 2024: Several companies announced investments in R&D to improve the sustainability and efficiency of bio-vanillin production.
Strategic Outlook for Bio Vanillin Market Market
The future of the Bio Vanillin market appears promising, driven by continued consumer demand for natural ingredients and ongoing innovation in bio-production technologies. Strategic partnerships, mergers, and acquisitions will play a key role in shaping the market landscape. Companies that successfully navigate the challenges of scalability and cost-competitiveness while capitalizing on technological advancements are poised for significant growth and market share gains. The market shows substantial potential for expansion in emerging economies and within niche applications, indicating a strong future outlook.
Bio Vanillin Market Segmentation
-
1. Application
-
1.1. Food
- 1.1.1. Ice Cream
- 1.1.2. Baked Goods
- 1.1.3. Chocolate
- 1.1.4. Other Foods
- 1.2. Beverage
- 1.3. Pharmaceutical
- 1.4. Fragrance
-
1.1. Food
Bio Vanillin Market Segmentation By Geography
-
1. North America
- 1.1. United States
- 1.2. Canada
- 1.3. Mexico
- 1.4. Rest of North America
-
2. Europe
- 2.1. United Kingdom
- 2.2. Germany
- 2.3. France
- 2.4. Russia
- 2.5. Italy
- 2.6. Rest of Europe
-
3. Asia Pacific
- 3.1. India
- 3.2. China
- 3.3. Japan
- 3.4. Australia
- 3.5. Rest of Asia Pacific
-
4. Rest of the World
- 4.1. South America
- 4.2. Middle East
Bio Vanillin Market REPORT HIGHLIGHTS
| Aspects | Details |
|---|---|
| Study Period | 2019-2033 |
| Base Year | 2024 |
| Estimated Year | 2025 |
| Forecast Period | 2025-2033 |
| Historical Period | 2019-2024 |
| Growth Rate | CAGR of 7.30% from 2019-2033 |
| Segmentation |
|
Table of Contents
- 1. Introduction
- 1.1. Research Scope
- 1.2. Market Segmentation
- 1.3. Research Methodology
- 1.4. Definitions and Assumptions
- 2. Executive Summary
- 2.1. Introduction
- 3. Market Dynamics
- 3.1. Introduction
- 3.2. Market Drivers
- 3.2.1. Surge in Demand for 'Free-from' Food Products; Demand For Convenient And Healthy On-the-go Snacking Options
- 3.3. Market Restrains
- 3.3.1. Health Risk Associated with Certain Ingredients
- 3.4. Market Trends
- 3.4.1. Growing Demand for Bio Vanillin in the Food and Beverage Industry
- 4. Market Factor Analysis
- 4.1. Porters Five Forces
- 4.2. Supply/Value Chain
- 4.3. PESTEL analysis
- 4.4. Market Entropy
- 4.5. Patent/Trademark Analysis
- 5. Global Bio Vanillin Market Analysis, Insights and Forecast, 2019-2031
- 5.1. Market Analysis, Insights and Forecast - by Application
- 5.1.1. Food
- 5.1.1.1. Ice Cream
- 5.1.1.2. Baked Goods
- 5.1.1.3. Chocolate
- 5.1.1.4. Other Foods
- 5.1.2. Beverage
- 5.1.3. Pharmaceutical
- 5.1.4. Fragrance
- 5.1.1. Food
- 5.2. Market Analysis, Insights and Forecast - by Region
- 5.2.1. North America
- 5.2.2. Europe
- 5.2.3. Asia Pacific
- 5.2.4. Rest of the World
- 5.1. Market Analysis, Insights and Forecast - by Application
- 6. North America Bio Vanillin Market Analysis, Insights and Forecast, 2019-2031
- 6.1. Market Analysis, Insights and Forecast - by Application
- 6.1.1. Food
- 6.1.1.1. Ice Cream
- 6.1.1.2. Baked Goods
- 6.1.1.3. Chocolate
- 6.1.1.4. Other Foods
- 6.1.2. Beverage
- 6.1.3. Pharmaceutical
- 6.1.4. Fragrance
- 6.1.1. Food
- 6.1. Market Analysis, Insights and Forecast - by Application
- 7. Europe Bio Vanillin Market Analysis, Insights and Forecast, 2019-2031
- 7.1. Market Analysis, Insights and Forecast - by Application
- 7.1.1. Food
- 7.1.1.1. Ice Cream
- 7.1.1.2. Baked Goods
- 7.1.1.3. Chocolate
- 7.1.1.4. Other Foods
- 7.1.2. Beverage
- 7.1.3. Pharmaceutical
- 7.1.4. Fragrance
- 7.1.1. Food
- 7.1. Market Analysis, Insights and Forecast - by Application
- 8. Asia Pacific Bio Vanillin Market Analysis, Insights and Forecast, 2019-2031
- 8.1. Market Analysis, Insights and Forecast - by Application
- 8.1.1. Food
- 8.1.1.1. Ice Cream
- 8.1.1.2. Baked Goods
- 8.1.1.3. Chocolate
- 8.1.1.4. Other Foods
- 8.1.2. Beverage
- 8.1.3. Pharmaceutical
- 8.1.4. Fragrance
- 8.1.1. Food
- 8.1. Market Analysis, Insights and Forecast - by Application
- 9. Rest of the World Bio Vanillin Market Analysis, Insights and Forecast, 2019-2031
- 9.1. Market Analysis, Insights and Forecast - by Application
- 9.1.1. Food
- 9.1.1.1. Ice Cream
- 9.1.1.2. Baked Goods
- 9.1.1.3. Chocolate
- 9.1.1.4. Other Foods
- 9.1.2. Beverage
- 9.1.3. Pharmaceutical
- 9.1.4. Fragrance
- 9.1.1. Food
- 9.1. Market Analysis, Insights and Forecast - by Application
- 10. North America Bio Vanillin Market Analysis, Insights and Forecast, 2019-2031
- 10.1. Market Analysis, Insights and Forecast - By Country/Sub-region
- 10.1.1 United States
- 10.1.2 Canada
- 10.1.3 Mexico
- 11. Europe Bio Vanillin Market Analysis, Insights and Forecast, 2019-2031
- 11.1. Market Analysis, Insights and Forecast - By Country/Sub-region
- 11.1.1 Germany
- 11.1.2 United Kingdom
- 11.1.3 France
- 11.1.4 Spain
- 11.1.5 Italy
- 11.1.6 Spain
- 11.1.7 Belgium
- 11.1.8 Netherland
- 11.1.9 Nordics
- 11.1.10 Rest of Europe
- 12. Asia Pacific Bio Vanillin Market Analysis, Insights and Forecast, 2019-2031
- 12.1. Market Analysis, Insights and Forecast - By Country/Sub-region
- 12.1.1 China
- 12.1.2 Japan
- 12.1.3 India
- 12.1.4 South Korea
- 12.1.5 Southeast Asia
- 12.1.6 Australia
- 12.1.7 Indonesia
- 12.1.8 Phillipes
- 12.1.9 Singapore
- 12.1.10 Thailandc
- 12.1.11 Rest of Asia Pacific
- 13. South America Bio Vanillin Market Analysis, Insights and Forecast, 2019-2031
- 13.1. Market Analysis, Insights and Forecast - By Country/Sub-region
- 13.1.1 Brazil
- 13.1.2 Argentina
- 13.1.3 Peru
- 13.1.4 Chile
- 13.1.5 Colombia
- 13.1.6 Ecuador
- 13.1.7 Venezuela
- 13.1.8 Rest of South America
- 14. MEA Bio Vanillin Market Analysis, Insights and Forecast, 2019-2031
- 14.1. Market Analysis, Insights and Forecast - By Country/Sub-region
- 14.1.1 United Arab Emirates
- 14.1.2 Saudi Arabia
- 14.1.3 South Africa
- 14.1.4 Rest of Middle East and Africa
- 15. Competitive Analysis
- 15.1. Global Market Share Analysis 2024
- 15.2. Company Profiles
- 15.2.1 Firmenich SA
- 15.2.1.1. Overview
- 15.2.1.2. Products
- 15.2.1.3. SWOT Analysis
- 15.2.1.4. Recent Developments
- 15.2.1.5. Financials (Based on Availability)
- 15.2.2 Givaudan
- 15.2.2.1. Overview
- 15.2.2.2. Products
- 15.2.2.3. SWOT Analysis
- 15.2.2.4. Recent Developments
- 15.2.2.5. Financials (Based on Availability)
- 15.2.3 Evolva Holding SA
- 15.2.3.1. Overview
- 15.2.3.2. Products
- 15.2.3.3. SWOT Analysis
- 15.2.3.4. Recent Developments
- 15.2.3.5. Financials (Based on Availability)
- 15.2.4 Archer Daniels Midland Company
- 15.2.4.1. Overview
- 15.2.4.2. Products
- 15.2.4.3. SWOT Analysis
- 15.2.4.4. Recent Developments
- 15.2.4.5. Financials (Based on Availability)
- 15.2.5 Lesaffre
- 15.2.5.1. Overview
- 15.2.5.2. Products
- 15.2.5.3. SWOT Analysis
- 15.2.5.4. Recent Developments
- 15.2.5.5. Financials (Based on Availability)
- 15.2.6 Advanced Biotech
- 15.2.6.1. Overview
- 15.2.6.2. Products
- 15.2.6.3. SWOT Analysis
- 15.2.6.4. Recent Developments
- 15.2.6.5. Financials (Based on Availability)
- 15.2.7 AUROCHEMICAL
- 15.2.7.1. Overview
- 15.2.7.2. Products
- 15.2.7.3. SWOT Analysis
- 15.2.7.4. Recent Developments
- 15.2.7.5. Financials (Based on Availability)
- 15.2.8 Apple Flavor & Fragrance Group Co Ltd
- 15.2.8.1. Overview
- 15.2.8.2. Products
- 15.2.8.3. SWOT Analysis
- 15.2.8.4. Recent Developments
- 15.2.8.5. Financials (Based on Availability)
- 15.2.1 Firmenich SA
List of Figures
- Figure 1: Global Bio Vanillin Market Revenue Breakdown (Million, %) by Region 2024 & 2032
- Figure 2: Global Bio Vanillin Market Volume Breakdown (K Units, %) by Region 2024 & 2032
- Figure 3: North America Bio Vanillin Market Revenue (Million), by Country 2024 & 2032
- Figure 4: North America Bio Vanillin Market Volume (K Units), by Country 2024 & 2032
- Figure 5: North America Bio Vanillin Market Revenue Share (%), by Country 2024 & 2032
- Figure 6: North America Bio Vanillin Market Volume Share (%), by Country 2024 & 2032
- Figure 7: Europe Bio Vanillin Market Revenue (Million), by Country 2024 & 2032
- Figure 8: Europe Bio Vanillin Market Volume (K Units), by Country 2024 & 2032
- Figure 9: Europe Bio Vanillin Market Revenue Share (%), by Country 2024 & 2032
- Figure 10: Europe Bio Vanillin Market Volume Share (%), by Country 2024 & 2032
- Figure 11: Asia Pacific Bio Vanillin Market Revenue (Million), by Country 2024 & 2032
- Figure 12: Asia Pacific Bio Vanillin Market Volume (K Units), by Country 2024 & 2032
- Figure 13: Asia Pacific Bio Vanillin Market Revenue Share (%), by Country 2024 & 2032
- Figure 14: Asia Pacific Bio Vanillin Market Volume Share (%), by Country 2024 & 2032
- Figure 15: South America Bio Vanillin Market Revenue (Million), by Country 2024 & 2032
- Figure 16: South America Bio Vanillin Market Volume (K Units), by Country 2024 & 2032
- Figure 17: South America Bio Vanillin Market Revenue Share (%), by Country 2024 & 2032
- Figure 18: South America Bio Vanillin Market Volume Share (%), by Country 2024 & 2032
- Figure 19: MEA Bio Vanillin Market Revenue (Million), by Country 2024 & 2032
- Figure 20: MEA Bio Vanillin Market Volume (K Units), by Country 2024 & 2032
- Figure 21: MEA Bio Vanillin Market Revenue Share (%), by Country 2024 & 2032
- Figure 22: MEA Bio Vanillin Market Volume Share (%), by Country 2024 & 2032
- Figure 23: North America Bio Vanillin Market Revenue (Million), by Application 2024 & 2032
- Figure 24: North America Bio Vanillin Market Volume (K Units), by Application 2024 & 2032
- Figure 25: North America Bio Vanillin Market Revenue Share (%), by Application 2024 & 2032
- Figure 26: North America Bio Vanillin Market Volume Share (%), by Application 2024 & 2032
- Figure 27: North America Bio Vanillin Market Revenue (Million), by Country 2024 & 2032
- Figure 28: North America Bio Vanillin Market Volume (K Units), by Country 2024 & 2032
- Figure 29: North America Bio Vanillin Market Revenue Share (%), by Country 2024 & 2032
- Figure 30: North America Bio Vanillin Market Volume Share (%), by Country 2024 & 2032
- Figure 31: Europe Bio Vanillin Market Revenue (Million), by Application 2024 & 2032
- Figure 32: Europe Bio Vanillin Market Volume (K Units), by Application 2024 & 2032
- Figure 33: Europe Bio Vanillin Market Revenue Share (%), by Application 2024 & 2032
- Figure 34: Europe Bio Vanillin Market Volume Share (%), by Application 2024 & 2032
- Figure 35: Europe Bio Vanillin Market Revenue (Million), by Country 2024 & 2032
- Figure 36: Europe Bio Vanillin Market Volume (K Units), by Country 2024 & 2032
- Figure 37: Europe Bio Vanillin Market Revenue Share (%), by Country 2024 & 2032
- Figure 38: Europe Bio Vanillin Market Volume Share (%), by Country 2024 & 2032
- Figure 39: Asia Pacific Bio Vanillin Market Revenue (Million), by Application 2024 & 2032
- Figure 40: Asia Pacific Bio Vanillin Market Volume (K Units), by Application 2024 & 2032
- Figure 41: Asia Pacific Bio Vanillin Market Revenue Share (%), by Application 2024 & 2032
- Figure 42: Asia Pacific Bio Vanillin Market Volume Share (%), by Application 2024 & 2032
- Figure 43: Asia Pacific Bio Vanillin Market Revenue (Million), by Country 2024 & 2032
- Figure 44: Asia Pacific Bio Vanillin Market Volume (K Units), by Country 2024 & 2032
- Figure 45: Asia Pacific Bio Vanillin Market Revenue Share (%), by Country 2024 & 2032
- Figure 46: Asia Pacific Bio Vanillin Market Volume Share (%), by Country 2024 & 2032
- Figure 47: Rest of the World Bio Vanillin Market Revenue (Million), by Application 2024 & 2032
- Figure 48: Rest of the World Bio Vanillin Market Volume (K Units), by Application 2024 & 2032
- Figure 49: Rest of the World Bio Vanillin Market Revenue Share (%), by Application 2024 & 2032
- Figure 50: Rest of the World Bio Vanillin Market Volume Share (%), by Application 2024 & 2032
- Figure 51: Rest of the World Bio Vanillin Market Revenue (Million), by Country 2024 & 2032
- Figure 52: Rest of the World Bio Vanillin Market Volume (K Units), by Country 2024 & 2032
- Figure 53: Rest of the World Bio Vanillin Market Revenue Share (%), by Country 2024 & 2032
- Figure 54: Rest of the World Bio Vanillin Market Volume Share (%), by Country 2024 & 2032
List of Tables
- Table 1: Global Bio Vanillin Market Revenue Million Forecast, by Region 2019 & 2032
- Table 2: Global Bio Vanillin Market Volume K Units Forecast, by Region 2019 & 2032
- Table 3: Global Bio Vanillin Market Revenue Million Forecast, by Application 2019 & 2032
- Table 4: Global Bio Vanillin Market Volume K Units Forecast, by Application 2019 & 2032
- Table 5: Global Bio Vanillin Market Revenue Million Forecast, by Region 2019 & 2032
- Table 6: Global Bio Vanillin Market Volume K Units Forecast, by Region 2019 & 2032
- Table 7: Global Bio Vanillin Market Revenue Million Forecast, by Country 2019 & 2032
- Table 8: Global Bio Vanillin Market Volume K Units Forecast, by Country 2019 & 2032
- Table 9: United States Bio Vanillin Market Revenue (Million) Forecast, by Application 2019 & 2032
- Table 10: United States Bio Vanillin Market Volume (K Units) Forecast, by Application 2019 & 2032
- Table 11: Canada Bio Vanillin Market Revenue (Million) Forecast, by Application 2019 & 2032
- Table 12: Canada Bio Vanillin Market Volume (K Units) Forecast, by Application 2019 & 2032
- Table 13: Mexico Bio Vanillin Market Revenue (Million) Forecast, by Application 2019 & 2032
- Table 14: Mexico Bio Vanillin Market Volume (K Units) Forecast, by Application 2019 & 2032
- Table 15: Global Bio Vanillin Market Revenue Million Forecast, by Country 2019 & 2032
- Table 16: Global Bio Vanillin Market Volume K Units Forecast, by Country 2019 & 2032
- Table 17: Germany Bio Vanillin Market Revenue (Million) Forecast, by Application 2019 & 2032
- Table 18: Germany Bio Vanillin Market Volume (K Units) Forecast, by Application 2019 & 2032
- Table 19: United Kingdom Bio Vanillin Market Revenue (Million) Forecast, by Application 2019 & 2032
- Table 20: United Kingdom Bio Vanillin Market Volume (K Units) Forecast, by Application 2019 & 2032
- Table 21: France Bio Vanillin Market Revenue (Million) Forecast, by Application 2019 & 2032
- Table 22: France Bio Vanillin Market Volume (K Units) Forecast, by Application 2019 & 2032
- Table 23: Spain Bio Vanillin Market Revenue (Million) Forecast, by Application 2019 & 2032
- Table 24: Spain Bio Vanillin Market Volume (K Units) Forecast, by Application 2019 & 2032
- Table 25: Italy Bio Vanillin Market Revenue (Million) Forecast, by Application 2019 & 2032
- Table 26: Italy Bio Vanillin Market Volume (K Units) Forecast, by Application 2019 & 2032
- Table 27: Spain Bio Vanillin Market Revenue (Million) Forecast, by Application 2019 & 2032
- Table 28: Spain Bio Vanillin Market Volume (K Units) Forecast, by Application 2019 & 2032
- Table 29: Belgium Bio Vanillin Market Revenue (Million) Forecast, by Application 2019 & 2032
- Table 30: Belgium Bio Vanillin Market Volume (K Units) Forecast, by Application 2019 & 2032
- Table 31: Netherland Bio Vanillin Market Revenue (Million) Forecast, by Application 2019 & 2032
- Table 32: Netherland Bio Vanillin Market Volume (K Units) Forecast, by Application 2019 & 2032
- Table 33: Nordics Bio Vanillin Market Revenue (Million) Forecast, by Application 2019 & 2032
- Table 34: Nordics Bio Vanillin Market Volume (K Units) Forecast, by Application 2019 & 2032
- Table 35: Rest of Europe Bio Vanillin Market Revenue (Million) Forecast, by Application 2019 & 2032
- Table 36: Rest of Europe Bio Vanillin Market Volume (K Units) Forecast, by Application 2019 & 2032
- Table 37: Global Bio Vanillin Market Revenue Million Forecast, by Country 2019 & 2032
- Table 38: Global Bio Vanillin Market Volume K Units Forecast, by Country 2019 & 2032
- Table 39: China Bio Vanillin Market Revenue (Million) Forecast, by Application 2019 & 2032
- Table 40: China Bio Vanillin Market Volume (K Units) Forecast, by Application 2019 & 2032
- Table 41: Japan Bio Vanillin Market Revenue (Million) Forecast, by Application 2019 & 2032
- Table 42: Japan Bio Vanillin Market Volume (K Units) Forecast, by Application 2019 & 2032
- Table 43: India Bio Vanillin Market Revenue (Million) Forecast, by Application 2019 & 2032
- Table 44: India Bio Vanillin Market Volume (K Units) Forecast, by Application 2019 & 2032
- Table 45: South Korea Bio Vanillin Market Revenue (Million) Forecast, by Application 2019 & 2032
- Table 46: South Korea Bio Vanillin Market Volume (K Units) Forecast, by Application 2019 & 2032
- Table 47: Southeast Asia Bio Vanillin Market Revenue (Million) Forecast, by Application 2019 & 2032
- Table 48: Southeast Asia Bio Vanillin Market Volume (K Units) Forecast, by Application 2019 & 2032
- Table 49: Australia Bio Vanillin Market Revenue (Million) Forecast, by Application 2019 & 2032
- Table 50: Australia Bio Vanillin Market Volume (K Units) Forecast, by Application 2019 & 2032
- Table 51: Indonesia Bio Vanillin Market Revenue (Million) Forecast, by Application 2019 & 2032
- Table 52: Indonesia Bio Vanillin Market Volume (K Units) Forecast, by Application 2019 & 2032
- Table 53: Phillipes Bio Vanillin Market Revenue (Million) Forecast, by Application 2019 & 2032
- Table 54: Phillipes Bio Vanillin Market Volume (K Units) Forecast, by Application 2019 & 2032
- Table 55: Singapore Bio Vanillin Market Revenue (Million) Forecast, by Application 2019 & 2032
- Table 56: Singapore Bio Vanillin Market Volume (K Units) Forecast, by Application 2019 & 2032
- Table 57: Thailandc Bio Vanillin Market Revenue (Million) Forecast, by Application 2019 & 2032
- Table 58: Thailandc Bio Vanillin Market Volume (K Units) Forecast, by Application 2019 & 2032
- Table 59: Rest of Asia Pacific Bio Vanillin Market Revenue (Million) Forecast, by Application 2019 & 2032
- Table 60: Rest of Asia Pacific Bio Vanillin Market Volume (K Units) Forecast, by Application 2019 & 2032
- Table 61: Global Bio Vanillin Market Revenue Million Forecast, by Country 2019 & 2032
- Table 62: Global Bio Vanillin Market Volume K Units Forecast, by Country 2019 & 2032
- Table 63: Brazil Bio Vanillin Market Revenue (Million) Forecast, by Application 2019 & 2032
- Table 64: Brazil Bio Vanillin Market Volume (K Units) Forecast, by Application 2019 & 2032
- Table 65: Argentina Bio Vanillin Market Revenue (Million) Forecast, by Application 2019 & 2032
- Table 66: Argentina Bio Vanillin Market Volume (K Units) Forecast, by Application 2019 & 2032
- Table 67: Peru Bio Vanillin Market Revenue (Million) Forecast, by Application 2019 & 2032
- Table 68: Peru Bio Vanillin Market Volume (K Units) Forecast, by Application 2019 & 2032
- Table 69: Chile Bio Vanillin Market Revenue (Million) Forecast, by Application 2019 & 2032
- Table 70: Chile Bio Vanillin Market Volume (K Units) Forecast, by Application 2019 & 2032
- Table 71: Colombia Bio Vanillin Market Revenue (Million) Forecast, by Application 2019 & 2032
- Table 72: Colombia Bio Vanillin Market Volume (K Units) Forecast, by Application 2019 & 2032
- Table 73: Ecuador Bio Vanillin Market Revenue (Million) Forecast, by Application 2019 & 2032
- Table 74: Ecuador Bio Vanillin Market Volume (K Units) Forecast, by Application 2019 & 2032
- Table 75: Venezuela Bio Vanillin Market Revenue (Million) Forecast, by Application 2019 & 2032
- Table 76: Venezuela Bio Vanillin Market Volume (K Units) Forecast, by Application 2019 & 2032
- Table 77: Rest of South America Bio Vanillin Market Revenue (Million) Forecast, by Application 2019 & 2032
- Table 78: Rest of South America Bio Vanillin Market Volume (K Units) Forecast, by Application 2019 & 2032
- Table 79: Global Bio Vanillin Market Revenue Million Forecast, by Country 2019 & 2032
- Table 80: Global Bio Vanillin Market Volume K Units Forecast, by Country 2019 & 2032
- Table 81: United Arab Emirates Bio Vanillin Market Revenue (Million) Forecast, by Application 2019 & 2032
- Table 82: United Arab Emirates Bio Vanillin Market Volume (K Units) Forecast, by Application 2019 & 2032
- Table 83: Saudi Arabia Bio Vanillin Market Revenue (Million) Forecast, by Application 2019 & 2032
- Table 84: Saudi Arabia Bio Vanillin Market Volume (K Units) Forecast, by Application 2019 & 2032
- Table 85: South Africa Bio Vanillin Market Revenue (Million) Forecast, by Application 2019 & 2032
- Table 86: South Africa Bio Vanillin Market Volume (K Units) Forecast, by Application 2019 & 2032
- Table 87: Rest of Middle East and Africa Bio Vanillin Market Revenue (Million) Forecast, by Application 2019 & 2032
- Table 88: Rest of Middle East and Africa Bio Vanillin Market Volume (K Units) Forecast, by Application 2019 & 2032
- Table 89: Global Bio Vanillin Market Revenue Million Forecast, by Application 2019 & 2032
- Table 90: Global Bio Vanillin Market Volume K Units Forecast, by Application 2019 & 2032
- Table 91: Global Bio Vanillin Market Revenue Million Forecast, by Country 2019 & 2032
- Table 92: Global Bio Vanillin Market Volume K Units Forecast, by Country 2019 & 2032
- Table 93: United States Bio Vanillin Market Revenue (Million) Forecast, by Application 2019 & 2032
- Table 94: United States Bio Vanillin Market Volume (K Units) Forecast, by Application 2019 & 2032
- Table 95: Canada Bio Vanillin Market Revenue (Million) Forecast, by Application 2019 & 2032
- Table 96: Canada Bio Vanillin Market Volume (K Units) Forecast, by Application 2019 & 2032
- Table 97: Mexico Bio Vanillin Market Revenue (Million) Forecast, by Application 2019 & 2032
- Table 98: Mexico Bio Vanillin Market Volume (K Units) Forecast, by Application 2019 & 2032
- Table 99: Rest of North America Bio Vanillin Market Revenue (Million) Forecast, by Application 2019 & 2032
- Table 100: Rest of North America Bio Vanillin Market Volume (K Units) Forecast, by Application 2019 & 2032
- Table 101: Global Bio Vanillin Market Revenue Million Forecast, by Application 2019 & 2032
- Table 102: Global Bio Vanillin Market Volume K Units Forecast, by Application 2019 & 2032
- Table 103: Global Bio Vanillin Market Revenue Million Forecast, by Country 2019 & 2032
- Table 104: Global Bio Vanillin Market Volume K Units Forecast, by Country 2019 & 2032
- Table 105: United Kingdom Bio Vanillin Market Revenue (Million) Forecast, by Application 2019 & 2032
- Table 106: United Kingdom Bio Vanillin Market Volume (K Units) Forecast, by Application 2019 & 2032
- Table 107: Germany Bio Vanillin Market Revenue (Million) Forecast, by Application 2019 & 2032
- Table 108: Germany Bio Vanillin Market Volume (K Units) Forecast, by Application 2019 & 2032
- Table 109: France Bio Vanillin Market Revenue (Million) Forecast, by Application 2019 & 2032
- Table 110: France Bio Vanillin Market Volume (K Units) Forecast, by Application 2019 & 2032
- Table 111: Russia Bio Vanillin Market Revenue (Million) Forecast, by Application 2019 & 2032
- Table 112: Russia Bio Vanillin Market Volume (K Units) Forecast, by Application 2019 & 2032
- Table 113: Italy Bio Vanillin Market Revenue (Million) Forecast, by Application 2019 & 2032
- Table 114: Italy Bio Vanillin Market Volume (K Units) Forecast, by Application 2019 & 2032
- Table 115: Rest of Europe Bio Vanillin Market Revenue (Million) Forecast, by Application 2019 & 2032
- Table 116: Rest of Europe Bio Vanillin Market Volume (K Units) Forecast, by Application 2019 & 2032
- Table 117: Global Bio Vanillin Market Revenue Million Forecast, by Application 2019 & 2032
- Table 118: Global Bio Vanillin Market Volume K Units Forecast, by Application 2019 & 2032
- Table 119: Global Bio Vanillin Market Revenue Million Forecast, by Country 2019 & 2032
- Table 120: Global Bio Vanillin Market Volume K Units Forecast, by Country 2019 & 2032
- Table 121: India Bio Vanillin Market Revenue (Million) Forecast, by Application 2019 & 2032
- Table 122: India Bio Vanillin Market Volume (K Units) Forecast, by Application 2019 & 2032
- Table 123: China Bio Vanillin Market Revenue (Million) Forecast, by Application 2019 & 2032
- Table 124: China Bio Vanillin Market Volume (K Units) Forecast, by Application 2019 & 2032
- Table 125: Japan Bio Vanillin Market Revenue (Million) Forecast, by Application 2019 & 2032
- Table 126: Japan Bio Vanillin Market Volume (K Units) Forecast, by Application 2019 & 2032
- Table 127: Australia Bio Vanillin Market Revenue (Million) Forecast, by Application 2019 & 2032
- Table 128: Australia Bio Vanillin Market Volume (K Units) Forecast, by Application 2019 & 2032
- Table 129: Rest of Asia Pacific Bio Vanillin Market Revenue (Million) Forecast, by Application 2019 & 2032
- Table 130: Rest of Asia Pacific Bio Vanillin Market Volume (K Units) Forecast, by Application 2019 & 2032
- Table 131: Global Bio Vanillin Market Revenue Million Forecast, by Application 2019 & 2032
- Table 132: Global Bio Vanillin Market Volume K Units Forecast, by Application 2019 & 2032
- Table 133: Global Bio Vanillin Market Revenue Million Forecast, by Country 2019 & 2032
- Table 134: Global Bio Vanillin Market Volume K Units Forecast, by Country 2019 & 2032
- Table 135: South America Bio Vanillin Market Revenue (Million) Forecast, by Application 2019 & 2032
- Table 136: South America Bio Vanillin Market Volume (K Units) Forecast, by Application 2019 & 2032
- Table 137: Middle East Bio Vanillin Market Revenue (Million) Forecast, by Application 2019 & 2032
- Table 138: Middle East Bio Vanillin Market Volume (K Units) Forecast, by Application 2019 & 2032
Frequently Asked Questions
1. What is the projected Compound Annual Growth Rate (CAGR) of the Bio Vanillin Market?
The projected CAGR is approximately 7.30%.
2. Which companies are prominent players in the Bio Vanillin Market?
Key companies in the market include Firmenich SA, Givaudan, Evolva Holding SA, Archer Daniels Midland Company, Lesaffre, Advanced Biotech, AUROCHEMICAL, Apple Flavor & Fragrance Group Co Ltd.
3. What are the main segments of the Bio Vanillin Market?
The market segments include Application.
4. Can you provide details about the market size?
The market size is estimated to be USD 277.69 Million as of 2022.
5. What are some drivers contributing to market growth?
Surge in Demand for 'Free-from' Food Products; Demand For Convenient And Healthy On-the-go Snacking Options.
6. What are the notable trends driving market growth?
Growing Demand for Bio Vanillin in the Food and Beverage Industry.
7. Are there any restraints impacting market growth?
Health Risk Associated with Certain Ingredients.
8. Can you provide examples of recent developments in the market?
N/A
9. What pricing options are available for accessing the report?
Pricing options include single-user, multi-user, and enterprise licenses priced at USD 4750, USD 5250, and USD 8750 respectively.
10. Is the market size provided in terms of value or volume?
The market size is provided in terms of value, measured in Million and volume, measured in K Units.
11. Are there any specific market keywords associated with the report?
Yes, the market keyword associated with the report is "Bio Vanillin Market," which aids in identifying and referencing the specific market segment covered.
12. How do I determine which pricing option suits my needs best?
The pricing options vary based on user requirements and access needs. Individual users may opt for single-user licenses, while businesses requiring broader access may choose multi-user or enterprise licenses for cost-effective access to the report.
13. Are there any additional resources or data provided in the Bio Vanillin Market report?
While the report offers comprehensive insights, it's advisable to review the specific contents or supplementary materials provided to ascertain if additional resources or data are available.
14. How can I stay updated on further developments or reports in the Bio Vanillin Market?
To stay informed about further developments, trends, and reports in the Bio Vanillin Market, consider subscribing to industry newsletters, following relevant companies and organizations, or regularly checking reputable industry news sources and publications.
Methodology
Step 1 - Identification of Relevant Samples Size from Population Database


Step 2 - Approaches for Defining Global Market Size (Value, Volume* & Price*)

Note*: In applicable scenarios
Step 3 - Data Sources
Primary Research
- Web Analytics
- Survey Reports
- Research Institute
- Latest Research Reports
- Opinion Leaders
Secondary Research
- Annual Reports
- White Paper
- Latest Press Release
- Industry Association
- Paid Database
- Investor Presentations

Step 4 - Data Triangulation
Involves using different sources of information in order to increase the validity of a study
These sources are likely to be stakeholders in a program - participants, other researchers, program staff, other community members, and so on.
Then we put all data in single framework & apply various statistical tools to find out the dynamic on the market.
During the analysis stage, feedback from the stakeholder groups would be compared to determine areas of agreement as well as areas of divergence
