

Key Insights
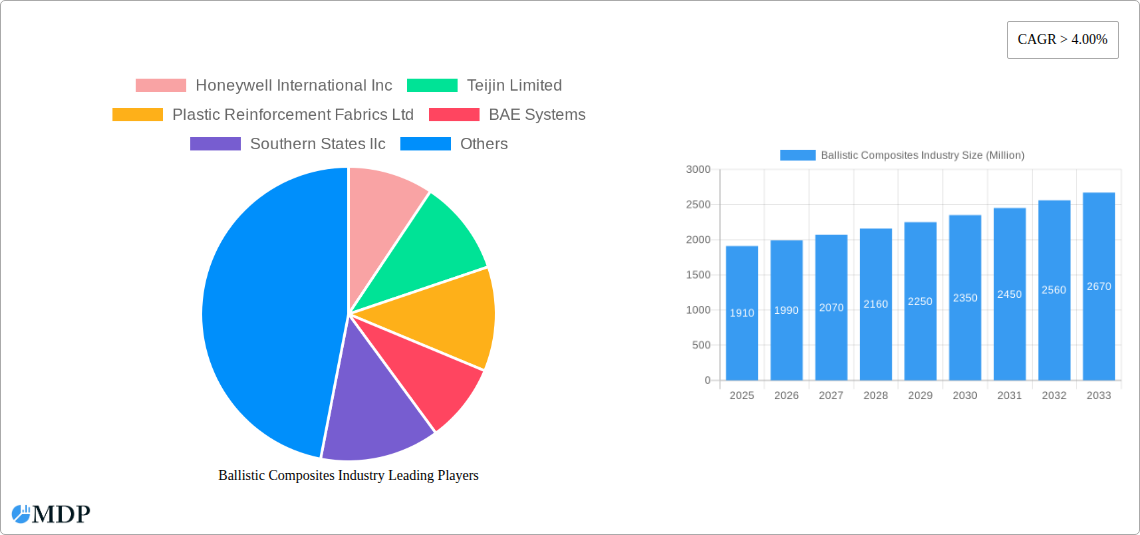
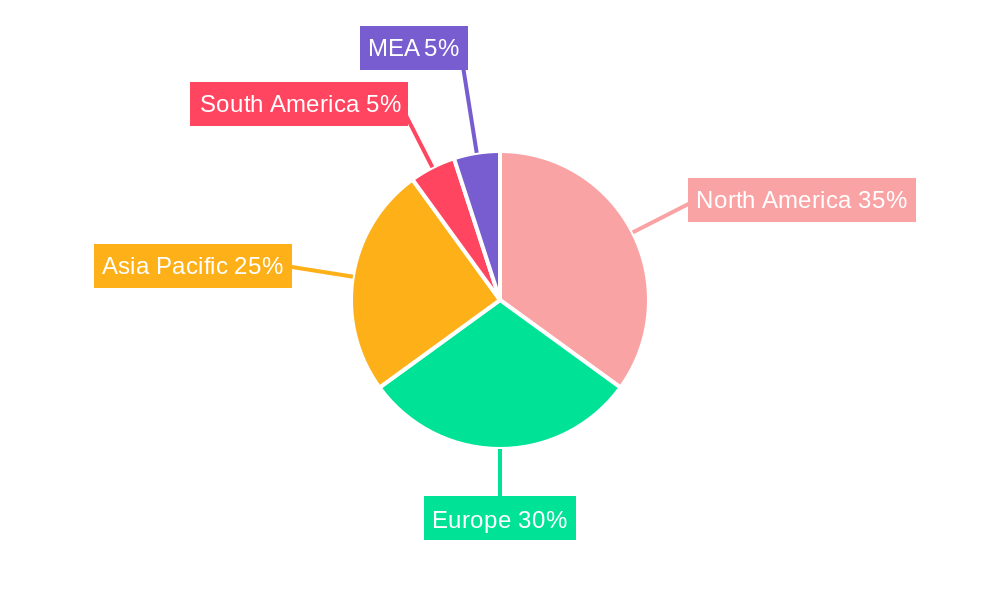
The ballistic composites market, valued at $1.91 billion in 2025, is projected to experience robust growth, exceeding a 4% CAGR through 2033. This expansion is driven by increasing demand for enhanced personal protective equipment (PPE) in military and law enforcement sectors, coupled with rising adoption in civilian applications like high-performance sporting goods and aircraft protection. Key growth drivers include technological advancements in fiber types (aramids, UHMWPE, and increasingly bio-based fibers and nanocomposites), leading to lighter, stronger, and more flexible ballistic materials. The market is segmented by fiber type (aramids holding the largest share due to its established performance and cost-effectiveness), matrix type (polymers dominating due to their versatility and processability), and application (vehicle and body armor representing the largest segments). Regional variations exist, with North America and Europe currently leading in market share due to established industries and stringent safety regulations, while the Asia-Pacific region is expected to witness significant growth fueled by rising military spending and economic development. The presence of numerous established players like Honeywell, Teijin, and DuPont, alongside emerging companies focusing on innovation in bio-based and nanocomposite materials, ensures a competitive landscape driving further advancements.
The restraints to market growth primarily involve the high cost of advanced materials, particularly UHMWPE and specialized nanocomposites, and the complexities involved in manufacturing these composite structures. However, ongoing research and development focused on improving manufacturing processes and exploring cost-effective alternatives, like bio-based materials, are likely to mitigate these limitations. The market's future will be shaped by the continuous quest for improved ballistic performance, lighter weight, increased flexibility, and reduced costs. This will likely lead to a more diverse range of materials and applications, extending beyond traditional defense and security sectors. The integration of smart technologies and sensors into ballistic composites is also a promising area, offering enhanced capabilities and performance monitoring.
Ballistic Composites Industry: Market Report 2019-2033
This comprehensive report provides an in-depth analysis of the Ballistic Composites industry, projecting a market value of $XX Million by 2033. The study covers the historical period (2019-2024), base year (2025), and forecast period (2025-2033), offering invaluable insights for stakeholders across the value chain. Key segments including aramids, UHMWPE, and various applications like vehicle and body armor are analyzed, alongside leading players like Honeywell and DuPont. This report is crucial for strategic decision-making, investment planning, and understanding the future trajectory of this dynamic market.
Ballistic Composites Industry Market Dynamics & Concentration
The ballistic composites market is characterized by moderate concentration, with a handful of major players holding significant market share. Honeywell International Inc., Teijin Limited, and DuPont represent key players, collectively accounting for an estimated xx% of the global market share in 2025. Market dynamics are influenced by several factors:
- Innovation Drivers: Continuous R&D efforts focus on developing lightweight, high-performance materials with enhanced ballistic protection capabilities. This includes advancements in fiber types (e.g., bio-based fibers, nanocomposites) and matrix materials.
- Regulatory Frameworks: Government regulations concerning safety standards and procurement policies significantly impact market growth. Stringent regulations in defense and security sectors drive demand for advanced ballistic composites.
- Product Substitutes: While ballistic composites offer superior protection, alternative materials exist, creating a competitive landscape. The performance-to-cost ratio is a major differentiating factor.
- End-User Trends: Growing demand from defense, law enforcement, and security sectors fuels market expansion. Additionally, rising adoption in high-performance sporting goods and civilian applications presents new opportunities.
- M&A Activities: The industry has witnessed a moderate level of merger and acquisition activity in recent years, with approximately xx deals recorded between 2019 and 2024. These activities aim to consolidate market share, access new technologies, and expand geographic reach.
Ballistic Composites Industry Industry Trends & Analysis
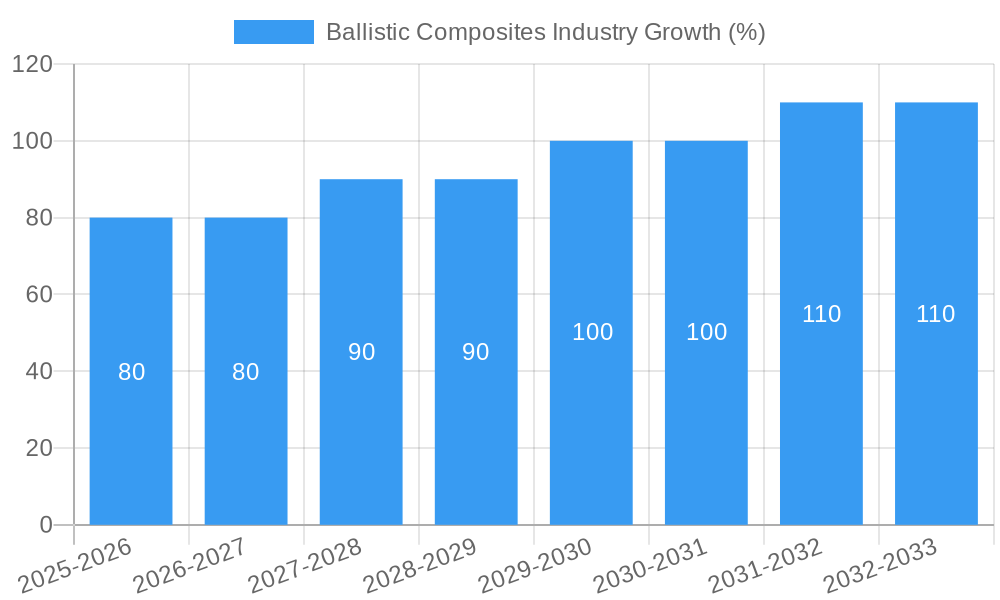
The ballistic composites market exhibits a robust growth trajectory, projected to achieve a CAGR of xx% during the forecast period (2025-2033). This growth is fueled by several key factors:
The increasing demand for advanced protection solutions across various sectors, including military, law enforcement, and civilian applications. Market penetration in emerging economies is expected to rise significantly, further contributing to overall growth. Technological advancements such as the development of lighter, stronger, and more flexible ballistic composites are key drivers. The industry is also witnessing the emergence of innovative product designs, such as customizable ballistic shields and vests with enhanced ergonomics.
Leading Markets & Segments in Ballistic Composites Industry
The North American region currently holds a dominant position in the ballistic composites market, driven by strong demand from defense and law enforcement agencies. Europe and Asia-Pacific are also significant markets, exhibiting substantial growth potential.
Key Drivers by Segment:
Fiber Type:
- Aramids: High strength and lightweight properties make aramids the dominant fiber type, driven by continuous innovation and established supply chains.
- UHMWPE: Growing preference for its exceptional impact resistance and flexibility is increasing its market share.
- S-glass: Cost-effective alternative finding applications in niche segments.
- Others: Bio-based fibers and nanocomposites are gaining traction due to sustainability concerns and performance enhancements.
Matrix Type:
- Polymer: Widely used due to its cost-effectiveness and versatility.
- Polymer-ceramic: Offers enhanced ballistic performance, though at a higher cost.
- Metal: Used in specific applications requiring extreme protection, limited due to weight constraints.
Application:
- Body Armor: Largest segment, with advancements focusing on comfort, weight reduction, and improved ballistic protection.
- Vehicle Armor: Growing demand for vehicle protection against ballistic threats.
- Helmet & Face Protection: Specialized designs for different applications, driving segment growth.
- Other Applications: Aircraft and marine protection, along with high-performance sporting goods, are emerging sectors showing significant promise.
Ballistic Composites Industry Product Developments
Recent product innovations focus on enhancing ballistic protection while reducing weight and improving comfort. Companies are investing in advanced materials and manufacturing processes to achieve superior performance and cost-effectiveness. The trend towards customization and personalization of ballistic protection equipment is also gaining momentum, particularly in body armor and shields. This allows for a better fit and optimized protection based on individual needs.
Key Drivers of Ballistic Composites Industry Growth
Technological advancements in materials science, leading to lighter, stronger, and more flexible ballistic composites. Increased defense spending globally, coupled with growing demand from law enforcement agencies. Stringent safety and security regulations driving the adoption of advanced ballistic protection solutions.
Challenges in the Ballistic Composites Industry Market
High raw material costs, particularly for specialized fibers like aramids and UHMWPE, impacting production costs. Supply chain disruptions can affect the availability of critical materials and components, impacting production timelines and market stability. Intense competition among established players and new entrants creates pressure on pricing and profit margins.
Emerging Opportunities in Ballistic Composites Industry
Advancements in nanocomposites and bio-based fibers offering potential for enhanced performance and sustainability. Strategic partnerships and collaborations among materials suppliers, manufacturers, and end-users are creating opportunities for innovation and market expansion. Growing demand for advanced protection solutions in emerging markets represents significant growth potential.
Leading Players in the Ballistic Composites Industry Sector
- Honeywell International Inc
- Teijin Limited
- Plastic Reinforcement Fabrics Ltd
- BAE Systems
- Southern States llc
- Roihu Inc
- Barrday Inc
- TenCate Protective Fabrics
- MKU LIMITED
- Coherent Corp
- Integris
- Morgan Advanced Materials
- DSM
- DuPont
- Gaffco Ballistics
- Gurit Holding AG
- ArmorCore
Key Milestones in Ballistic Composites Industry Industry
- November 2023: Integris Composites launched its Rapid Don/Doff body armor vests, significantly reducing donning/doffing time. This innovation improves operational efficiency for law enforcement and military personnel.
- November 2023: Integris Composites unveiled customizable ballistic shields and vests ("Stand 5 F009") at Milipol Paris, showcasing a "make your own shield" concept, catering to individual needs and preferences.
Strategic Outlook for Ballistic Composites Industry Market
The ballistic composites market is poised for continued growth, driven by technological advancements and increasing demand across diverse sectors. Strategic partnerships, investments in R&D, and expansion into emerging markets will be crucial for companies to capitalize on future opportunities. Focus on sustainable materials and innovative product designs will further shape the market's evolution in the coming years.
Ballistic Composites Industry Segmentation
-
1. Fiber Type
- 1.1. Aramids
- 1.2. Ultra-high-molecular Weight Polyethylene (UHMWPE)
- 1.3. S-glass
- 1.4. Others F
-
2. Matrix Type
- 2.1. Polymer
- 2.2. Polymer-ceramic
- 2.3. Metal
-
3. Application
- 3.1. Vehicle Armor
- 3.2. Body Armor
- 3.3. Helmet and Face Protection
- 3.4. Other Ap
Ballistic Composites Industry Segmentation By Geography
-
1. Asia Pacific
- 1.1. China
- 1.2. India
- 1.3. Japan
- 1.4. South Korea
- 1.5. Rest of Asia Pacific
-
2. North America
- 2.1. United States
- 2.2. Canada
- 2.3. Mexico
-
3. Europe
- 3.1. Germany
- 3.2. United Kingdom
- 3.3. Italy
- 3.4. France
- 3.5. Spain
- 3.6. Rest of Europe
-
4. South America
- 4.1. Brazil
- 4.2. Argentina
- 4.3. Rest of South America
-
5. Middle East and Africa
- 5.1. Saudi Arabia
- 5.2. South Africa
- 5.3. Rest of Middle East and Africa
Ballistic Composites Industry REPORT HIGHLIGHTS
| Aspects | Details |
|---|---|
| Study Period | 2019-2033 |
| Base Year | 2024 |
| Estimated Year | 2025 |
| Forecast Period | 2025-2033 |
| Historical Period | 2019-2024 |
| Growth Rate | CAGR of > 4.00% from 2019-2033 |
| Segmentation |
|
Table of Contents
- 1. Introduction
- 1.1. Research Scope
- 1.2. Market Segmentation
- 1.3. Research Methodology
- 1.4. Definitions and Assumptions
- 2. Executive Summary
- 2.1. Introduction
- 3. Market Dynamics
- 3.1. Introduction
- 3.2. Market Drivers
- 3.2.1. Rise in Defense Expenditure; Increasing Demand for Lightweight Materials in the Aerospace and Defense Industry; Other Drivers
- 3.3. Market Restrains
- 3.3.1. High Processing and Manufacturing Costs; Volatile Raw Material Supply
- 3.4. Market Trends
- 3.4.1. Increasing Demand for Vehicle Armors
- 4. Market Factor Analysis
- 4.1. Porters Five Forces
- 4.2. Supply/Value Chain
- 4.3. PESTEL analysis
- 4.4. Market Entropy
- 4.5. Patent/Trademark Analysis
- 5. Global Ballistic Composites Industry Analysis, Insights and Forecast, 2019-2031
- 5.1. Market Analysis, Insights and Forecast - by Fiber Type
- 5.1.1. Aramids
- 5.1.2. Ultra-high-molecular Weight Polyethylene (UHMWPE)
- 5.1.3. S-glass
- 5.1.4. Others F
- 5.2. Market Analysis, Insights and Forecast - by Matrix Type
- 5.2.1. Polymer
- 5.2.2. Polymer-ceramic
- 5.2.3. Metal
- 5.3. Market Analysis, Insights and Forecast - by Application
- 5.3.1. Vehicle Armor
- 5.3.2. Body Armor
- 5.3.3. Helmet and Face Protection
- 5.3.4. Other Ap
- 5.4. Market Analysis, Insights and Forecast - by Region
- 5.4.1. Asia Pacific
- 5.4.2. North America
- 5.4.3. Europe
- 5.4.4. South America
- 5.4.5. Middle East and Africa
- 5.1. Market Analysis, Insights and Forecast - by Fiber Type
- 6. Asia Pacific Ballistic Composites Industry Analysis, Insights and Forecast, 2019-2031
- 6.1. Market Analysis, Insights and Forecast - by Fiber Type
- 6.1.1. Aramids
- 6.1.2. Ultra-high-molecular Weight Polyethylene (UHMWPE)
- 6.1.3. S-glass
- 6.1.4. Others F
- 6.2. Market Analysis, Insights and Forecast - by Matrix Type
- 6.2.1. Polymer
- 6.2.2. Polymer-ceramic
- 6.2.3. Metal
- 6.3. Market Analysis, Insights and Forecast - by Application
- 6.3.1. Vehicle Armor
- 6.3.2. Body Armor
- 6.3.3. Helmet and Face Protection
- 6.3.4. Other Ap
- 6.1. Market Analysis, Insights and Forecast - by Fiber Type
- 7. North America Ballistic Composites Industry Analysis, Insights and Forecast, 2019-2031
- 7.1. Market Analysis, Insights and Forecast - by Fiber Type
- 7.1.1. Aramids
- 7.1.2. Ultra-high-molecular Weight Polyethylene (UHMWPE)
- 7.1.3. S-glass
- 7.1.4. Others F
- 7.2. Market Analysis, Insights and Forecast - by Matrix Type
- 7.2.1. Polymer
- 7.2.2. Polymer-ceramic
- 7.2.3. Metal
- 7.3. Market Analysis, Insights and Forecast - by Application
- 7.3.1. Vehicle Armor
- 7.3.2. Body Armor
- 7.3.3. Helmet and Face Protection
- 7.3.4. Other Ap
- 7.1. Market Analysis, Insights and Forecast - by Fiber Type
- 8. Europe Ballistic Composites Industry Analysis, Insights and Forecast, 2019-2031
- 8.1. Market Analysis, Insights and Forecast - by Fiber Type
- 8.1.1. Aramids
- 8.1.2. Ultra-high-molecular Weight Polyethylene (UHMWPE)
- 8.1.3. S-glass
- 8.1.4. Others F
- 8.2. Market Analysis, Insights and Forecast - by Matrix Type
- 8.2.1. Polymer
- 8.2.2. Polymer-ceramic
- 8.2.3. Metal
- 8.3. Market Analysis, Insights and Forecast - by Application
- 8.3.1. Vehicle Armor
- 8.3.2. Body Armor
- 8.3.3. Helmet and Face Protection
- 8.3.4. Other Ap
- 8.1. Market Analysis, Insights and Forecast - by Fiber Type
- 9. South America Ballistic Composites Industry Analysis, Insights and Forecast, 2019-2031
- 9.1. Market Analysis, Insights and Forecast - by Fiber Type
- 9.1.1. Aramids
- 9.1.2. Ultra-high-molecular Weight Polyethylene (UHMWPE)
- 9.1.3. S-glass
- 9.1.4. Others F
- 9.2. Market Analysis, Insights and Forecast - by Matrix Type
- 9.2.1. Polymer
- 9.2.2. Polymer-ceramic
- 9.2.3. Metal
- 9.3. Market Analysis, Insights and Forecast - by Application
- 9.3.1. Vehicle Armor
- 9.3.2. Body Armor
- 9.3.3. Helmet and Face Protection
- 9.3.4. Other Ap
- 9.1. Market Analysis, Insights and Forecast - by Fiber Type
- 10. Middle East and Africa Ballistic Composites Industry Analysis, Insights and Forecast, 2019-2031
- 10.1. Market Analysis, Insights and Forecast - by Fiber Type
- 10.1.1. Aramids
- 10.1.2. Ultra-high-molecular Weight Polyethylene (UHMWPE)
- 10.1.3. S-glass
- 10.1.4. Others F
- 10.2. Market Analysis, Insights and Forecast - by Matrix Type
- 10.2.1. Polymer
- 10.2.2. Polymer-ceramic
- 10.2.3. Metal
- 10.3. Market Analysis, Insights and Forecast - by Application
- 10.3.1. Vehicle Armor
- 10.3.2. Body Armor
- 10.3.3. Helmet and Face Protection
- 10.3.4. Other Ap
- 10.1. Market Analysis, Insights and Forecast - by Fiber Type
- 11. North America Ballistic Composites Industry Analysis, Insights and Forecast, 2019-2031
- 11.1. Market Analysis, Insights and Forecast - By Country/Sub-region
- 11.1.1 United States
- 11.1.2 Canada
- 11.1.3 Mexico
- 12. Europe Ballistic Composites Industry Analysis, Insights and Forecast, 2019-2031
- 12.1. Market Analysis, Insights and Forecast - By Country/Sub-region
- 12.1.1 Germany
- 12.1.2 France
- 12.1.3 Italy
- 12.1.4 United Kingdom
- 12.1.5 Netherlands
- 12.1.6 Rest of Europe
- 13. Asia Pacific Ballistic Composites Industry Analysis, Insights and Forecast, 2019-2031
- 13.1. Market Analysis, Insights and Forecast - By Country/Sub-region
- 13.1.1 China
- 13.1.2 Japan
- 13.1.3 India
- 13.1.4 South Korea
- 13.1.5 Taiwan
- 13.1.6 Australia
- 13.1.7 Rest of Asia-Pacific
- 14. South America Ballistic Composites Industry Analysis, Insights and Forecast, 2019-2031
- 14.1. Market Analysis, Insights and Forecast - By Country/Sub-region
- 14.1.1 Brazil
- 14.1.2 Argentina
- 14.1.3 Rest of South America
- 15. MEA Ballistic Composites Industry Analysis, Insights and Forecast, 2019-2031
- 15.1. Market Analysis, Insights and Forecast - By Country/Sub-region
- 15.1.1 Middle East
- 15.1.2 Africa
- 16. Competitive Analysis
- 16.1. Global Market Share Analysis 2024
- 16.2. Company Profiles
- 16.2.1 Honeywell International Inc
- 16.2.1.1. Overview
- 16.2.1.2. Products
- 16.2.1.3. SWOT Analysis
- 16.2.1.4. Recent Developments
- 16.2.1.5. Financials (Based on Availability)
- 16.2.2 Teijin Limited
- 16.2.2.1. Overview
- 16.2.2.2. Products
- 16.2.2.3. SWOT Analysis
- 16.2.2.4. Recent Developments
- 16.2.2.5. Financials (Based on Availability)
- 16.2.3 Plastic Reinforcement Fabrics Ltd
- 16.2.3.1. Overview
- 16.2.3.2. Products
- 16.2.3.3. SWOT Analysis
- 16.2.3.4. Recent Developments
- 16.2.3.5. Financials (Based on Availability)
- 16.2.4 BAE Systems
- 16.2.4.1. Overview
- 16.2.4.2. Products
- 16.2.4.3. SWOT Analysis
- 16.2.4.4. Recent Developments
- 16.2.4.5. Financials (Based on Availability)
- 16.2.5 Southern States llc
- 16.2.5.1. Overview
- 16.2.5.2. Products
- 16.2.5.3. SWOT Analysis
- 16.2.5.4. Recent Developments
- 16.2.5.5. Financials (Based on Availability)
- 16.2.6 Roihu Inc
- 16.2.6.1. Overview
- 16.2.6.2. Products
- 16.2.6.3. SWOT Analysis
- 16.2.6.4. Recent Developments
- 16.2.6.5. Financials (Based on Availability)
- 16.2.7 Barrday Inc
- 16.2.7.1. Overview
- 16.2.7.2. Products
- 16.2.7.3. SWOT Analysis
- 16.2.7.4. Recent Developments
- 16.2.7.5. Financials (Based on Availability)
- 16.2.8 TenCate Protective Fabrics
- 16.2.8.1. Overview
- 16.2.8.2. Products
- 16.2.8.3. SWOT Analysis
- 16.2.8.4. Recent Developments
- 16.2.8.5. Financials (Based on Availability)
- 16.2.9 MKU LIMITED
- 16.2.9.1. Overview
- 16.2.9.2. Products
- 16.2.9.3. SWOT Analysis
- 16.2.9.4. Recent Developments
- 16.2.9.5. Financials (Based on Availability)
- 16.2.10 Coherent Corp
- 16.2.10.1. Overview
- 16.2.10.2. Products
- 16.2.10.3. SWOT Analysis
- 16.2.10.4. Recent Developments
- 16.2.10.5. Financials (Based on Availability)
- 16.2.11 Integris
- 16.2.11.1. Overview
- 16.2.11.2. Products
- 16.2.11.3. SWOT Analysis
- 16.2.11.4. Recent Developments
- 16.2.11.5. Financials (Based on Availability)
- 16.2.12 Morgan Advanced Materials
- 16.2.12.1. Overview
- 16.2.12.2. Products
- 16.2.12.3. SWOT Analysis
- 16.2.12.4. Recent Developments
- 16.2.12.5. Financials (Based on Availability)
- 16.2.13 DSM
- 16.2.13.1. Overview
- 16.2.13.2. Products
- 16.2.13.3. SWOT Analysis
- 16.2.13.4. Recent Developments
- 16.2.13.5. Financials (Based on Availability)
- 16.2.14 DuPont
- 16.2.14.1. Overview
- 16.2.14.2. Products
- 16.2.14.3. SWOT Analysis
- 16.2.14.4. Recent Developments
- 16.2.14.5. Financials (Based on Availability)
- 16.2.15 Gaffco Ballistics
- 16.2.15.1. Overview
- 16.2.15.2. Products
- 16.2.15.3. SWOT Analysis
- 16.2.15.4. Recent Developments
- 16.2.15.5. Financials (Based on Availability)
- 16.2.16 Gurit Holding AG
- 16.2.16.1. Overview
- 16.2.16.2. Products
- 16.2.16.3. SWOT Analysis
- 16.2.16.4. Recent Developments
- 16.2.16.5. Financials (Based on Availability)
- 16.2.17 ArmorCore
- 16.2.17.1. Overview
- 16.2.17.2. Products
- 16.2.17.3. SWOT Analysis
- 16.2.17.4. Recent Developments
- 16.2.17.5. Financials (Based on Availability)
- 16.2.1 Honeywell International Inc
List of Figures
- Figure 1: Global Ballistic Composites Industry Revenue Breakdown (Million, %) by Region 2024 & 2032
- Figure 2: Global Ballistic Composites Industry Volume Breakdown (K Tons, %) by Region 2024 & 2032
- Figure 3: North America Ballistic Composites Industry Revenue (Million), by Country 2024 & 2032
- Figure 4: North America Ballistic Composites Industry Volume (K Tons), by Country 2024 & 2032
- Figure 5: North America Ballistic Composites Industry Revenue Share (%), by Country 2024 & 2032
- Figure 6: North America Ballistic Composites Industry Volume Share (%), by Country 2024 & 2032
- Figure 7: Europe Ballistic Composites Industry Revenue (Million), by Country 2024 & 2032
- Figure 8: Europe Ballistic Composites Industry Volume (K Tons), by Country 2024 & 2032
- Figure 9: Europe Ballistic Composites Industry Revenue Share (%), by Country 2024 & 2032
- Figure 10: Europe Ballistic Composites Industry Volume Share (%), by Country 2024 & 2032
- Figure 11: Asia Pacific Ballistic Composites Industry Revenue (Million), by Country 2024 & 2032
- Figure 12: Asia Pacific Ballistic Composites Industry Volume (K Tons), by Country 2024 & 2032
- Figure 13: Asia Pacific Ballistic Composites Industry Revenue Share (%), by Country 2024 & 2032
- Figure 14: Asia Pacific Ballistic Composites Industry Volume Share (%), by Country 2024 & 2032
- Figure 15: South America Ballistic Composites Industry Revenue (Million), by Country 2024 & 2032
- Figure 16: South America Ballistic Composites Industry Volume (K Tons), by Country 2024 & 2032
- Figure 17: South America Ballistic Composites Industry Revenue Share (%), by Country 2024 & 2032
- Figure 18: South America Ballistic Composites Industry Volume Share (%), by Country 2024 & 2032
- Figure 19: MEA Ballistic Composites Industry Revenue (Million), by Country 2024 & 2032
- Figure 20: MEA Ballistic Composites Industry Volume (K Tons), by Country 2024 & 2032
- Figure 21: MEA Ballistic Composites Industry Revenue Share (%), by Country 2024 & 2032
- Figure 22: MEA Ballistic Composites Industry Volume Share (%), by Country 2024 & 2032
- Figure 23: Asia Pacific Ballistic Composites Industry Revenue (Million), by Fiber Type 2024 & 2032
- Figure 24: Asia Pacific Ballistic Composites Industry Volume (K Tons), by Fiber Type 2024 & 2032
- Figure 25: Asia Pacific Ballistic Composites Industry Revenue Share (%), by Fiber Type 2024 & 2032
- Figure 26: Asia Pacific Ballistic Composites Industry Volume Share (%), by Fiber Type 2024 & 2032
- Figure 27: Asia Pacific Ballistic Composites Industry Revenue (Million), by Matrix Type 2024 & 2032
- Figure 28: Asia Pacific Ballistic Composites Industry Volume (K Tons), by Matrix Type 2024 & 2032
- Figure 29: Asia Pacific Ballistic Composites Industry Revenue Share (%), by Matrix Type 2024 & 2032
- Figure 30: Asia Pacific Ballistic Composites Industry Volume Share (%), by Matrix Type 2024 & 2032
- Figure 31: Asia Pacific Ballistic Composites Industry Revenue (Million), by Application 2024 & 2032
- Figure 32: Asia Pacific Ballistic Composites Industry Volume (K Tons), by Application 2024 & 2032
- Figure 33: Asia Pacific Ballistic Composites Industry Revenue Share (%), by Application 2024 & 2032
- Figure 34: Asia Pacific Ballistic Composites Industry Volume Share (%), by Application 2024 & 2032
- Figure 35: Asia Pacific Ballistic Composites Industry Revenue (Million), by Country 2024 & 2032
- Figure 36: Asia Pacific Ballistic Composites Industry Volume (K Tons), by Country 2024 & 2032
- Figure 37: Asia Pacific Ballistic Composites Industry Revenue Share (%), by Country 2024 & 2032
- Figure 38: Asia Pacific Ballistic Composites Industry Volume Share (%), by Country 2024 & 2032
- Figure 39: North America Ballistic Composites Industry Revenue (Million), by Fiber Type 2024 & 2032
- Figure 40: North America Ballistic Composites Industry Volume (K Tons), by Fiber Type 2024 & 2032
- Figure 41: North America Ballistic Composites Industry Revenue Share (%), by Fiber Type 2024 & 2032
- Figure 42: North America Ballistic Composites Industry Volume Share (%), by Fiber Type 2024 & 2032
- Figure 43: North America Ballistic Composites Industry Revenue (Million), by Matrix Type 2024 & 2032
- Figure 44: North America Ballistic Composites Industry Volume (K Tons), by Matrix Type 2024 & 2032
- Figure 45: North America Ballistic Composites Industry Revenue Share (%), by Matrix Type 2024 & 2032
- Figure 46: North America Ballistic Composites Industry Volume Share (%), by Matrix Type 2024 & 2032
- Figure 47: North America Ballistic Composites Industry Revenue (Million), by Application 2024 & 2032
- Figure 48: North America Ballistic Composites Industry Volume (K Tons), by Application 2024 & 2032
- Figure 49: North America Ballistic Composites Industry Revenue Share (%), by Application 2024 & 2032
- Figure 50: North America Ballistic Composites Industry Volume Share (%), by Application 2024 & 2032
- Figure 51: North America Ballistic Composites Industry Revenue (Million), by Country 2024 & 2032
- Figure 52: North America Ballistic Composites Industry Volume (K Tons), by Country 2024 & 2032
- Figure 53: North America Ballistic Composites Industry Revenue Share (%), by Country 2024 & 2032
- Figure 54: North America Ballistic Composites Industry Volume Share (%), by Country 2024 & 2032
- Figure 55: Europe Ballistic Composites Industry Revenue (Million), by Fiber Type 2024 & 2032
- Figure 56: Europe Ballistic Composites Industry Volume (K Tons), by Fiber Type 2024 & 2032
- Figure 57: Europe Ballistic Composites Industry Revenue Share (%), by Fiber Type 2024 & 2032
- Figure 58: Europe Ballistic Composites Industry Volume Share (%), by Fiber Type 2024 & 2032
- Figure 59: Europe Ballistic Composites Industry Revenue (Million), by Matrix Type 2024 & 2032
- Figure 60: Europe Ballistic Composites Industry Volume (K Tons), by Matrix Type 2024 & 2032
- Figure 61: Europe Ballistic Composites Industry Revenue Share (%), by Matrix Type 2024 & 2032
- Figure 62: Europe Ballistic Composites Industry Volume Share (%), by Matrix Type 2024 & 2032
- Figure 63: Europe Ballistic Composites Industry Revenue (Million), by Application 2024 & 2032
- Figure 64: Europe Ballistic Composites Industry Volume (K Tons), by Application 2024 & 2032
- Figure 65: Europe Ballistic Composites Industry Revenue Share (%), by Application 2024 & 2032
- Figure 66: Europe Ballistic Composites Industry Volume Share (%), by Application 2024 & 2032
- Figure 67: Europe Ballistic Composites Industry Revenue (Million), by Country 2024 & 2032
- Figure 68: Europe Ballistic Composites Industry Volume (K Tons), by Country 2024 & 2032
- Figure 69: Europe Ballistic Composites Industry Revenue Share (%), by Country 2024 & 2032
- Figure 70: Europe Ballistic Composites Industry Volume Share (%), by Country 2024 & 2032
- Figure 71: South America Ballistic Composites Industry Revenue (Million), by Fiber Type 2024 & 2032
- Figure 72: South America Ballistic Composites Industry Volume (K Tons), by Fiber Type 2024 & 2032
- Figure 73: South America Ballistic Composites Industry Revenue Share (%), by Fiber Type 2024 & 2032
- Figure 74: South America Ballistic Composites Industry Volume Share (%), by Fiber Type 2024 & 2032
- Figure 75: South America Ballistic Composites Industry Revenue (Million), by Matrix Type 2024 & 2032
- Figure 76: South America Ballistic Composites Industry Volume (K Tons), by Matrix Type 2024 & 2032
- Figure 77: South America Ballistic Composites Industry Revenue Share (%), by Matrix Type 2024 & 2032
- Figure 78: South America Ballistic Composites Industry Volume Share (%), by Matrix Type 2024 & 2032
- Figure 79: South America Ballistic Composites Industry Revenue (Million), by Application 2024 & 2032
- Figure 80: South America Ballistic Composites Industry Volume (K Tons), by Application 2024 & 2032
- Figure 81: South America Ballistic Composites Industry Revenue Share (%), by Application 2024 & 2032
- Figure 82: South America Ballistic Composites Industry Volume Share (%), by Application 2024 & 2032
- Figure 83: South America Ballistic Composites Industry Revenue (Million), by Country 2024 & 2032
- Figure 84: South America Ballistic Composites Industry Volume (K Tons), by Country 2024 & 2032
- Figure 85: South America Ballistic Composites Industry Revenue Share (%), by Country 2024 & 2032
- Figure 86: South America Ballistic Composites Industry Volume Share (%), by Country 2024 & 2032
- Figure 87: Middle East and Africa Ballistic Composites Industry Revenue (Million), by Fiber Type 2024 & 2032
- Figure 88: Middle East and Africa Ballistic Composites Industry Volume (K Tons), by Fiber Type 2024 & 2032
- Figure 89: Middle East and Africa Ballistic Composites Industry Revenue Share (%), by Fiber Type 2024 & 2032
- Figure 90: Middle East and Africa Ballistic Composites Industry Volume Share (%), by Fiber Type 2024 & 2032
- Figure 91: Middle East and Africa Ballistic Composites Industry Revenue (Million), by Matrix Type 2024 & 2032
- Figure 92: Middle East and Africa Ballistic Composites Industry Volume (K Tons), by Matrix Type 2024 & 2032
- Figure 93: Middle East and Africa Ballistic Composites Industry Revenue Share (%), by Matrix Type 2024 & 2032
- Figure 94: Middle East and Africa Ballistic Composites Industry Volume Share (%), by Matrix Type 2024 & 2032
- Figure 95: Middle East and Africa Ballistic Composites Industry Revenue (Million), by Application 2024 & 2032
- Figure 96: Middle East and Africa Ballistic Composites Industry Volume (K Tons), by Application 2024 & 2032
- Figure 97: Middle East and Africa Ballistic Composites Industry Revenue Share (%), by Application 2024 & 2032
- Figure 98: Middle East and Africa Ballistic Composites Industry Volume Share (%), by Application 2024 & 2032
- Figure 99: Middle East and Africa Ballistic Composites Industry Revenue (Million), by Country 2024 & 2032
- Figure 100: Middle East and Africa Ballistic Composites Industry Volume (K Tons), by Country 2024 & 2032
- Figure 101: Middle East and Africa Ballistic Composites Industry Revenue Share (%), by Country 2024 & 2032
- Figure 102: Middle East and Africa Ballistic Composites Industry Volume Share (%), by Country 2024 & 2032
List of Tables
- Table 1: Global Ballistic Composites Industry Revenue Million Forecast, by Region 2019 & 2032
- Table 2: Global Ballistic Composites Industry Volume K Tons Forecast, by Region 2019 & 2032
- Table 3: Global Ballistic Composites Industry Revenue Million Forecast, by Fiber Type 2019 & 2032
- Table 4: Global Ballistic Composites Industry Volume K Tons Forecast, by Fiber Type 2019 & 2032
- Table 5: Global Ballistic Composites Industry Revenue Million Forecast, by Matrix Type 2019 & 2032
- Table 6: Global Ballistic Composites Industry Volume K Tons Forecast, by Matrix Type 2019 & 2032
- Table 7: Global Ballistic Composites Industry Revenue Million Forecast, by Application 2019 & 2032
- Table 8: Global Ballistic Composites Industry Volume K Tons Forecast, by Application 2019 & 2032
- Table 9: Global Ballistic Composites Industry Revenue Million Forecast, by Region 2019 & 2032
- Table 10: Global Ballistic Composites Industry Volume K Tons Forecast, by Region 2019 & 2032
- Table 11: Global Ballistic Composites Industry Revenue Million Forecast, by Country 2019 & 2032
- Table 12: Global Ballistic Composites Industry Volume K Tons Forecast, by Country 2019 & 2032
- Table 13: United States Ballistic Composites Industry Revenue (Million) Forecast, by Application 2019 & 2032
- Table 14: United States Ballistic Composites Industry Volume (K Tons) Forecast, by Application 2019 & 2032
- Table 15: Canada Ballistic Composites Industry Revenue (Million) Forecast, by Application 2019 & 2032
- Table 16: Canada Ballistic Composites Industry Volume (K Tons) Forecast, by Application 2019 & 2032
- Table 17: Mexico Ballistic Composites Industry Revenue (Million) Forecast, by Application 2019 & 2032
- Table 18: Mexico Ballistic Composites Industry Volume (K Tons) Forecast, by Application 2019 & 2032
- Table 19: Global Ballistic Composites Industry Revenue Million Forecast, by Country 2019 & 2032
- Table 20: Global Ballistic Composites Industry Volume K Tons Forecast, by Country 2019 & 2032
- Table 21: Germany Ballistic Composites Industry Revenue (Million) Forecast, by Application 2019 & 2032
- Table 22: Germany Ballistic Composites Industry Volume (K Tons) Forecast, by Application 2019 & 2032
- Table 23: France Ballistic Composites Industry Revenue (Million) Forecast, by Application 2019 & 2032
- Table 24: France Ballistic Composites Industry Volume (K Tons) Forecast, by Application 2019 & 2032
- Table 25: Italy Ballistic Composites Industry Revenue (Million) Forecast, by Application 2019 & 2032
- Table 26: Italy Ballistic Composites Industry Volume (K Tons) Forecast, by Application 2019 & 2032
- Table 27: United Kingdom Ballistic Composites Industry Revenue (Million) Forecast, by Application 2019 & 2032
- Table 28: United Kingdom Ballistic Composites Industry Volume (K Tons) Forecast, by Application 2019 & 2032
- Table 29: Netherlands Ballistic Composites Industry Revenue (Million) Forecast, by Application 2019 & 2032
- Table 30: Netherlands Ballistic Composites Industry Volume (K Tons) Forecast, by Application 2019 & 2032
- Table 31: Rest of Europe Ballistic Composites Industry Revenue (Million) Forecast, by Application 2019 & 2032
- Table 32: Rest of Europe Ballistic Composites Industry Volume (K Tons) Forecast, by Application 2019 & 2032
- Table 33: Global Ballistic Composites Industry Revenue Million Forecast, by Country 2019 & 2032
- Table 34: Global Ballistic Composites Industry Volume K Tons Forecast, by Country 2019 & 2032
- Table 35: China Ballistic Composites Industry Revenue (Million) Forecast, by Application 2019 & 2032
- Table 36: China Ballistic Composites Industry Volume (K Tons) Forecast, by Application 2019 & 2032
- Table 37: Japan Ballistic Composites Industry Revenue (Million) Forecast, by Application 2019 & 2032
- Table 38: Japan Ballistic Composites Industry Volume (K Tons) Forecast, by Application 2019 & 2032
- Table 39: India Ballistic Composites Industry Revenue (Million) Forecast, by Application 2019 & 2032
- Table 40: India Ballistic Composites Industry Volume (K Tons) Forecast, by Application 2019 & 2032
- Table 41: South Korea Ballistic Composites Industry Revenue (Million) Forecast, by Application 2019 & 2032
- Table 42: South Korea Ballistic Composites Industry Volume (K Tons) Forecast, by Application 2019 & 2032
- Table 43: Taiwan Ballistic Composites Industry Revenue (Million) Forecast, by Application 2019 & 2032
- Table 44: Taiwan Ballistic Composites Industry Volume (K Tons) Forecast, by Application 2019 & 2032
- Table 45: Australia Ballistic Composites Industry Revenue (Million) Forecast, by Application 2019 & 2032
- Table 46: Australia Ballistic Composites Industry Volume (K Tons) Forecast, by Application 2019 & 2032
- Table 47: Rest of Asia-Pacific Ballistic Composites Industry Revenue (Million) Forecast, by Application 2019 & 2032
- Table 48: Rest of Asia-Pacific Ballistic Composites Industry Volume (K Tons) Forecast, by Application 2019 & 2032
- Table 49: Global Ballistic Composites Industry Revenue Million Forecast, by Country 2019 & 2032
- Table 50: Global Ballistic Composites Industry Volume K Tons Forecast, by Country 2019 & 2032
- Table 51: Brazil Ballistic Composites Industry Revenue (Million) Forecast, by Application 2019 & 2032
- Table 52: Brazil Ballistic Composites Industry Volume (K Tons) Forecast, by Application 2019 & 2032
- Table 53: Argentina Ballistic Composites Industry Revenue (Million) Forecast, by Application 2019 & 2032
- Table 54: Argentina Ballistic Composites Industry Volume (K Tons) Forecast, by Application 2019 & 2032
- Table 55: Rest of South America Ballistic Composites Industry Revenue (Million) Forecast, by Application 2019 & 2032
- Table 56: Rest of South America Ballistic Composites Industry Volume (K Tons) Forecast, by Application 2019 & 2032
- Table 57: Global Ballistic Composites Industry Revenue Million Forecast, by Country 2019 & 2032
- Table 58: Global Ballistic Composites Industry Volume K Tons Forecast, by Country 2019 & 2032
- Table 59: Middle East Ballistic Composites Industry Revenue (Million) Forecast, by Application 2019 & 2032
- Table 60: Middle East Ballistic Composites Industry Volume (K Tons) Forecast, by Application 2019 & 2032
- Table 61: Africa Ballistic Composites Industry Revenue (Million) Forecast, by Application 2019 & 2032
- Table 62: Africa Ballistic Composites Industry Volume (K Tons) Forecast, by Application 2019 & 2032
- Table 63: Global Ballistic Composites Industry Revenue Million Forecast, by Fiber Type 2019 & 2032
- Table 64: Global Ballistic Composites Industry Volume K Tons Forecast, by Fiber Type 2019 & 2032
- Table 65: Global Ballistic Composites Industry Revenue Million Forecast, by Matrix Type 2019 & 2032
- Table 66: Global Ballistic Composites Industry Volume K Tons Forecast, by Matrix Type 2019 & 2032
- Table 67: Global Ballistic Composites Industry Revenue Million Forecast, by Application 2019 & 2032
- Table 68: Global Ballistic Composites Industry Volume K Tons Forecast, by Application 2019 & 2032
- Table 69: Global Ballistic Composites Industry Revenue Million Forecast, by Country 2019 & 2032
- Table 70: Global Ballistic Composites Industry Volume K Tons Forecast, by Country 2019 & 2032
- Table 71: China Ballistic Composites Industry Revenue (Million) Forecast, by Application 2019 & 2032
- Table 72: China Ballistic Composites Industry Volume (K Tons) Forecast, by Application 2019 & 2032
- Table 73: India Ballistic Composites Industry Revenue (Million) Forecast, by Application 2019 & 2032
- Table 74: India Ballistic Composites Industry Volume (K Tons) Forecast, by Application 2019 & 2032
- Table 75: Japan Ballistic Composites Industry Revenue (Million) Forecast, by Application 2019 & 2032
- Table 76: Japan Ballistic Composites Industry Volume (K Tons) Forecast, by Application 2019 & 2032
- Table 77: South Korea Ballistic Composites Industry Revenue (Million) Forecast, by Application 2019 & 2032
- Table 78: South Korea Ballistic Composites Industry Volume (K Tons) Forecast, by Application 2019 & 2032
- Table 79: Rest of Asia Pacific Ballistic Composites Industry Revenue (Million) Forecast, by Application 2019 & 2032
- Table 80: Rest of Asia Pacific Ballistic Composites Industry Volume (K Tons) Forecast, by Application 2019 & 2032
- Table 81: Global Ballistic Composites Industry Revenue Million Forecast, by Fiber Type 2019 & 2032
- Table 82: Global Ballistic Composites Industry Volume K Tons Forecast, by Fiber Type 2019 & 2032
- Table 83: Global Ballistic Composites Industry Revenue Million Forecast, by Matrix Type 2019 & 2032
- Table 84: Global Ballistic Composites Industry Volume K Tons Forecast, by Matrix Type 2019 & 2032
- Table 85: Global Ballistic Composites Industry Revenue Million Forecast, by Application 2019 & 2032
- Table 86: Global Ballistic Composites Industry Volume K Tons Forecast, by Application 2019 & 2032
- Table 87: Global Ballistic Composites Industry Revenue Million Forecast, by Country 2019 & 2032
- Table 88: Global Ballistic Composites Industry Volume K Tons Forecast, by Country 2019 & 2032
- Table 89: United States Ballistic Composites Industry Revenue (Million) Forecast, by Application 2019 & 2032
- Table 90: United States Ballistic Composites Industry Volume (K Tons) Forecast, by Application 2019 & 2032
- Table 91: Canada Ballistic Composites Industry Revenue (Million) Forecast, by Application 2019 & 2032
- Table 92: Canada Ballistic Composites Industry Volume (K Tons) Forecast, by Application 2019 & 2032
- Table 93: Mexico Ballistic Composites Industry Revenue (Million) Forecast, by Application 2019 & 2032
- Table 94: Mexico Ballistic Composites Industry Volume (K Tons) Forecast, by Application 2019 & 2032
- Table 95: Global Ballistic Composites Industry Revenue Million Forecast, by Fiber Type 2019 & 2032
- Table 96: Global Ballistic Composites Industry Volume K Tons Forecast, by Fiber Type 2019 & 2032
- Table 97: Global Ballistic Composites Industry Revenue Million Forecast, by Matrix Type 2019 & 2032
- Table 98: Global Ballistic Composites Industry Volume K Tons Forecast, by Matrix Type 2019 & 2032
- Table 99: Global Ballistic Composites Industry Revenue Million Forecast, by Application 2019 & 2032
- Table 100: Global Ballistic Composites Industry Volume K Tons Forecast, by Application 2019 & 2032
- Table 101: Global Ballistic Composites Industry Revenue Million Forecast, by Country 2019 & 2032
- Table 102: Global Ballistic Composites Industry Volume K Tons Forecast, by Country 2019 & 2032
- Table 103: Germany Ballistic Composites Industry Revenue (Million) Forecast, by Application 2019 & 2032
- Table 104: Germany Ballistic Composites Industry Volume (K Tons) Forecast, by Application 2019 & 2032
- Table 105: United Kingdom Ballistic Composites Industry Revenue (Million) Forecast, by Application 2019 & 2032
- Table 106: United Kingdom Ballistic Composites Industry Volume (K Tons) Forecast, by Application 2019 & 2032
- Table 107: Italy Ballistic Composites Industry Revenue (Million) Forecast, by Application 2019 & 2032
- Table 108: Italy Ballistic Composites Industry Volume (K Tons) Forecast, by Application 2019 & 2032
- Table 109: France Ballistic Composites Industry Revenue (Million) Forecast, by Application 2019 & 2032
- Table 110: France Ballistic Composites Industry Volume (K Tons) Forecast, by Application 2019 & 2032
- Table 111: Spain Ballistic Composites Industry Revenue (Million) Forecast, by Application 2019 & 2032
- Table 112: Spain Ballistic Composites Industry Volume (K Tons) Forecast, by Application 2019 & 2032
- Table 113: Rest of Europe Ballistic Composites Industry Revenue (Million) Forecast, by Application 2019 & 2032
- Table 114: Rest of Europe Ballistic Composites Industry Volume (K Tons) Forecast, by Application 2019 & 2032
- Table 115: Global Ballistic Composites Industry Revenue Million Forecast, by Fiber Type 2019 & 2032
- Table 116: Global Ballistic Composites Industry Volume K Tons Forecast, by Fiber Type 2019 & 2032
- Table 117: Global Ballistic Composites Industry Revenue Million Forecast, by Matrix Type 2019 & 2032
- Table 118: Global Ballistic Composites Industry Volume K Tons Forecast, by Matrix Type 2019 & 2032
- Table 119: Global Ballistic Composites Industry Revenue Million Forecast, by Application 2019 & 2032
- Table 120: Global Ballistic Composites Industry Volume K Tons Forecast, by Application 2019 & 2032
- Table 121: Global Ballistic Composites Industry Revenue Million Forecast, by Country 2019 & 2032
- Table 122: Global Ballistic Composites Industry Volume K Tons Forecast, by Country 2019 & 2032
- Table 123: Brazil Ballistic Composites Industry Revenue (Million) Forecast, by Application 2019 & 2032
- Table 124: Brazil Ballistic Composites Industry Volume (K Tons) Forecast, by Application 2019 & 2032
- Table 125: Argentina Ballistic Composites Industry Revenue (Million) Forecast, by Application 2019 & 2032
- Table 126: Argentina Ballistic Composites Industry Volume (K Tons) Forecast, by Application 2019 & 2032
- Table 127: Rest of South America Ballistic Composites Industry Revenue (Million) Forecast, by Application 2019 & 2032
- Table 128: Rest of South America Ballistic Composites Industry Volume (K Tons) Forecast, by Application 2019 & 2032
- Table 129: Global Ballistic Composites Industry Revenue Million Forecast, by Fiber Type 2019 & 2032
- Table 130: Global Ballistic Composites Industry Volume K Tons Forecast, by Fiber Type 2019 & 2032
- Table 131: Global Ballistic Composites Industry Revenue Million Forecast, by Matrix Type 2019 & 2032
- Table 132: Global Ballistic Composites Industry Volume K Tons Forecast, by Matrix Type 2019 & 2032
- Table 133: Global Ballistic Composites Industry Revenue Million Forecast, by Application 2019 & 2032
- Table 134: Global Ballistic Composites Industry Volume K Tons Forecast, by Application 2019 & 2032
- Table 135: Global Ballistic Composites Industry Revenue Million Forecast, by Country 2019 & 2032
- Table 136: Global Ballistic Composites Industry Volume K Tons Forecast, by Country 2019 & 2032
- Table 137: Saudi Arabia Ballistic Composites Industry Revenue (Million) Forecast, by Application 2019 & 2032
- Table 138: Saudi Arabia Ballistic Composites Industry Volume (K Tons) Forecast, by Application 2019 & 2032
- Table 139: South Africa Ballistic Composites Industry Revenue (Million) Forecast, by Application 2019 & 2032
- Table 140: South Africa Ballistic Composites Industry Volume (K Tons) Forecast, by Application 2019 & 2032
- Table 141: Rest of Middle East and Africa Ballistic Composites Industry Revenue (Million) Forecast, by Application 2019 & 2032
- Table 142: Rest of Middle East and Africa Ballistic Composites Industry Volume (K Tons) Forecast, by Application 2019 & 2032
Frequently Asked Questions
1. What is the projected Compound Annual Growth Rate (CAGR) of the Ballistic Composites Industry?
The projected CAGR is approximately > 4.00%.
2. Which companies are prominent players in the Ballistic Composites Industry?
Key companies in the market include Honeywell International Inc, Teijin Limited, Plastic Reinforcement Fabrics Ltd, BAE Systems, Southern States llc, Roihu Inc, Barrday Inc, TenCate Protective Fabrics, MKU LIMITED, Coherent Corp, Integris, Morgan Advanced Materials, DSM, DuPont, Gaffco Ballistics, Gurit Holding AG, ArmorCore.
3. What are the main segments of the Ballistic Composites Industry?
The market segments include Fiber Type, Matrix Type, Application.
4. Can you provide details about the market size?
The market size is estimated to be USD 1.91 Million as of 2022.
5. What are some drivers contributing to market growth?
Rise in Defense Expenditure; Increasing Demand for Lightweight Materials in the Aerospace and Defense Industry; Other Drivers.
6. What are the notable trends driving market growth?
Increasing Demand for Vehicle Armors.
7. Are there any restraints impacting market growth?
High Processing and Manufacturing Costs; Volatile Raw Material Supply.
8. Can you provide examples of recent developments in the market?
November 2023: Integris Composites developed a new system of ballistic vest gear for law enforcement and military units and launched the company’s new Rapid Don/Doff body armor vests. It is an equipment that dramatically reduces the time for donning and doffing one’s body armor rig—by 50% or more.
9. What pricing options are available for accessing the report?
Pricing options include single-user, multi-user, and enterprise licenses priced at USD 4750, USD 5250, and USD 8750 respectively.
10. Is the market size provided in terms of value or volume?
The market size is provided in terms of value, measured in Million and volume, measured in K Tons.
11. Are there any specific market keywords associated with the report?
Yes, the market keyword associated with the report is "Ballistic Composites Industry," which aids in identifying and referencing the specific market segment covered.
12. How do I determine which pricing option suits my needs best?
The pricing options vary based on user requirements and access needs. Individual users may opt for single-user licenses, while businesses requiring broader access may choose multi-user or enterprise licenses for cost-effective access to the report.
13. Are there any additional resources or data provided in the Ballistic Composites Industry report?
While the report offers comprehensive insights, it's advisable to review the specific contents or supplementary materials provided to ascertain if additional resources or data are available.
14. How can I stay updated on further developments or reports in the Ballistic Composites Industry?
To stay informed about further developments, trends, and reports in the Ballistic Composites Industry, consider subscribing to industry newsletters, following relevant companies and organizations, or regularly checking reputable industry news sources and publications.
Methodology
Step 1 - Identification of Relevant Samples Size from Population Database


Step 2 - Approaches for Defining Global Market Size (Value, Volume* & Price*)

Note*: In applicable scenarios
Step 3 - Data Sources
Primary Research
- Web Analytics
- Survey Reports
- Research Institute
- Latest Research Reports
- Opinion Leaders
Secondary Research
- Annual Reports
- White Paper
- Latest Press Release
- Industry Association
- Paid Database
- Investor Presentations

Step 4 - Data Triangulation
Involves using different sources of information in order to increase the validity of a study
These sources are likely to be stakeholders in a program - participants, other researchers, program staff, other community members, and so on.
Then we put all data in single framework & apply various statistical tools to find out the dynamic on the market.
During the analysis stage, feedback from the stakeholder groups would be compared to determine areas of agreement as well as areas of divergence
