

Key Insights
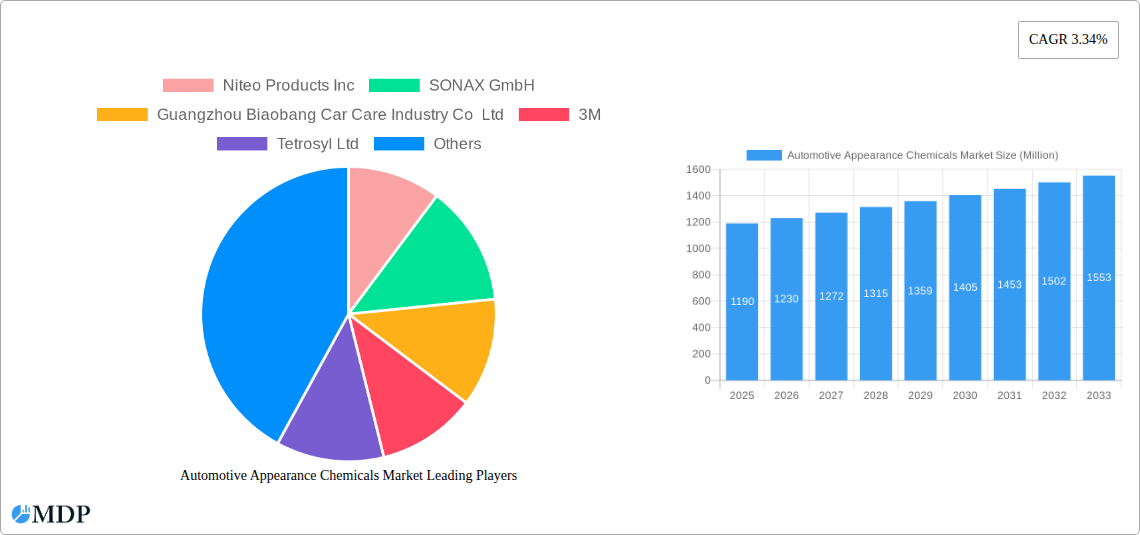
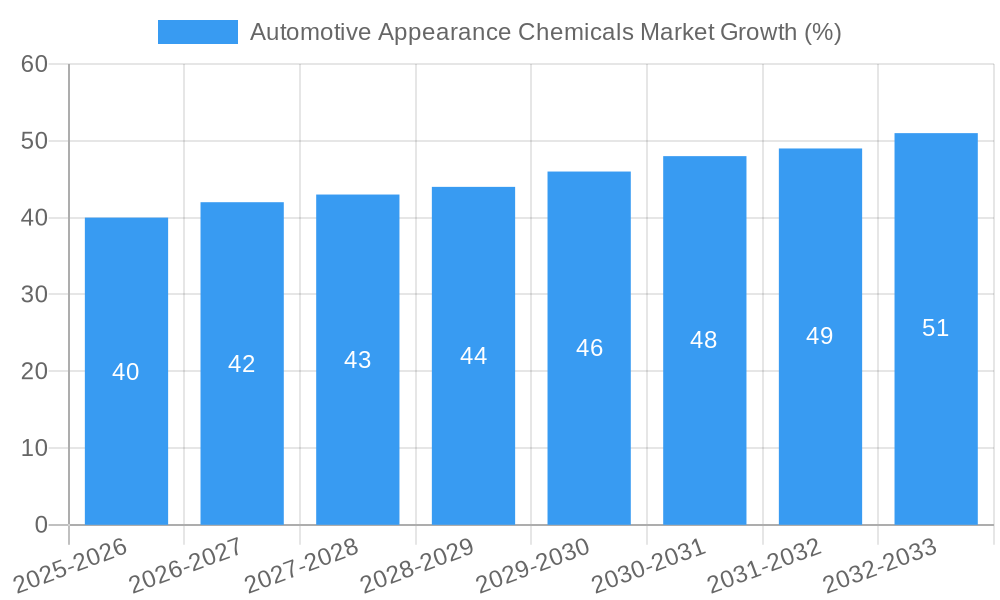
The automotive appearance chemicals market, valued at $1.19 billion in 2025, is projected to experience steady growth, driven by increasing vehicle ownership globally, particularly in developing economies like India and China. The market's Compound Annual Growth Rate (CAGR) of 3.34% from 2019 to 2024 indicates a consistent demand for products enhancing vehicle aesthetics and protection. Key drivers include the rising consumer preference for premium car care products, the growing popularity of detailing services, and the increasing awareness of the importance of vehicle maintenance for preserving its value. Emerging trends such as eco-friendly formulations, technologically advanced products (e.g., self-cleaning coatings), and personalized car care solutions are shaping the market landscape. However, factors like fluctuating raw material prices and the potential impact of stricter environmental regulations could pose challenges to market growth. The market is segmented by product type (waxes, polishes, protectants, cleaners, fluids, leather care, others) and application (passenger cars, light commercial vehicles, heavy commercial vehicles). While passenger cars dominate the application segment, the light and heavy commercial vehicle segments are anticipated to witness significant growth driven by increasing fleet sizes and rising demand for professional cleaning and maintenance services. Leading players like 3M, Turtle Wax, and SONAX are focusing on innovation and expansion strategies to maintain their market share amidst increasing competition from regional players.
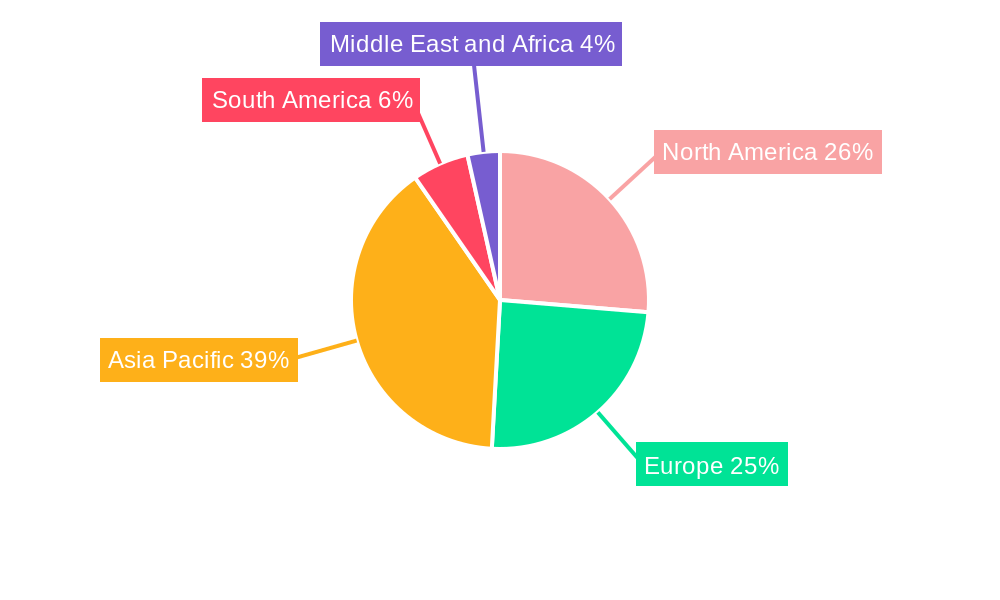
The Asia-Pacific region, especially China and India, is expected to dominate the market due to its large automotive market and rising disposable incomes. North America and Europe will also maintain significant market shares due to established automotive industries and a strong consumer preference for high-quality car care products. However, emerging markets in South America and the Middle East and Africa present substantial growth potential, driven by increasing vehicle ownership and rising consumer spending. Future growth will depend on successful product innovation, strategic partnerships, and adapting to evolving consumer preferences. The market's future trajectory will likely be characterized by a focus on sustainability, technological advancements, and tailored solutions catering to specific vehicle types and consumer needs.
Automotive Appearance Chemicals Market: A Comprehensive Analysis (2019-2033)
This in-depth report provides a comprehensive analysis of the global Automotive Appearance Chemicals Market, offering invaluable insights for stakeholders across the automotive care industry. Spanning the period from 2019 to 2033 (Study Period), with a focus on 2025 (Base Year and Estimated Year), and forecasting to 2033 (Forecast Period), this report meticulously examines market dynamics, trends, leading players, and future opportunities. The historical period covered is 2019-2024. The market size is projected to reach xx Million by 2033.
Automotive Appearance Chemicals Market Market Dynamics & Concentration
This section delves into the intricate dynamics shaping the Automotive Appearance Chemicals Market. We analyze market concentration, revealing the market share held by key players like 3M, Turtle Wax Inc, and SONAX GmbH, among others. The report further explores innovation drivers, such as the rising demand for eco-friendly products and advanced formulations, and assesses the impact of regulatory frameworks on market growth. The influence of product substitutes, like ceramic coatings, and evolving end-user trends, including a growing preference for DIY detailing, are also meticulously examined. Finally, the report analyzes M&A activities within the sector, including the number of deals and their impact on market consolidation. Market concentration is expected to remain relatively high in the forecast period, with the top 10 players accounting for approximately xx% of the global market share. Several factors contribute to this, including significant investments in R&D, strong brand recognition, and established distribution networks. The average M&A deal count between 2019 and 2024 was approximately xx deals per year.
- Market Concentration: High, with top players holding significant shares.
- Innovation Drivers: Eco-friendly formulations, advanced technologies (e.g., nano-coatings).
- Regulatory Frameworks: Impact on product composition and labeling.
- Product Substitutes: Growing competition from ceramic coatings and other alternatives.
- End-User Trends: Rise of DIY detailing and professional detailing services.
- M&A Activities: Consolidation through mergers and acquisitions, increasing market concentration.
Automotive Appearance Chemicals Market Industry Trends & Analysis
This section offers a detailed examination of the key trends influencing the Automotive Appearance Chemicals Market. We analyze market growth drivers, including the increasing number of vehicles globally and rising consumer disposable incomes. Technological disruptions, such as the introduction of innovative cleaning agents and protective coatings, are thoroughly explored. The report also investigates evolving consumer preferences, with a focus on the demand for high-performance, eco-friendly, and user-friendly products. Competitive dynamics are analyzed, focusing on pricing strategies, product differentiation, and brand loyalty. The market is projected to experience a CAGR of xx% during the forecast period (2025-2033). Market penetration of specific product types, like nano-coatings, is also assessed, showing significant growth potential. Detailed analysis of consumer behavior and purchasing patterns provides crucial insights into market segmentation and target audiences.
Leading Markets & Segments in Automotive Appearance Chemicals Market
This section identifies the dominant regions, countries, and segments within the Automotive Appearance Chemicals Market. Through detailed analysis, we pinpoint the leading regions driving market growth, highlighting factors like robust automotive sales, favorable economic conditions, and well-developed distribution networks. The report also analyzes market segmentation by product type (Waxes, Polishes, Protectants, Wheel and Tire Cleaners, Windshield Washer Fluids, Leather Care Products, Others) and application (Passenger Cars, Light Commercial Vehicles, Heavy Commercial Vehicles, Others). We further dissect the key drivers for each segment’s dominance:
- Leading Region: North America (due to high vehicle ownership and established aftermarket).
- Leading Product Type: Polishes (high demand due to ease of use and aesthetic appeal).
- Leading Application: Passenger Cars (largest vehicle segment globally).
Key Drivers for Dominant Segments:
- North America: Strong automotive sales, developed aftermarket, high consumer spending.
- Polishes: Ease of application, effective cleaning & shine, wide availability.
- Passenger Cars: Largest vehicle segment, high demand for appearance enhancement.
Automotive Appearance Chemicals Market Product Developments
Recent years have witnessed significant innovations in automotive appearance chemicals. Manufacturers are focusing on developing eco-friendly, high-performance products with enhanced durability and ease of use. This includes the introduction of nano-coatings, advanced polymers, and biodegradable cleaning agents. These innovations cater to the growing consumer demand for sustainable and effective solutions, leading to improved market penetration and competitive advantages for companies that embrace these advancements. The integration of smart technologies, such as sensors for optimized cleaning, is also emerging as a key area of focus.
Key Drivers of Automotive Appearance Chemicals Market Growth
The Automotive Appearance Chemicals Market's growth is propelled by several key factors. Firstly, the global increase in vehicle ownership fuels demand for appearance enhancement products. Secondly, rising disposable incomes, particularly in developing economies, enable consumers to invest more in vehicle maintenance and detailing. Finally, stricter environmental regulations are driving the development and adoption of eco-friendly formulations, opening new market segments. The increasing popularity of car detailing as a hobby also contributes significantly to market growth.
Challenges in the Automotive Appearance Chemicals Market Market
Several challenges hinder the Automotive Appearance Chemicals Market's growth. Stringent environmental regulations, impacting product composition and disposal, pose significant hurdles. Supply chain disruptions and volatility in raw material prices can affect profitability and product availability. Intense competition among established players and emerging brands puts pressure on pricing and innovation. The fluctuating economic landscape also presents challenges to consumer spending patterns, impacting demand. For example, a recent xx% increase in raw material costs resulted in a xx% price increase for several leading products.
Emerging Opportunities in Automotive Appearance Chemicals Market
Significant opportunities exist for long-term growth in the Automotive Appearance Chemicals Market. Technological breakthroughs, like the development of self-cleaning coatings, present exciting possibilities. Strategic partnerships between chemical manufacturers and automotive companies can lead to innovative product integration and wider market penetration. Expansion into new markets, particularly in developing economies with growing vehicle ownership, holds immense potential. Further advancements in sustainable and biodegradable formulations will also drive considerable growth in the coming years.
Leading Players in the Automotive Appearance Chemicals Market Sector
- Niteo Products Inc
- SONAX GmbH
- Guangzhou Biaobang Car Care Industry Co Ltd
- 3M
- Tetrosyl Ltd
- Nuvite Chemical Compounds
- Dow
- ITW Global Brands
- Turtle Wax Inc
- LIQUI MOLY GmbH
- Valvoline Chemicals
- General Chemical Corp
Key Milestones in Automotive Appearance Chemicals Market Industry
- 2021: Launch of a new biodegradable car wash product by 3M.
- 2022: Acquisition of a smaller competitor by Turtle Wax Inc, expanding its market share.
- 2023: Introduction of a revolutionary nano-coating technology by SONAX GmbH.
- (Further milestones will be detailed in the complete report.)
Strategic Outlook for Automotive Appearance Chemicals Market Market
The Automotive Appearance Chemicals Market presents substantial growth potential. Focusing on sustainable and innovative products, strategic partnerships, and expanding into emerging markets are vital for success. Developing advanced formulations that combine performance, ease of use, and environmental friendliness is crucial for attracting environmentally conscious consumers. Continuous innovation, coupled with effective marketing strategies, will be key to capitalizing on the significant opportunities within this dynamic market.
Automotive Appearance Chemicals Market Segmentation
-
1. Product Type
- 1.1. Waxes
- 1.2. Polishes
- 1.3. Protectants
- 1.4. Wheel and Tire Cleaners
- 1.5. Windshield Washer Fluids
- 1.6. Leather Care Products
- 1.7. Others
-
2. Application
- 2.1. Passenger Cars
- 2.2. Light Commercial Vehicles
- 2.3. Heavy Commercial Vehicles
- 2.4. Others
Automotive Appearance Chemicals Market Segmentation By Geography
-
1. Asia Pacific
- 1.1. China
- 1.2. India
- 1.3. Japan
- 1.4. South Korea
- 1.5. Rest of Asia Pacific
-
2. North America
- 2.1. United States
- 2.2. Canada
- 2.3. Mexico
-
3. Europe
- 3.1. Germany
- 3.2. United Kingdom
- 3.3. France
- 3.4. Italy
- 3.5. Rest of Europe
-
4. South America
- 4.1. Brazil
- 4.2. Argentina
- 4.3. Rest of South America
-
5. Middle East and Africa
- 5.1. Saudi Arabia
- 5.2. South Africa
- 5.3. Rest of Middle East and Africa
Automotive Appearance Chemicals Market REPORT HIGHLIGHTS
| Aspects | Details |
|---|---|
| Study Period | 2019-2033 |
| Base Year | 2024 |
| Estimated Year | 2025 |
| Forecast Period | 2025-2033 |
| Historical Period | 2019-2024 |
| Growth Rate | CAGR of 3.34% from 2019-2033 |
| Segmentation |
|
Table of Contents
- 1. Introduction
- 1.1. Research Scope
- 1.2. Market Segmentation
- 1.3. Research Methodology
- 1.4. Definitions and Assumptions
- 2. Executive Summary
- 2.1. Introduction
- 3. Market Dynamics
- 3.1. Introduction
- 3.2. Market Drivers
- 3.2.1. Increase in the Production of Electric Vehicles (EV); Increase in Consumer Awareness Toward Vehicle Maintenance; Other Drivers
- 3.3. Market Restrains
- 3.3.1. Stringent Government Regulations on Petroleum Products like Waxes and Coatings; Other Restraints
- 3.4. Market Trends
- 3.4.1. Increase in the Production of Electric Vehicles
- 4. Market Factor Analysis
- 4.1. Porters Five Forces
- 4.2. Supply/Value Chain
- 4.3. PESTEL analysis
- 4.4. Market Entropy
- 4.5. Patent/Trademark Analysis
- 5. Global Automotive Appearance Chemicals Market Analysis, Insights and Forecast, 2019-2031
- 5.1. Market Analysis, Insights and Forecast - by Product Type
- 5.1.1. Waxes
- 5.1.2. Polishes
- 5.1.3. Protectants
- 5.1.4. Wheel and Tire Cleaners
- 5.1.5. Windshield Washer Fluids
- 5.1.6. Leather Care Products
- 5.1.7. Others
- 5.2. Market Analysis, Insights and Forecast - by Application
- 5.2.1. Passenger Cars
- 5.2.2. Light Commercial Vehicles
- 5.2.3. Heavy Commercial Vehicles
- 5.2.4. Others
- 5.3. Market Analysis, Insights and Forecast - by Region
- 5.3.1. Asia Pacific
- 5.3.2. North America
- 5.3.3. Europe
- 5.3.4. South America
- 5.3.5. Middle East and Africa
- 5.1. Market Analysis, Insights and Forecast - by Product Type
- 6. Asia Pacific Automotive Appearance Chemicals Market Analysis, Insights and Forecast, 2019-2031
- 6.1. Market Analysis, Insights and Forecast - by Product Type
- 6.1.1. Waxes
- 6.1.2. Polishes
- 6.1.3. Protectants
- 6.1.4. Wheel and Tire Cleaners
- 6.1.5. Windshield Washer Fluids
- 6.1.6. Leather Care Products
- 6.1.7. Others
- 6.2. Market Analysis, Insights and Forecast - by Application
- 6.2.1. Passenger Cars
- 6.2.2. Light Commercial Vehicles
- 6.2.3. Heavy Commercial Vehicles
- 6.2.4. Others
- 6.1. Market Analysis, Insights and Forecast - by Product Type
- 7. North America Automotive Appearance Chemicals Market Analysis, Insights and Forecast, 2019-2031
- 7.1. Market Analysis, Insights and Forecast - by Product Type
- 7.1.1. Waxes
- 7.1.2. Polishes
- 7.1.3. Protectants
- 7.1.4. Wheel and Tire Cleaners
- 7.1.5. Windshield Washer Fluids
- 7.1.6. Leather Care Products
- 7.1.7. Others
- 7.2. Market Analysis, Insights and Forecast - by Application
- 7.2.1. Passenger Cars
- 7.2.2. Light Commercial Vehicles
- 7.2.3. Heavy Commercial Vehicles
- 7.2.4. Others
- 7.1. Market Analysis, Insights and Forecast - by Product Type
- 8. Europe Automotive Appearance Chemicals Market Analysis, Insights and Forecast, 2019-2031
- 8.1. Market Analysis, Insights and Forecast - by Product Type
- 8.1.1. Waxes
- 8.1.2. Polishes
- 8.1.3. Protectants
- 8.1.4. Wheel and Tire Cleaners
- 8.1.5. Windshield Washer Fluids
- 8.1.6. Leather Care Products
- 8.1.7. Others
- 8.2. Market Analysis, Insights and Forecast - by Application
- 8.2.1. Passenger Cars
- 8.2.2. Light Commercial Vehicles
- 8.2.3. Heavy Commercial Vehicles
- 8.2.4. Others
- 8.1. Market Analysis, Insights and Forecast - by Product Type
- 9. South America Automotive Appearance Chemicals Market Analysis, Insights and Forecast, 2019-2031
- 9.1. Market Analysis, Insights and Forecast - by Product Type
- 9.1.1. Waxes
- 9.1.2. Polishes
- 9.1.3. Protectants
- 9.1.4. Wheel and Tire Cleaners
- 9.1.5. Windshield Washer Fluids
- 9.1.6. Leather Care Products
- 9.1.7. Others
- 9.2. Market Analysis, Insights and Forecast - by Application
- 9.2.1. Passenger Cars
- 9.2.2. Light Commercial Vehicles
- 9.2.3. Heavy Commercial Vehicles
- 9.2.4. Others
- 9.1. Market Analysis, Insights and Forecast - by Product Type
- 10. Middle East and Africa Automotive Appearance Chemicals Market Analysis, Insights and Forecast, 2019-2031
- 10.1. Market Analysis, Insights and Forecast - by Product Type
- 10.1.1. Waxes
- 10.1.2. Polishes
- 10.1.3. Protectants
- 10.1.4. Wheel and Tire Cleaners
- 10.1.5. Windshield Washer Fluids
- 10.1.6. Leather Care Products
- 10.1.7. Others
- 10.2. Market Analysis, Insights and Forecast - by Application
- 10.2.1. Passenger Cars
- 10.2.2. Light Commercial Vehicles
- 10.2.3. Heavy Commercial Vehicles
- 10.2.4. Others
- 10.1. Market Analysis, Insights and Forecast - by Product Type
- 11. Asia Pacific Automotive Appearance Chemicals Market Analysis, Insights and Forecast, 2019-2031
- 11.1. Market Analysis, Insights and Forecast - By Country/Sub-region
- 11.1.1 China
- 11.1.2 India
- 11.1.3 Japan
- 11.1.4 South Korea
- 11.1.5 Rest of Asia Pacific
- 12. North America Automotive Appearance Chemicals Market Analysis, Insights and Forecast, 2019-2031
- 12.1. Market Analysis, Insights and Forecast - By Country/Sub-region
- 12.1.1 United States
- 12.1.2 Canada
- 12.1.3 Mexico
- 13. Europe Automotive Appearance Chemicals Market Analysis, Insights and Forecast, 2019-2031
- 13.1. Market Analysis, Insights and Forecast - By Country/Sub-region
- 13.1.1 Germany
- 13.1.2 United Kingdom
- 13.1.3 France
- 13.1.4 Italy
- 13.1.5 Rest of Europe
- 14. South America Automotive Appearance Chemicals Market Analysis, Insights and Forecast, 2019-2031
- 14.1. Market Analysis, Insights and Forecast - By Country/Sub-region
- 14.1.1 Brazil
- 14.1.2 Argentina
- 14.1.3 Rest of South America
- 15. Middle East and Africa Automotive Appearance Chemicals Market Analysis, Insights and Forecast, 2019-2031
- 15.1. Market Analysis, Insights and Forecast - By Country/Sub-region
- 15.1.1 Saudi Arabia
- 15.1.2 South Africa
- 15.1.3 Rest of Middle East and Africa
- 16. Competitive Analysis
- 16.1. Global Market Share Analysis 2024
- 16.2. Company Profiles
- 16.2.1 Niteo Products Inc
- 16.2.1.1. Overview
- 16.2.1.2. Products
- 16.2.1.3. SWOT Analysis
- 16.2.1.4. Recent Developments
- 16.2.1.5. Financials (Based on Availability)
- 16.2.2 SONAX GmbH
- 16.2.2.1. Overview
- 16.2.2.2. Products
- 16.2.2.3. SWOT Analysis
- 16.2.2.4. Recent Developments
- 16.2.2.5. Financials (Based on Availability)
- 16.2.3 Guangzhou Biaobang Car Care Industry Co Ltd
- 16.2.3.1. Overview
- 16.2.3.2. Products
- 16.2.3.3. SWOT Analysis
- 16.2.3.4. Recent Developments
- 16.2.3.5. Financials (Based on Availability)
- 16.2.4 3M
- 16.2.4.1. Overview
- 16.2.4.2. Products
- 16.2.4.3. SWOT Analysis
- 16.2.4.4. Recent Developments
- 16.2.4.5. Financials (Based on Availability)
- 16.2.5 Tetrosyl Ltd
- 16.2.5.1. Overview
- 16.2.5.2. Products
- 16.2.5.3. SWOT Analysis
- 16.2.5.4. Recent Developments
- 16.2.5.5. Financials (Based on Availability)
- 16.2.6 Nuvite Chemical Compounds
- 16.2.6.1. Overview
- 16.2.6.2. Products
- 16.2.6.3. SWOT Analysis
- 16.2.6.4. Recent Developments
- 16.2.6.5. Financials (Based on Availability)
- 16.2.7 Dow
- 16.2.7.1. Overview
- 16.2.7.2. Products
- 16.2.7.3. SWOT Analysis
- 16.2.7.4. Recent Developments
- 16.2.7.5. Financials (Based on Availability)
- 16.2.8 ITW Global Brands
- 16.2.8.1. Overview
- 16.2.8.2. Products
- 16.2.8.3. SWOT Analysis
- 16.2.8.4. Recent Developments
- 16.2.8.5. Financials (Based on Availability)
- 16.2.9 Turtle Wax Inc
- 16.2.9.1. Overview
- 16.2.9.2. Products
- 16.2.9.3. SWOT Analysis
- 16.2.9.4. Recent Developments
- 16.2.9.5. Financials (Based on Availability)
- 16.2.10 LIQUI MOLY GmbH
- 16.2.10.1. Overview
- 16.2.10.2. Products
- 16.2.10.3. SWOT Analysis
- 16.2.10.4. Recent Developments
- 16.2.10.5. Financials (Based on Availability)
- 16.2.11 Valvoline Chemicals*List Not Exhaustive
- 16.2.11.1. Overview
- 16.2.11.2. Products
- 16.2.11.3. SWOT Analysis
- 16.2.11.4. Recent Developments
- 16.2.11.5. Financials (Based on Availability)
- 16.2.12 General Chemical Corp
- 16.2.12.1. Overview
- 16.2.12.2. Products
- 16.2.12.3. SWOT Analysis
- 16.2.12.4. Recent Developments
- 16.2.12.5. Financials (Based on Availability)
- 16.2.1 Niteo Products Inc
List of Figures
- Figure 1: Global Automotive Appearance Chemicals Market Revenue Breakdown (Million, %) by Region 2024 & 2032
- Figure 2: Asia Pacific Automotive Appearance Chemicals Market Revenue (Million), by Country 2024 & 2032
- Figure 3: Asia Pacific Automotive Appearance Chemicals Market Revenue Share (%), by Country 2024 & 2032
- Figure 4: North America Automotive Appearance Chemicals Market Revenue (Million), by Country 2024 & 2032
- Figure 5: North America Automotive Appearance Chemicals Market Revenue Share (%), by Country 2024 & 2032
- Figure 6: Europe Automotive Appearance Chemicals Market Revenue (Million), by Country 2024 & 2032
- Figure 7: Europe Automotive Appearance Chemicals Market Revenue Share (%), by Country 2024 & 2032
- Figure 8: South America Automotive Appearance Chemicals Market Revenue (Million), by Country 2024 & 2032
- Figure 9: South America Automotive Appearance Chemicals Market Revenue Share (%), by Country 2024 & 2032
- Figure 10: Middle East and Africa Automotive Appearance Chemicals Market Revenue (Million), by Country 2024 & 2032
- Figure 11: Middle East and Africa Automotive Appearance Chemicals Market Revenue Share (%), by Country 2024 & 2032
- Figure 12: Asia Pacific Automotive Appearance Chemicals Market Revenue (Million), by Product Type 2024 & 2032
- Figure 13: Asia Pacific Automotive Appearance Chemicals Market Revenue Share (%), by Product Type 2024 & 2032
- Figure 14: Asia Pacific Automotive Appearance Chemicals Market Revenue (Million), by Application 2024 & 2032
- Figure 15: Asia Pacific Automotive Appearance Chemicals Market Revenue Share (%), by Application 2024 & 2032
- Figure 16: Asia Pacific Automotive Appearance Chemicals Market Revenue (Million), by Country 2024 & 2032
- Figure 17: Asia Pacific Automotive Appearance Chemicals Market Revenue Share (%), by Country 2024 & 2032
- Figure 18: North America Automotive Appearance Chemicals Market Revenue (Million), by Product Type 2024 & 2032
- Figure 19: North America Automotive Appearance Chemicals Market Revenue Share (%), by Product Type 2024 & 2032
- Figure 20: North America Automotive Appearance Chemicals Market Revenue (Million), by Application 2024 & 2032
- Figure 21: North America Automotive Appearance Chemicals Market Revenue Share (%), by Application 2024 & 2032
- Figure 22: North America Automotive Appearance Chemicals Market Revenue (Million), by Country 2024 & 2032
- Figure 23: North America Automotive Appearance Chemicals Market Revenue Share (%), by Country 2024 & 2032
- Figure 24: Europe Automotive Appearance Chemicals Market Revenue (Million), by Product Type 2024 & 2032
- Figure 25: Europe Automotive Appearance Chemicals Market Revenue Share (%), by Product Type 2024 & 2032
- Figure 26: Europe Automotive Appearance Chemicals Market Revenue (Million), by Application 2024 & 2032
- Figure 27: Europe Automotive Appearance Chemicals Market Revenue Share (%), by Application 2024 & 2032
- Figure 28: Europe Automotive Appearance Chemicals Market Revenue (Million), by Country 2024 & 2032
- Figure 29: Europe Automotive Appearance Chemicals Market Revenue Share (%), by Country 2024 & 2032
- Figure 30: South America Automotive Appearance Chemicals Market Revenue (Million), by Product Type 2024 & 2032
- Figure 31: South America Automotive Appearance Chemicals Market Revenue Share (%), by Product Type 2024 & 2032
- Figure 32: South America Automotive Appearance Chemicals Market Revenue (Million), by Application 2024 & 2032
- Figure 33: South America Automotive Appearance Chemicals Market Revenue Share (%), by Application 2024 & 2032
- Figure 34: South America Automotive Appearance Chemicals Market Revenue (Million), by Country 2024 & 2032
- Figure 35: South America Automotive Appearance Chemicals Market Revenue Share (%), by Country 2024 & 2032
- Figure 36: Middle East and Africa Automotive Appearance Chemicals Market Revenue (Million), by Product Type 2024 & 2032
- Figure 37: Middle East and Africa Automotive Appearance Chemicals Market Revenue Share (%), by Product Type 2024 & 2032
- Figure 38: Middle East and Africa Automotive Appearance Chemicals Market Revenue (Million), by Application 2024 & 2032
- Figure 39: Middle East and Africa Automotive Appearance Chemicals Market Revenue Share (%), by Application 2024 & 2032
- Figure 40: Middle East and Africa Automotive Appearance Chemicals Market Revenue (Million), by Country 2024 & 2032
- Figure 41: Middle East and Africa Automotive Appearance Chemicals Market Revenue Share (%), by Country 2024 & 2032
List of Tables
- Table 1: Global Automotive Appearance Chemicals Market Revenue Million Forecast, by Region 2019 & 2032
- Table 2: Global Automotive Appearance Chemicals Market Revenue Million Forecast, by Product Type 2019 & 2032
- Table 3: Global Automotive Appearance Chemicals Market Revenue Million Forecast, by Application 2019 & 2032
- Table 4: Global Automotive Appearance Chemicals Market Revenue Million Forecast, by Region 2019 & 2032
- Table 5: Global Automotive Appearance Chemicals Market Revenue Million Forecast, by Country 2019 & 2032
- Table 6: China Automotive Appearance Chemicals Market Revenue (Million) Forecast, by Application 2019 & 2032
- Table 7: India Automotive Appearance Chemicals Market Revenue (Million) Forecast, by Application 2019 & 2032
- Table 8: Japan Automotive Appearance Chemicals Market Revenue (Million) Forecast, by Application 2019 & 2032
- Table 9: South Korea Automotive Appearance Chemicals Market Revenue (Million) Forecast, by Application 2019 & 2032
- Table 10: Rest of Asia Pacific Automotive Appearance Chemicals Market Revenue (Million) Forecast, by Application 2019 & 2032
- Table 11: Global Automotive Appearance Chemicals Market Revenue Million Forecast, by Country 2019 & 2032
- Table 12: United States Automotive Appearance Chemicals Market Revenue (Million) Forecast, by Application 2019 & 2032
- Table 13: Canada Automotive Appearance Chemicals Market Revenue (Million) Forecast, by Application 2019 & 2032
- Table 14: Mexico Automotive Appearance Chemicals Market Revenue (Million) Forecast, by Application 2019 & 2032
- Table 15: Global Automotive Appearance Chemicals Market Revenue Million Forecast, by Country 2019 & 2032
- Table 16: Germany Automotive Appearance Chemicals Market Revenue (Million) Forecast, by Application 2019 & 2032
- Table 17: United Kingdom Automotive Appearance Chemicals Market Revenue (Million) Forecast, by Application 2019 & 2032
- Table 18: France Automotive Appearance Chemicals Market Revenue (Million) Forecast, by Application 2019 & 2032
- Table 19: Italy Automotive Appearance Chemicals Market Revenue (Million) Forecast, by Application 2019 & 2032
- Table 20: Rest of Europe Automotive Appearance Chemicals Market Revenue (Million) Forecast, by Application 2019 & 2032
- Table 21: Global Automotive Appearance Chemicals Market Revenue Million Forecast, by Country 2019 & 2032
- Table 22: Brazil Automotive Appearance Chemicals Market Revenue (Million) Forecast, by Application 2019 & 2032
- Table 23: Argentina Automotive Appearance Chemicals Market Revenue (Million) Forecast, by Application 2019 & 2032
- Table 24: Rest of South America Automotive Appearance Chemicals Market Revenue (Million) Forecast, by Application 2019 & 2032
- Table 25: Global Automotive Appearance Chemicals Market Revenue Million Forecast, by Country 2019 & 2032
- Table 26: Saudi Arabia Automotive Appearance Chemicals Market Revenue (Million) Forecast, by Application 2019 & 2032
- Table 27: South Africa Automotive Appearance Chemicals Market Revenue (Million) Forecast, by Application 2019 & 2032
- Table 28: Rest of Middle East and Africa Automotive Appearance Chemicals Market Revenue (Million) Forecast, by Application 2019 & 2032
- Table 29: Global Automotive Appearance Chemicals Market Revenue Million Forecast, by Product Type 2019 & 2032
- Table 30: Global Automotive Appearance Chemicals Market Revenue Million Forecast, by Application 2019 & 2032
- Table 31: Global Automotive Appearance Chemicals Market Revenue Million Forecast, by Country 2019 & 2032
- Table 32: China Automotive Appearance Chemicals Market Revenue (Million) Forecast, by Application 2019 & 2032
- Table 33: India Automotive Appearance Chemicals Market Revenue (Million) Forecast, by Application 2019 & 2032
- Table 34: Japan Automotive Appearance Chemicals Market Revenue (Million) Forecast, by Application 2019 & 2032
- Table 35: South Korea Automotive Appearance Chemicals Market Revenue (Million) Forecast, by Application 2019 & 2032
- Table 36: Rest of Asia Pacific Automotive Appearance Chemicals Market Revenue (Million) Forecast, by Application 2019 & 2032
- Table 37: Global Automotive Appearance Chemicals Market Revenue Million Forecast, by Product Type 2019 & 2032
- Table 38: Global Automotive Appearance Chemicals Market Revenue Million Forecast, by Application 2019 & 2032
- Table 39: Global Automotive Appearance Chemicals Market Revenue Million Forecast, by Country 2019 & 2032
- Table 40: United States Automotive Appearance Chemicals Market Revenue (Million) Forecast, by Application 2019 & 2032
- Table 41: Canada Automotive Appearance Chemicals Market Revenue (Million) Forecast, by Application 2019 & 2032
- Table 42: Mexico Automotive Appearance Chemicals Market Revenue (Million) Forecast, by Application 2019 & 2032
- Table 43: Global Automotive Appearance Chemicals Market Revenue Million Forecast, by Product Type 2019 & 2032
- Table 44: Global Automotive Appearance Chemicals Market Revenue Million Forecast, by Application 2019 & 2032
- Table 45: Global Automotive Appearance Chemicals Market Revenue Million Forecast, by Country 2019 & 2032
- Table 46: Germany Automotive Appearance Chemicals Market Revenue (Million) Forecast, by Application 2019 & 2032
- Table 47: United Kingdom Automotive Appearance Chemicals Market Revenue (Million) Forecast, by Application 2019 & 2032
- Table 48: France Automotive Appearance Chemicals Market Revenue (Million) Forecast, by Application 2019 & 2032
- Table 49: Italy Automotive Appearance Chemicals Market Revenue (Million) Forecast, by Application 2019 & 2032
- Table 50: Rest of Europe Automotive Appearance Chemicals Market Revenue (Million) Forecast, by Application 2019 & 2032
- Table 51: Global Automotive Appearance Chemicals Market Revenue Million Forecast, by Product Type 2019 & 2032
- Table 52: Global Automotive Appearance Chemicals Market Revenue Million Forecast, by Application 2019 & 2032
- Table 53: Global Automotive Appearance Chemicals Market Revenue Million Forecast, by Country 2019 & 2032
- Table 54: Brazil Automotive Appearance Chemicals Market Revenue (Million) Forecast, by Application 2019 & 2032
- Table 55: Argentina Automotive Appearance Chemicals Market Revenue (Million) Forecast, by Application 2019 & 2032
- Table 56: Rest of South America Automotive Appearance Chemicals Market Revenue (Million) Forecast, by Application 2019 & 2032
- Table 57: Global Automotive Appearance Chemicals Market Revenue Million Forecast, by Product Type 2019 & 2032
- Table 58: Global Automotive Appearance Chemicals Market Revenue Million Forecast, by Application 2019 & 2032
- Table 59: Global Automotive Appearance Chemicals Market Revenue Million Forecast, by Country 2019 & 2032
- Table 60: Saudi Arabia Automotive Appearance Chemicals Market Revenue (Million) Forecast, by Application 2019 & 2032
- Table 61: South Africa Automotive Appearance Chemicals Market Revenue (Million) Forecast, by Application 2019 & 2032
- Table 62: Rest of Middle East and Africa Automotive Appearance Chemicals Market Revenue (Million) Forecast, by Application 2019 & 2032
Frequently Asked Questions
1. What is the projected Compound Annual Growth Rate (CAGR) of the Automotive Appearance Chemicals Market?
The projected CAGR is approximately 3.34%.
2. Which companies are prominent players in the Automotive Appearance Chemicals Market?
Key companies in the market include Niteo Products Inc, SONAX GmbH, Guangzhou Biaobang Car Care Industry Co Ltd, 3M, Tetrosyl Ltd, Nuvite Chemical Compounds, Dow, ITW Global Brands, Turtle Wax Inc, LIQUI MOLY GmbH, Valvoline Chemicals*List Not Exhaustive, General Chemical Corp.
3. What are the main segments of the Automotive Appearance Chemicals Market?
The market segments include Product Type, Application.
4. Can you provide details about the market size?
The market size is estimated to be USD 1.19 Million as of 2022.
5. What are some drivers contributing to market growth?
Increase in the Production of Electric Vehicles (EV); Increase in Consumer Awareness Toward Vehicle Maintenance; Other Drivers.
6. What are the notable trends driving market growth?
Increase in the Production of Electric Vehicles.
7. Are there any restraints impacting market growth?
Stringent Government Regulations on Petroleum Products like Waxes and Coatings; Other Restraints.
8. Can you provide examples of recent developments in the market?
Recent developments in the market studied will be covered in the complete report.
9. What pricing options are available for accessing the report?
Pricing options include single-user, multi-user, and enterprise licenses priced at USD 4750, USD 5250, and USD 8750 respectively.
10. Is the market size provided in terms of value or volume?
The market size is provided in terms of value, measured in Million.
11. Are there any specific market keywords associated with the report?
Yes, the market keyword associated with the report is "Automotive Appearance Chemicals Market," which aids in identifying and referencing the specific market segment covered.
12. How do I determine which pricing option suits my needs best?
The pricing options vary based on user requirements and access needs. Individual users may opt for single-user licenses, while businesses requiring broader access may choose multi-user or enterprise licenses for cost-effective access to the report.
13. Are there any additional resources or data provided in the Automotive Appearance Chemicals Market report?
While the report offers comprehensive insights, it's advisable to review the specific contents or supplementary materials provided to ascertain if additional resources or data are available.
14. How can I stay updated on further developments or reports in the Automotive Appearance Chemicals Market?
To stay informed about further developments, trends, and reports in the Automotive Appearance Chemicals Market, consider subscribing to industry newsletters, following relevant companies and organizations, or regularly checking reputable industry news sources and publications.
Methodology
Step 1 - Identification of Relevant Samples Size from Population Database


Step 2 - Approaches for Defining Global Market Size (Value, Volume* & Price*)

Note*: In applicable scenarios
Step 3 - Data Sources
Primary Research
- Web Analytics
- Survey Reports
- Research Institute
- Latest Research Reports
- Opinion Leaders
Secondary Research
- Annual Reports
- White Paper
- Latest Press Release
- Industry Association
- Paid Database
- Investor Presentations

Step 4 - Data Triangulation
Involves using different sources of information in order to increase the validity of a study
These sources are likely to be stakeholders in a program - participants, other researchers, program staff, other community members, and so on.
Then we put all data in single framework & apply various statistical tools to find out the dynamic on the market.
During the analysis stage, feedback from the stakeholder groups would be compared to determine areas of agreement as well as areas of divergence
