

Key Insights
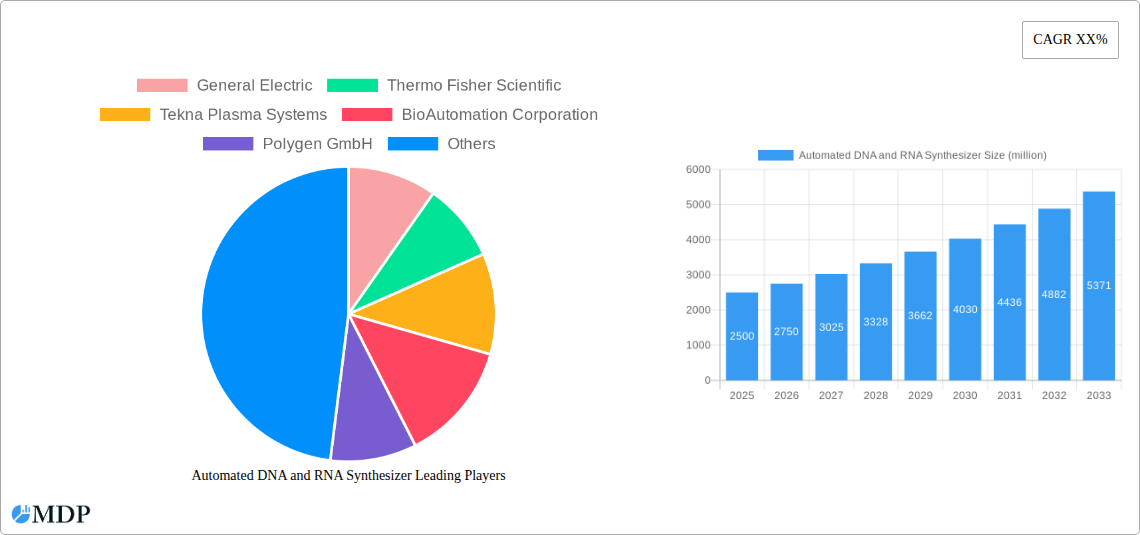
The automated DNA and RNA synthesizer market is experiencing robust growth, driven by the increasing demand for personalized medicine, advancements in genomics research, and the rising adoption of high-throughput screening in pharmaceutical and biotechnology industries. The market's expansion is fueled by the need for efficient and accurate synthesis of DNA and RNA sequences for various applications, including drug discovery, gene therapy, diagnostics, and academic research. Key market drivers include the decreasing cost of synthesis, the development of novel technologies enabling faster and more efficient synthesis, and the growing availability of skilled personnel to operate and maintain these sophisticated instruments. The market is segmented by technology (e.g., solid-phase synthesis, microfluidic-based synthesis), application (e.g., pharmaceutical research, diagnostics, academic research), and end-user (e.g., pharmaceutical companies, biotechnology companies, academic institutions). Companies like General Electric, Thermo Fisher Scientific, and others are actively involved in developing and supplying these advanced systems, contributing to a competitive landscape that fosters innovation. While the market shows strong growth potential, challenges include the high initial investment cost of the equipment and the need for specialized expertise in operation and maintenance.
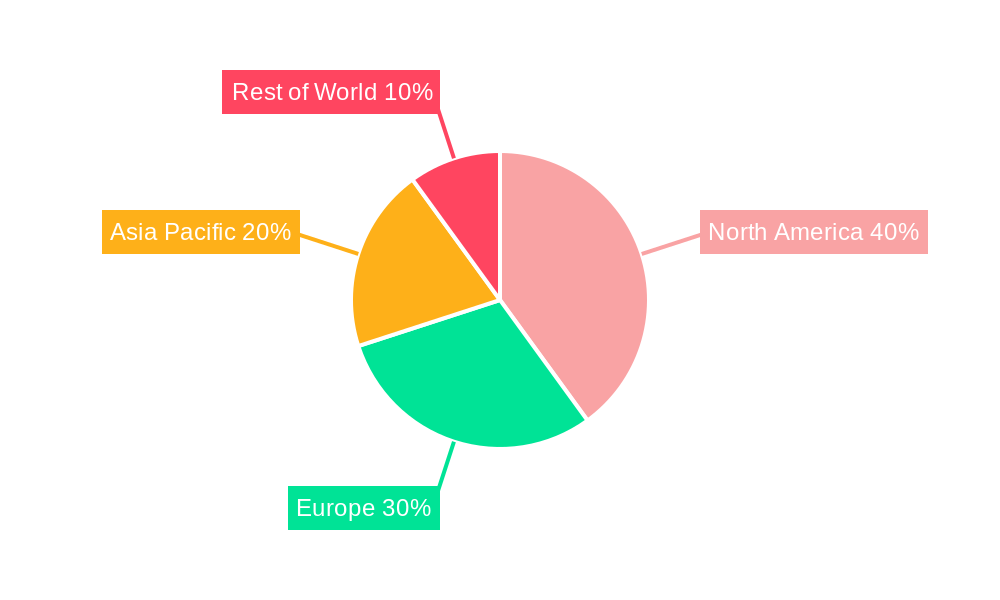
The forecast period (2025-2033) is expected to witness a significant expansion of this market, primarily due to the continuous advancements in synthetic biology and the growing focus on precision medicine. This will lead to increased demand for automated synthesizers capable of handling larger scale projects and complex sequences. Technological innovations are also anticipated to improve the speed, efficiency, and accuracy of DNA and RNA synthesis, further bolstering market growth. While regulatory hurdles and the need for skilled labor could present minor restraints, the overall market trajectory indicates a positive outlook, with significant opportunities for established players and emerging innovators. This growth is likely to be uneven across different regions, with North America and Europe expected to retain a significant share due to their advanced research infrastructure and regulatory frameworks.
Automated DNA and RNA Synthesizer Market Report: 2019-2033
This comprehensive report provides a detailed analysis of the global Automated DNA and RNA Synthesizer market, offering invaluable insights for stakeholders across the life sciences industry. The study covers the period 2019-2033, with a focus on the 2025-2033 forecast period and a base year of 2025. This report projects a market valued at xx million USD in 2025, experiencing significant growth throughout the forecast period. It analyzes market dynamics, key players, technological advancements, and emerging opportunities to provide a holistic understanding of this rapidly evolving sector.
Automated DNA and RNA Synthesizer Market Dynamics & Concentration
The global Automated DNA and RNA Synthesizer market is characterized by a moderately concentrated landscape with several key players vying for market share. In 2025, the top five companies are estimated to hold approximately xx% of the market share. Innovation is a major driver, with continuous advancements in synthesis technologies, such as improved efficiency, higher throughput, and reduced cost per base. Stringent regulatory frameworks, particularly concerning quality control and safety standards, significantly influence market dynamics. Product substitutes, such as traditional manual synthesis methods, pose limited competition due to the superior speed, scalability, and accuracy offered by automated systems. End-user trends show a strong preference for automated systems in research, pharmaceutical, and diagnostic applications. The market has witnessed a moderate level of M&A activity in recent years, with approximately xx deals recorded between 2019 and 2024, primarily focused on expanding product portfolios and geographic reach. This activity is expected to continue, further shaping the market landscape.
- Market Concentration: Top 5 players hold approximately xx% market share (2025).
- Innovation Drivers: Improved synthesis efficiency, higher throughput, reduced cost per base.
- Regulatory Landscape: Stringent quality control and safety standards.
- M&A Activity: Approximately xx deals between 2019-2024.
Automated DNA and RNA Synthesizer Industry Trends & Analysis
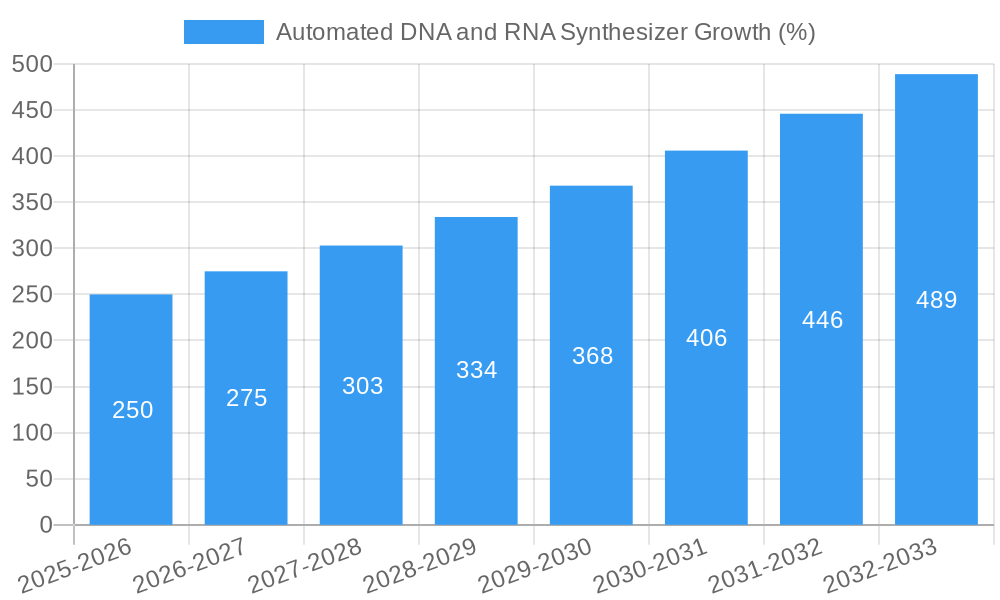
The Automated DNA and RNA Synthesizer market is experiencing robust growth, driven by several key factors. The increasing demand for personalized medicine, advancements in genomics research, and the rising prevalence of infectious diseases are significantly boosting market growth. Technological advancements, such as the development of next-generation sequencing technologies and improved synthesis chemistries, have expanded the applications of synthesized DNA and RNA. Consumer preferences are shifting towards high-throughput, automated systems for improved efficiency and cost-effectiveness. The market is witnessing intense competition, with companies focusing on product differentiation, strategic partnerships, and geographic expansion. The Compound Annual Growth Rate (CAGR) is projected to be xx% during the forecast period (2025-2033), with market penetration steadily increasing across various industry segments.
Leading Markets & Segments in Automated DNA and RNA Synthesizer
North America currently dominates the Automated DNA and RNA Synthesizer market, driven by a strong presence of key players, substantial investments in research and development, and robust healthcare infrastructure. Europe and Asia Pacific are also exhibiting significant growth potential.
- North America Dominance: Driven by strong R&D investment and healthcare infrastructure.
- Europe & Asia Pacific: High growth potential due to increasing adoption in research and diagnostics.
- Key Drivers: Robust funding for research, advancements in healthcare infrastructure, and government support for biotechnology.
The pharmaceutical and biotechnology segments are the major consumers of automated DNA and RNA synthesizers, owing to their large-scale production requirements and stringent quality control needs. The academic and research segment also contributes significantly to market demand.
Automated DNA and RNA Synthesizer Product Developments
Recent product developments focus on improving synthesis speed, accuracy, and scalability. New systems incorporate advanced features such as automated purification, quality control, and data management. These advancements enhance the efficiency and reliability of DNA and RNA synthesis, leading to faster turnaround times and improved data quality. Miniaturized systems are gaining traction due to their cost-effectiveness and suitability for point-of-care applications. The market is witnessing increasing integration of artificial intelligence (AI) and machine learning (ML) algorithms for process optimization and quality control.
Key Drivers of Automated DNA and RNA Synthesizer Growth
The market is driven by technological advancements in synthesis technologies, increasing demand for personalized medicine, growing adoption in genomics research, and rising investments in biotechnology and life sciences research. Favorable regulatory policies and government funding initiatives further stimulate market growth.
Challenges in the Automated DNA and RNA Synthesizer Market
The market faces challenges such as high initial investment costs for advanced systems, potential supply chain disruptions affecting raw material availability, and intense competition among established players and new entrants. Stringent regulatory requirements and the need for highly skilled personnel also pose challenges. These factors can collectively impact the market growth by approximately xx% during the forecast period.
Emerging Opportunities in Automated DNA and RNA Synthesizer
Significant growth opportunities exist in emerging economies with rapidly expanding healthcare sectors. Technological breakthroughs, such as the development of novel synthesis chemistries and the integration of advanced automation, will continue to drive market expansion. Strategic partnerships between instrument manufacturers and reagent suppliers are expected to create synergies and improve the overall value proposition.
Leading Players in the Automated DNA and RNA Synthesizer Sector
- General Electric
- Thermo Fisher Scientific
- Tekna Plasma Systems
- BioAutomation Corporation
- Polygen GmbH
- GlobalSpec
- Biolytic Lab Performance
- Beckman Coulter
- ACTGene
- Precision System Science
- CSBio
- Genscript Biotech
- Protein Technologies
Key Milestones in Automated DNA and RNA Synthesizer Industry
- 2020: Launch of a new high-throughput automated DNA synthesizer by Thermo Fisher Scientific.
- 2021: Acquisition of a smaller synthesizer company by Beckman Coulter.
- 2022: Introduction of AI-powered quality control system by a major player.
- 2023: Development of a new miniaturized synthesizer for point-of-care diagnostics.
- 2024: Regulatory approval for a new DNA synthesis technology.
Strategic Outlook for Automated DNA and RNA Synthesizer Market
The Automated DNA and RNA Synthesizer market is poised for significant growth over the next decade. Continued innovation in synthesis technologies, expansion into new applications, and the increasing adoption of automation across various industry segments will drive market expansion. Companies focused on strategic partnerships, product differentiation, and geographic diversification are expected to gain a competitive edge. The market’s future potential is substantial, with opportunities for both established players and emerging companies.
Automated DNA and RNA Synthesizer Segmentation
-
1. Application
- 1.1. Medical
- 1.2. Laboratory
- 1.3. Biochemistry Research Institution
-
2. Types
- 2.1. 10-Column DNA and RNA Synthesizer
- 2.2. 12-Column DNA and RNA Synthesizer
- 2.3. 96-Column DNA and RNA Synthesizer
Automated DNA and RNA Synthesizer Segmentation By Geography
-
1. North America
- 1.1. United States
- 1.2. Canada
- 1.3. Mexico
-
2. South America
- 2.1. Brazil
- 2.2. Argentina
- 2.3. Rest of South America
-
3. Europe
- 3.1. United Kingdom
- 3.2. Germany
- 3.3. France
- 3.4. Italy
- 3.5. Spain
- 3.6. Russia
- 3.7. Benelux
- 3.8. Nordics
- 3.9. Rest of Europe
-
4. Middle East & Africa
- 4.1. Turkey
- 4.2. Israel
- 4.3. GCC
- 4.4. North Africa
- 4.5. South Africa
- 4.6. Rest of Middle East & Africa
-
5. Asia Pacific
- 5.1. China
- 5.2. India
- 5.3. Japan
- 5.4. South Korea
- 5.5. ASEAN
- 5.6. Oceania
- 5.7. Rest of Asia Pacific
Automated DNA and RNA Synthesizer REPORT HIGHLIGHTS
| Aspects | Details |
|---|---|
| Study Period | 2019-2033 |
| Base Year | 2024 |
| Estimated Year | 2025 |
| Forecast Period | 2025-2033 |
| Historical Period | 2019-2024 |
| Growth Rate | CAGR of XX% from 2019-2033 |
| Segmentation |
|
Table of Contents
- 1. Introduction
- 1.1. Research Scope
- 1.2. Market Segmentation
- 1.3. Research Methodology
- 1.4. Definitions and Assumptions
- 2. Executive Summary
- 2.1. Introduction
- 3. Market Dynamics
- 3.1. Introduction
- 3.2. Market Drivers
- 3.3. Market Restrains
- 3.4. Market Trends
- 4. Market Factor Analysis
- 4.1. Porters Five Forces
- 4.2. Supply/Value Chain
- 4.3. PESTEL analysis
- 4.4. Market Entropy
- 4.5. Patent/Trademark Analysis
- 5. Global Automated DNA and RNA Synthesizer Analysis, Insights and Forecast, 2019-2031
- 5.1. Market Analysis, Insights and Forecast - by Application
- 5.1.1. Medical
- 5.1.2. Laboratory
- 5.1.3. Biochemistry Research Institution
- 5.2. Market Analysis, Insights and Forecast - by Types
- 5.2.1. 10-Column DNA and RNA Synthesizer
- 5.2.2. 12-Column DNA and RNA Synthesizer
- 5.2.3. 96-Column DNA and RNA Synthesizer
- 5.3. Market Analysis, Insights and Forecast - by Region
- 5.3.1. North America
- 5.3.2. South America
- 5.3.3. Europe
- 5.3.4. Middle East & Africa
- 5.3.5. Asia Pacific
- 5.1. Market Analysis, Insights and Forecast - by Application
- 6. North America Automated DNA and RNA Synthesizer Analysis, Insights and Forecast, 2019-2031
- 6.1. Market Analysis, Insights and Forecast - by Application
- 6.1.1. Medical
- 6.1.2. Laboratory
- 6.1.3. Biochemistry Research Institution
- 6.2. Market Analysis, Insights and Forecast - by Types
- 6.2.1. 10-Column DNA and RNA Synthesizer
- 6.2.2. 12-Column DNA and RNA Synthesizer
- 6.2.3. 96-Column DNA and RNA Synthesizer
- 6.1. Market Analysis, Insights and Forecast - by Application
- 7. South America Automated DNA and RNA Synthesizer Analysis, Insights and Forecast, 2019-2031
- 7.1. Market Analysis, Insights and Forecast - by Application
- 7.1.1. Medical
- 7.1.2. Laboratory
- 7.1.3. Biochemistry Research Institution
- 7.2. Market Analysis, Insights and Forecast - by Types
- 7.2.1. 10-Column DNA and RNA Synthesizer
- 7.2.2. 12-Column DNA and RNA Synthesizer
- 7.2.3. 96-Column DNA and RNA Synthesizer
- 7.1. Market Analysis, Insights and Forecast - by Application
- 8. Europe Automated DNA and RNA Synthesizer Analysis, Insights and Forecast, 2019-2031
- 8.1. Market Analysis, Insights and Forecast - by Application
- 8.1.1. Medical
- 8.1.2. Laboratory
- 8.1.3. Biochemistry Research Institution
- 8.2. Market Analysis, Insights and Forecast - by Types
- 8.2.1. 10-Column DNA and RNA Synthesizer
- 8.2.2. 12-Column DNA and RNA Synthesizer
- 8.2.3. 96-Column DNA and RNA Synthesizer
- 8.1. Market Analysis, Insights and Forecast - by Application
- 9. Middle East & Africa Automated DNA and RNA Synthesizer Analysis, Insights and Forecast, 2019-2031
- 9.1. Market Analysis, Insights and Forecast - by Application
- 9.1.1. Medical
- 9.1.2. Laboratory
- 9.1.3. Biochemistry Research Institution
- 9.2. Market Analysis, Insights and Forecast - by Types
- 9.2.1. 10-Column DNA and RNA Synthesizer
- 9.2.2. 12-Column DNA and RNA Synthesizer
- 9.2.3. 96-Column DNA and RNA Synthesizer
- 9.1. Market Analysis, Insights and Forecast - by Application
- 10. Asia Pacific Automated DNA and RNA Synthesizer Analysis, Insights and Forecast, 2019-2031
- 10.1. Market Analysis, Insights and Forecast - by Application
- 10.1.1. Medical
- 10.1.2. Laboratory
- 10.1.3. Biochemistry Research Institution
- 10.2. Market Analysis, Insights and Forecast - by Types
- 10.2.1. 10-Column DNA and RNA Synthesizer
- 10.2.2. 12-Column DNA and RNA Synthesizer
- 10.2.3. 96-Column DNA and RNA Synthesizer
- 10.1. Market Analysis, Insights and Forecast - by Application
- 11. Competitive Analysis
- 11.1. Global Market Share Analysis 2024
- 11.2. Company Profiles
- 11.2.1 General Electric
- 11.2.1.1. Overview
- 11.2.1.2. Products
- 11.2.1.3. SWOT Analysis
- 11.2.1.4. Recent Developments
- 11.2.1.5. Financials (Based on Availability)
- 11.2.2 Thermo Fisher Scientific
- 11.2.2.1. Overview
- 11.2.2.2. Products
- 11.2.2.3. SWOT Analysis
- 11.2.2.4. Recent Developments
- 11.2.2.5. Financials (Based on Availability)
- 11.2.3 Tekna Plasma Systems
- 11.2.3.1. Overview
- 11.2.3.2. Products
- 11.2.3.3. SWOT Analysis
- 11.2.3.4. Recent Developments
- 11.2.3.5. Financials (Based on Availability)
- 11.2.4 BioAutomation Corporation
- 11.2.4.1. Overview
- 11.2.4.2. Products
- 11.2.4.3. SWOT Analysis
- 11.2.4.4. Recent Developments
- 11.2.4.5. Financials (Based on Availability)
- 11.2.5 Polygen GmbH
- 11.2.5.1. Overview
- 11.2.5.2. Products
- 11.2.5.3. SWOT Analysis
- 11.2.5.4. Recent Developments
- 11.2.5.5. Financials (Based on Availability)
- 11.2.6 GlobalSpec
- 11.2.6.1. Overview
- 11.2.6.2. Products
- 11.2.6.3. SWOT Analysis
- 11.2.6.4. Recent Developments
- 11.2.6.5. Financials (Based on Availability)
- 11.2.7 Biolytic Lab Performance
- 11.2.7.1. Overview
- 11.2.7.2. Products
- 11.2.7.3. SWOT Analysis
- 11.2.7.4. Recent Developments
- 11.2.7.5. Financials (Based on Availability)
- 11.2.8 Beckman Coulter
- 11.2.8.1. Overview
- 11.2.8.2. Products
- 11.2.8.3. SWOT Analysis
- 11.2.8.4. Recent Developments
- 11.2.8.5. Financials (Based on Availability)
- 11.2.9 ACTGene
- 11.2.9.1. Overview
- 11.2.9.2. Products
- 11.2.9.3. SWOT Analysis
- 11.2.9.4. Recent Developments
- 11.2.9.5. Financials (Based on Availability)
- 11.2.10 Precision System Science
- 11.2.10.1. Overview
- 11.2.10.2. Products
- 11.2.10.3. SWOT Analysis
- 11.2.10.4. Recent Developments
- 11.2.10.5. Financials (Based on Availability)
- 11.2.11 CSBio
- 11.2.11.1. Overview
- 11.2.11.2. Products
- 11.2.11.3. SWOT Analysis
- 11.2.11.4. Recent Developments
- 11.2.11.5. Financials (Based on Availability)
- 11.2.12 Genscript Biotech
- 11.2.12.1. Overview
- 11.2.12.2. Products
- 11.2.12.3. SWOT Analysis
- 11.2.12.4. Recent Developments
- 11.2.12.5. Financials (Based on Availability)
- 11.2.13 Protein Technologies
- 11.2.13.1. Overview
- 11.2.13.2. Products
- 11.2.13.3. SWOT Analysis
- 11.2.13.4. Recent Developments
- 11.2.13.5. Financials (Based on Availability)
- 11.2.1 General Electric
List of Figures
- Figure 1: Global Automated DNA and RNA Synthesizer Revenue Breakdown (million, %) by Region 2024 & 2032
- Figure 2: Global Automated DNA and RNA Synthesizer Volume Breakdown (K, %) by Region 2024 & 2032
- Figure 3: North America Automated DNA and RNA Synthesizer Revenue (million), by Application 2024 & 2032
- Figure 4: North America Automated DNA and RNA Synthesizer Volume (K), by Application 2024 & 2032
- Figure 5: North America Automated DNA and RNA Synthesizer Revenue Share (%), by Application 2024 & 2032
- Figure 6: North America Automated DNA and RNA Synthesizer Volume Share (%), by Application 2024 & 2032
- Figure 7: North America Automated DNA and RNA Synthesizer Revenue (million), by Types 2024 & 2032
- Figure 8: North America Automated DNA and RNA Synthesizer Volume (K), by Types 2024 & 2032
- Figure 9: North America Automated DNA and RNA Synthesizer Revenue Share (%), by Types 2024 & 2032
- Figure 10: North America Automated DNA and RNA Synthesizer Volume Share (%), by Types 2024 & 2032
- Figure 11: North America Automated DNA and RNA Synthesizer Revenue (million), by Country 2024 & 2032
- Figure 12: North America Automated DNA and RNA Synthesizer Volume (K), by Country 2024 & 2032
- Figure 13: North America Automated DNA and RNA Synthesizer Revenue Share (%), by Country 2024 & 2032
- Figure 14: North America Automated DNA and RNA Synthesizer Volume Share (%), by Country 2024 & 2032
- Figure 15: South America Automated DNA and RNA Synthesizer Revenue (million), by Application 2024 & 2032
- Figure 16: South America Automated DNA and RNA Synthesizer Volume (K), by Application 2024 & 2032
- Figure 17: South America Automated DNA and RNA Synthesizer Revenue Share (%), by Application 2024 & 2032
- Figure 18: South America Automated DNA and RNA Synthesizer Volume Share (%), by Application 2024 & 2032
- Figure 19: South America Automated DNA and RNA Synthesizer Revenue (million), by Types 2024 & 2032
- Figure 20: South America Automated DNA and RNA Synthesizer Volume (K), by Types 2024 & 2032
- Figure 21: South America Automated DNA and RNA Synthesizer Revenue Share (%), by Types 2024 & 2032
- Figure 22: South America Automated DNA and RNA Synthesizer Volume Share (%), by Types 2024 & 2032
- Figure 23: South America Automated DNA and RNA Synthesizer Revenue (million), by Country 2024 & 2032
- Figure 24: South America Automated DNA and RNA Synthesizer Volume (K), by Country 2024 & 2032
- Figure 25: South America Automated DNA and RNA Synthesizer Revenue Share (%), by Country 2024 & 2032
- Figure 26: South America Automated DNA and RNA Synthesizer Volume Share (%), by Country 2024 & 2032
- Figure 27: Europe Automated DNA and RNA Synthesizer Revenue (million), by Application 2024 & 2032
- Figure 28: Europe Automated DNA and RNA Synthesizer Volume (K), by Application 2024 & 2032
- Figure 29: Europe Automated DNA and RNA Synthesizer Revenue Share (%), by Application 2024 & 2032
- Figure 30: Europe Automated DNA and RNA Synthesizer Volume Share (%), by Application 2024 & 2032
- Figure 31: Europe Automated DNA and RNA Synthesizer Revenue (million), by Types 2024 & 2032
- Figure 32: Europe Automated DNA and RNA Synthesizer Volume (K), by Types 2024 & 2032
- Figure 33: Europe Automated DNA and RNA Synthesizer Revenue Share (%), by Types 2024 & 2032
- Figure 34: Europe Automated DNA and RNA Synthesizer Volume Share (%), by Types 2024 & 2032
- Figure 35: Europe Automated DNA and RNA Synthesizer Revenue (million), by Country 2024 & 2032
- Figure 36: Europe Automated DNA and RNA Synthesizer Volume (K), by Country 2024 & 2032
- Figure 37: Europe Automated DNA and RNA Synthesizer Revenue Share (%), by Country 2024 & 2032
- Figure 38: Europe Automated DNA and RNA Synthesizer Volume Share (%), by Country 2024 & 2032
- Figure 39: Middle East & Africa Automated DNA and RNA Synthesizer Revenue (million), by Application 2024 & 2032
- Figure 40: Middle East & Africa Automated DNA and RNA Synthesizer Volume (K), by Application 2024 & 2032
- Figure 41: Middle East & Africa Automated DNA and RNA Synthesizer Revenue Share (%), by Application 2024 & 2032
- Figure 42: Middle East & Africa Automated DNA and RNA Synthesizer Volume Share (%), by Application 2024 & 2032
- Figure 43: Middle East & Africa Automated DNA and RNA Synthesizer Revenue (million), by Types 2024 & 2032
- Figure 44: Middle East & Africa Automated DNA and RNA Synthesizer Volume (K), by Types 2024 & 2032
- Figure 45: Middle East & Africa Automated DNA and RNA Synthesizer Revenue Share (%), by Types 2024 & 2032
- Figure 46: Middle East & Africa Automated DNA and RNA Synthesizer Volume Share (%), by Types 2024 & 2032
- Figure 47: Middle East & Africa Automated DNA and RNA Synthesizer Revenue (million), by Country 2024 & 2032
- Figure 48: Middle East & Africa Automated DNA and RNA Synthesizer Volume (K), by Country 2024 & 2032
- Figure 49: Middle East & Africa Automated DNA and RNA Synthesizer Revenue Share (%), by Country 2024 & 2032
- Figure 50: Middle East & Africa Automated DNA and RNA Synthesizer Volume Share (%), by Country 2024 & 2032
- Figure 51: Asia Pacific Automated DNA and RNA Synthesizer Revenue (million), by Application 2024 & 2032
- Figure 52: Asia Pacific Automated DNA and RNA Synthesizer Volume (K), by Application 2024 & 2032
- Figure 53: Asia Pacific Automated DNA and RNA Synthesizer Revenue Share (%), by Application 2024 & 2032
- Figure 54: Asia Pacific Automated DNA and RNA Synthesizer Volume Share (%), by Application 2024 & 2032
- Figure 55: Asia Pacific Automated DNA and RNA Synthesizer Revenue (million), by Types 2024 & 2032
- Figure 56: Asia Pacific Automated DNA and RNA Synthesizer Volume (K), by Types 2024 & 2032
- Figure 57: Asia Pacific Automated DNA and RNA Synthesizer Revenue Share (%), by Types 2024 & 2032
- Figure 58: Asia Pacific Automated DNA and RNA Synthesizer Volume Share (%), by Types 2024 & 2032
- Figure 59: Asia Pacific Automated DNA and RNA Synthesizer Revenue (million), by Country 2024 & 2032
- Figure 60: Asia Pacific Automated DNA and RNA Synthesizer Volume (K), by Country 2024 & 2032
- Figure 61: Asia Pacific Automated DNA and RNA Synthesizer Revenue Share (%), by Country 2024 & 2032
- Figure 62: Asia Pacific Automated DNA and RNA Synthesizer Volume Share (%), by Country 2024 & 2032
List of Tables
- Table 1: Global Automated DNA and RNA Synthesizer Revenue million Forecast, by Region 2019 & 2032
- Table 2: Global Automated DNA and RNA Synthesizer Volume K Forecast, by Region 2019 & 2032
- Table 3: Global Automated DNA and RNA Synthesizer Revenue million Forecast, by Application 2019 & 2032
- Table 4: Global Automated DNA and RNA Synthesizer Volume K Forecast, by Application 2019 & 2032
- Table 5: Global Automated DNA and RNA Synthesizer Revenue million Forecast, by Types 2019 & 2032
- Table 6: Global Automated DNA and RNA Synthesizer Volume K Forecast, by Types 2019 & 2032
- Table 7: Global Automated DNA and RNA Synthesizer Revenue million Forecast, by Region 2019 & 2032
- Table 8: Global Automated DNA and RNA Synthesizer Volume K Forecast, by Region 2019 & 2032
- Table 9: Global Automated DNA and RNA Synthesizer Revenue million Forecast, by Application 2019 & 2032
- Table 10: Global Automated DNA and RNA Synthesizer Volume K Forecast, by Application 2019 & 2032
- Table 11: Global Automated DNA and RNA Synthesizer Revenue million Forecast, by Types 2019 & 2032
- Table 12: Global Automated DNA and RNA Synthesizer Volume K Forecast, by Types 2019 & 2032
- Table 13: Global Automated DNA and RNA Synthesizer Revenue million Forecast, by Country 2019 & 2032
- Table 14: Global Automated DNA and RNA Synthesizer Volume K Forecast, by Country 2019 & 2032
- Table 15: United States Automated DNA and RNA Synthesizer Revenue (million) Forecast, by Application 2019 & 2032
- Table 16: United States Automated DNA and RNA Synthesizer Volume (K) Forecast, by Application 2019 & 2032
- Table 17: Canada Automated DNA and RNA Synthesizer Revenue (million) Forecast, by Application 2019 & 2032
- Table 18: Canada Automated DNA and RNA Synthesizer Volume (K) Forecast, by Application 2019 & 2032
- Table 19: Mexico Automated DNA and RNA Synthesizer Revenue (million) Forecast, by Application 2019 & 2032
- Table 20: Mexico Automated DNA and RNA Synthesizer Volume (K) Forecast, by Application 2019 & 2032
- Table 21: Global Automated DNA and RNA Synthesizer Revenue million Forecast, by Application 2019 & 2032
- Table 22: Global Automated DNA and RNA Synthesizer Volume K Forecast, by Application 2019 & 2032
- Table 23: Global Automated DNA and RNA Synthesizer Revenue million Forecast, by Types 2019 & 2032
- Table 24: Global Automated DNA and RNA Synthesizer Volume K Forecast, by Types 2019 & 2032
- Table 25: Global Automated DNA and RNA Synthesizer Revenue million Forecast, by Country 2019 & 2032
- Table 26: Global Automated DNA and RNA Synthesizer Volume K Forecast, by Country 2019 & 2032
- Table 27: Brazil Automated DNA and RNA Synthesizer Revenue (million) Forecast, by Application 2019 & 2032
- Table 28: Brazil Automated DNA and RNA Synthesizer Volume (K) Forecast, by Application 2019 & 2032
- Table 29: Argentina Automated DNA and RNA Synthesizer Revenue (million) Forecast, by Application 2019 & 2032
- Table 30: Argentina Automated DNA and RNA Synthesizer Volume (K) Forecast, by Application 2019 & 2032
- Table 31: Rest of South America Automated DNA and RNA Synthesizer Revenue (million) Forecast, by Application 2019 & 2032
- Table 32: Rest of South America Automated DNA and RNA Synthesizer Volume (K) Forecast, by Application 2019 & 2032
- Table 33: Global Automated DNA and RNA Synthesizer Revenue million Forecast, by Application 2019 & 2032
- Table 34: Global Automated DNA and RNA Synthesizer Volume K Forecast, by Application 2019 & 2032
- Table 35: Global Automated DNA and RNA Synthesizer Revenue million Forecast, by Types 2019 & 2032
- Table 36: Global Automated DNA and RNA Synthesizer Volume K Forecast, by Types 2019 & 2032
- Table 37: Global Automated DNA and RNA Synthesizer Revenue million Forecast, by Country 2019 & 2032
- Table 38: Global Automated DNA and RNA Synthesizer Volume K Forecast, by Country 2019 & 2032
- Table 39: United Kingdom Automated DNA and RNA Synthesizer Revenue (million) Forecast, by Application 2019 & 2032
- Table 40: United Kingdom Automated DNA and RNA Synthesizer Volume (K) Forecast, by Application 2019 & 2032
- Table 41: Germany Automated DNA and RNA Synthesizer Revenue (million) Forecast, by Application 2019 & 2032
- Table 42: Germany Automated DNA and RNA Synthesizer Volume (K) Forecast, by Application 2019 & 2032
- Table 43: France Automated DNA and RNA Synthesizer Revenue (million) Forecast, by Application 2019 & 2032
- Table 44: France Automated DNA and RNA Synthesizer Volume (K) Forecast, by Application 2019 & 2032
- Table 45: Italy Automated DNA and RNA Synthesizer Revenue (million) Forecast, by Application 2019 & 2032
- Table 46: Italy Automated DNA and RNA Synthesizer Volume (K) Forecast, by Application 2019 & 2032
- Table 47: Spain Automated DNA and RNA Synthesizer Revenue (million) Forecast, by Application 2019 & 2032
- Table 48: Spain Automated DNA and RNA Synthesizer Volume (K) Forecast, by Application 2019 & 2032
- Table 49: Russia Automated DNA and RNA Synthesizer Revenue (million) Forecast, by Application 2019 & 2032
- Table 50: Russia Automated DNA and RNA Synthesizer Volume (K) Forecast, by Application 2019 & 2032
- Table 51: Benelux Automated DNA and RNA Synthesizer Revenue (million) Forecast, by Application 2019 & 2032
- Table 52: Benelux Automated DNA and RNA Synthesizer Volume (K) Forecast, by Application 2019 & 2032
- Table 53: Nordics Automated DNA and RNA Synthesizer Revenue (million) Forecast, by Application 2019 & 2032
- Table 54: Nordics Automated DNA and RNA Synthesizer Volume (K) Forecast, by Application 2019 & 2032
- Table 55: Rest of Europe Automated DNA and RNA Synthesizer Revenue (million) Forecast, by Application 2019 & 2032
- Table 56: Rest of Europe Automated DNA and RNA Synthesizer Volume (K) Forecast, by Application 2019 & 2032
- Table 57: Global Automated DNA and RNA Synthesizer Revenue million Forecast, by Application 2019 & 2032
- Table 58: Global Automated DNA and RNA Synthesizer Volume K Forecast, by Application 2019 & 2032
- Table 59: Global Automated DNA and RNA Synthesizer Revenue million Forecast, by Types 2019 & 2032
- Table 60: Global Automated DNA and RNA Synthesizer Volume K Forecast, by Types 2019 & 2032
- Table 61: Global Automated DNA and RNA Synthesizer Revenue million Forecast, by Country 2019 & 2032
- Table 62: Global Automated DNA and RNA Synthesizer Volume K Forecast, by Country 2019 & 2032
- Table 63: Turkey Automated DNA and RNA Synthesizer Revenue (million) Forecast, by Application 2019 & 2032
- Table 64: Turkey Automated DNA and RNA Synthesizer Volume (K) Forecast, by Application 2019 & 2032
- Table 65: Israel Automated DNA and RNA Synthesizer Revenue (million) Forecast, by Application 2019 & 2032
- Table 66: Israel Automated DNA and RNA Synthesizer Volume (K) Forecast, by Application 2019 & 2032
- Table 67: GCC Automated DNA and RNA Synthesizer Revenue (million) Forecast, by Application 2019 & 2032
- Table 68: GCC Automated DNA and RNA Synthesizer Volume (K) Forecast, by Application 2019 & 2032
- Table 69: North Africa Automated DNA and RNA Synthesizer Revenue (million) Forecast, by Application 2019 & 2032
- Table 70: North Africa Automated DNA and RNA Synthesizer Volume (K) Forecast, by Application 2019 & 2032
- Table 71: South Africa Automated DNA and RNA Synthesizer Revenue (million) Forecast, by Application 2019 & 2032
- Table 72: South Africa Automated DNA and RNA Synthesizer Volume (K) Forecast, by Application 2019 & 2032
- Table 73: Rest of Middle East & Africa Automated DNA and RNA Synthesizer Revenue (million) Forecast, by Application 2019 & 2032
- Table 74: Rest of Middle East & Africa Automated DNA and RNA Synthesizer Volume (K) Forecast, by Application 2019 & 2032
- Table 75: Global Automated DNA and RNA Synthesizer Revenue million Forecast, by Application 2019 & 2032
- Table 76: Global Automated DNA and RNA Synthesizer Volume K Forecast, by Application 2019 & 2032
- Table 77: Global Automated DNA and RNA Synthesizer Revenue million Forecast, by Types 2019 & 2032
- Table 78: Global Automated DNA and RNA Synthesizer Volume K Forecast, by Types 2019 & 2032
- Table 79: Global Automated DNA and RNA Synthesizer Revenue million Forecast, by Country 2019 & 2032
- Table 80: Global Automated DNA and RNA Synthesizer Volume K Forecast, by Country 2019 & 2032
- Table 81: China Automated DNA and RNA Synthesizer Revenue (million) Forecast, by Application 2019 & 2032
- Table 82: China Automated DNA and RNA Synthesizer Volume (K) Forecast, by Application 2019 & 2032
- Table 83: India Automated DNA and RNA Synthesizer Revenue (million) Forecast, by Application 2019 & 2032
- Table 84: India Automated DNA and RNA Synthesizer Volume (K) Forecast, by Application 2019 & 2032
- Table 85: Japan Automated DNA and RNA Synthesizer Revenue (million) Forecast, by Application 2019 & 2032
- Table 86: Japan Automated DNA and RNA Synthesizer Volume (K) Forecast, by Application 2019 & 2032
- Table 87: South Korea Automated DNA and RNA Synthesizer Revenue (million) Forecast, by Application 2019 & 2032
- Table 88: South Korea Automated DNA and RNA Synthesizer Volume (K) Forecast, by Application 2019 & 2032
- Table 89: ASEAN Automated DNA and RNA Synthesizer Revenue (million) Forecast, by Application 2019 & 2032
- Table 90: ASEAN Automated DNA and RNA Synthesizer Volume (K) Forecast, by Application 2019 & 2032
- Table 91: Oceania Automated DNA and RNA Synthesizer Revenue (million) Forecast, by Application 2019 & 2032
- Table 92: Oceania Automated DNA and RNA Synthesizer Volume (K) Forecast, by Application 2019 & 2032
- Table 93: Rest of Asia Pacific Automated DNA and RNA Synthesizer Revenue (million) Forecast, by Application 2019 & 2032
- Table 94: Rest of Asia Pacific Automated DNA and RNA Synthesizer Volume (K) Forecast, by Application 2019 & 2032
Frequently Asked Questions
1. What is the projected Compound Annual Growth Rate (CAGR) of the Automated DNA and RNA Synthesizer?
The projected CAGR is approximately XX%.
2. Which companies are prominent players in the Automated DNA and RNA Synthesizer?
Key companies in the market include General Electric, Thermo Fisher Scientific, Tekna Plasma Systems, BioAutomation Corporation, Polygen GmbH, GlobalSpec, Biolytic Lab Performance, Beckman Coulter, ACTGene, Precision System Science, CSBio, Genscript Biotech, Protein Technologies.
3. What are the main segments of the Automated DNA and RNA Synthesizer?
The market segments include Application, Types.
4. Can you provide details about the market size?
The market size is estimated to be USD XXX million as of 2022.
5. What are some drivers contributing to market growth?
N/A
6. What are the notable trends driving market growth?
N/A
7. Are there any restraints impacting market growth?
N/A
8. Can you provide examples of recent developments in the market?
N/A
9. What pricing options are available for accessing the report?
Pricing options include single-user, multi-user, and enterprise licenses priced at USD 3350.00, USD 5025.00, and USD 6700.00 respectively.
10. Is the market size provided in terms of value or volume?
The market size is provided in terms of value, measured in million and volume, measured in K.
11. Are there any specific market keywords associated with the report?
Yes, the market keyword associated with the report is "Automated DNA and RNA Synthesizer," which aids in identifying and referencing the specific market segment covered.
12. How do I determine which pricing option suits my needs best?
The pricing options vary based on user requirements and access needs. Individual users may opt for single-user licenses, while businesses requiring broader access may choose multi-user or enterprise licenses for cost-effective access to the report.
13. Are there any additional resources or data provided in the Automated DNA and RNA Synthesizer report?
While the report offers comprehensive insights, it's advisable to review the specific contents or supplementary materials provided to ascertain if additional resources or data are available.
14. How can I stay updated on further developments or reports in the Automated DNA and RNA Synthesizer?
To stay informed about further developments, trends, and reports in the Automated DNA and RNA Synthesizer, consider subscribing to industry newsletters, following relevant companies and organizations, or regularly checking reputable industry news sources and publications.
Methodology
Step 1 - Identification of Relevant Samples Size from Population Database


Step 2 - Approaches for Defining Global Market Size (Value, Volume* & Price*)

Note*: In applicable scenarios
Step 3 - Data Sources
Primary Research
- Web Analytics
- Survey Reports
- Research Institute
- Latest Research Reports
- Opinion Leaders
Secondary Research
- Annual Reports
- White Paper
- Latest Press Release
- Industry Association
- Paid Database
- Investor Presentations

Step 4 - Data Triangulation
Involves using different sources of information in order to increase the validity of a study
These sources are likely to be stakeholders in a program - participants, other researchers, program staff, other community members, and so on.
Then we put all data in single framework & apply various statistical tools to find out the dynamic on the market.
During the analysis stage, feedback from the stakeholder groups would be compared to determine areas of agreement as well as areas of divergence
