

Key Insights
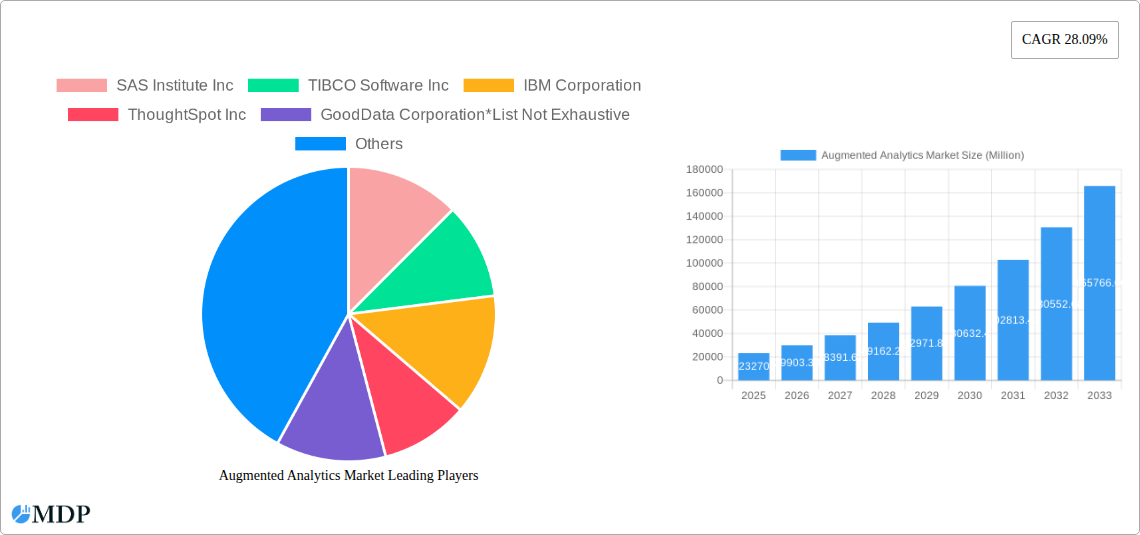
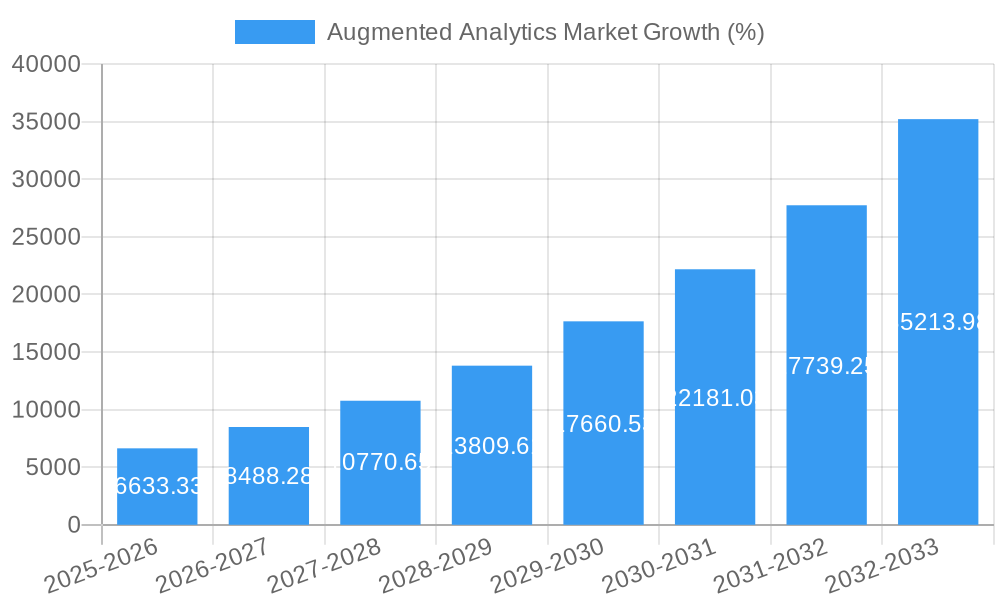
The Augmented Analytics market is experiencing robust growth, projected to reach $23.27 billion in 2025 and exhibiting a Compound Annual Growth Rate (CAGR) of 28.09% from 2025 to 2033. This expansion is fueled by several key drivers. The increasing volume and complexity of data across various industries necessitate efficient and insightful data analysis, a need perfectly addressed by augmented analytics' ability to automate data preparation, modeling, and interpretation. Furthermore, the rising adoption of cloud-based solutions enhances accessibility and scalability, contributing significantly to market growth. Businesses across sectors—including BFSI (Banking, Financial Services, and Insurance), Telecom & IT, Retail, Healthcare, Manufacturing, and Media & Entertainment—are increasingly leveraging augmented analytics to gain a competitive edge through improved decision-making, enhanced operational efficiency, and the identification of previously unseen market opportunities. The shift towards self-service analytics, empowering business users to perform sophisticated analyses without extensive technical expertise, further accelerates market adoption.
However, the market faces certain restraints. The initial investment required for implementing augmented analytics solutions can be substantial, particularly for smaller organizations. Concerns regarding data security and privacy, along with the need for robust data governance frameworks, also pose challenges. Despite these hurdles, the overall market outlook remains exceptionally positive. The continuous advancements in artificial intelligence (AI) and machine learning (ML) technologies underpinning augmented analytics are poised to further enhance its capabilities, driving even greater demand in the coming years. Major players like SAS Institute, TIBCO Software, IBM, ThoughtSpot, and Microsoft are actively contributing to this growth through continuous innovation and strategic partnerships, shaping the future of data-driven decision-making across numerous industries. The competitive landscape, characterized by both established players and emerging innovators, fosters a dynamic environment that promises continued evolution and refinement of augmented analytics solutions.
Unlock the Potential of Augmented Analytics: A Comprehensive Market Report (2019-2033)
This in-depth report provides a comprehensive analysis of the Augmented Analytics market, offering invaluable insights for businesses, investors, and industry stakeholders. Covering the period from 2019 to 2033, with a focus on 2025, this report forecasts significant growth and explores the key factors driving this expansion. The market is projected to reach xx Million by 2033, presenting substantial opportunities for strategic investment and market entry.
Key Highlights:
- Market Size & Growth: Detailed analysis of market size (xx Million in 2025, projected to reach xx Million by 2033) with a comprehensive CAGR forecast.
- Segment Analysis: In-depth segmentation by deployment (On-premise, Cloud) and end-user industry (BFSI, Telecom & IT, Retail, Healthcare, Manufacturing, Media & Entertainment, Others).
- Competitive Landscape: Profiles of leading players including SAS Institute Inc, TIBCO Software Inc, IBM Corporation, ThoughtSpot Inc, GoodData Corporation, Microsoft Corporation, QlikTech International AB, Sisense Inc, SAP SE, MicroStrategy Inc, and Salesforce com inc, analyzing market share and competitive strategies.
- Growth Drivers & Challenges: Identification of key market drivers (technological advancements, regulatory changes, economic factors) and challenges (competitive pressures, regulatory hurdles).
- Future Outlook: Strategic recommendations and insights into emerging opportunities and future market potential.
Augmented Analytics Market Market Dynamics & Concentration
The Augmented Analytics market is characterized by a dynamic interplay of factors influencing its growth and concentration. Market concentration is currently [Describe the level of concentration - e.g., moderately concentrated, highly fragmented] with the top 5 players holding an estimated [xx]% market share in 2025. Innovation is a key driver, fueled by advancements in AI, machine learning, and big data technologies. Regulatory frameworks, particularly concerning data privacy and security (e.g., GDPR, CCPA), are shaping market practices and influencing product development. The market also faces competition from traditional business intelligence tools, although Augmented Analytics' enhanced user experience and automated insights are increasingly preferred.
- M&A Activity: The number of M&A deals in the Augmented Analytics market increased to [xx] in 2024, indicating a consolidation trend among players seeking to expand their capabilities and market reach.
- Market Share Dynamics: The market share is expected to shift significantly over the forecast period. The entry of new players and strategic partnerships will continue to reshape the competitive landscape.
- Innovation Drivers: Ongoing research and development in AI and machine learning will be critical in driving further innovation. The development of more user-friendly interfaces and the integration of augmented analytics tools into existing business applications are also significant drivers.
- End-User Trends: Businesses are increasingly adopting augmented analytics to improve decision-making efficiency, gain deeper insights from their data, and reduce reliance on specialized data scientists.
Augmented Analytics Market Industry Trends & Analysis
The Augmented Analytics market is experiencing rapid growth, driven by several key factors. The increasing volume and complexity of data generated by businesses necessitates more efficient and insightful analytical tools. Augmented Analytics directly addresses this need by automating data preparation, analysis, and visualization, enabling faster and more effective decision-making. Technological advancements in AI and machine learning continue to enhance the capabilities of augmented analytics platforms, providing more accurate predictions and deeper insights. Consumer preferences are shifting towards user-friendly, intuitive tools that require minimal technical expertise, driving demand for accessible and easy-to-use augmented analytics solutions. The competitive landscape is dynamic, with established players and emerging startups vying for market share, fueling innovation and improving the overall quality of available solutions. The global market is estimated to experience a CAGR of [xx]% during the forecast period (2025-2033), with market penetration expected to reach [xx]% by 2033.
Leading Markets & Segments in Augmented Analytics Market
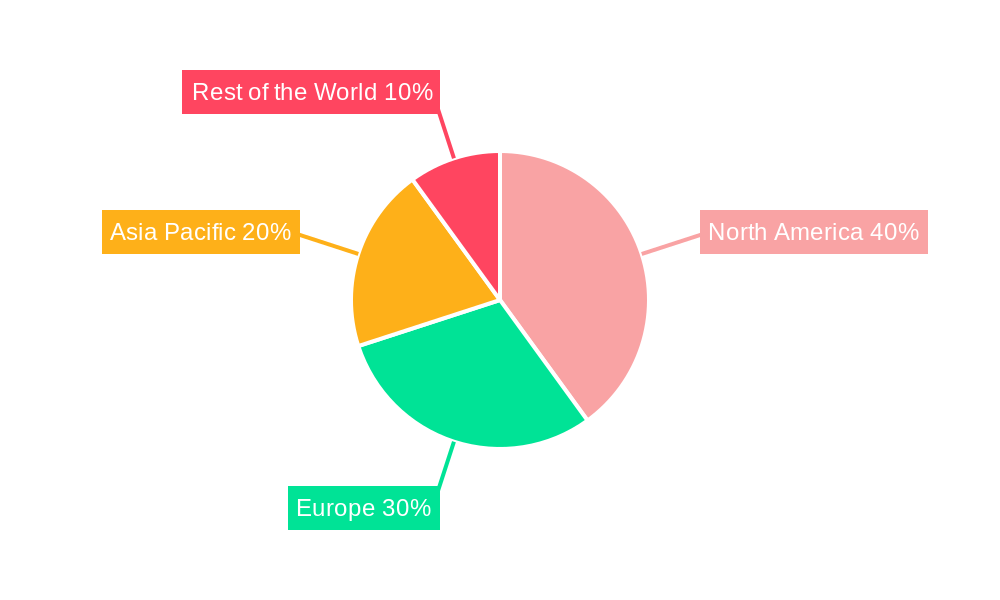
The cloud-based deployment segment is projected to dominate the Augmented Analytics market throughout the forecast period, driven by its scalability, accessibility, and cost-effectiveness. Among end-user industries, the BFSI sector is expected to lead the market due to its heavy reliance on data-driven decision-making and the potential for augmented analytics to enhance risk management, fraud detection, and customer service. The North American region is anticipated to hold a significant market share, fueled by high technology adoption rates and a robust IT infrastructure.
- Key Drivers in North America: Strong investment in technological infrastructure, a culture of data-driven decision-making in businesses, and the presence of numerous prominent technology vendors.
- Key Drivers in BFSI: Stringent regulatory compliance requirements, the need for efficient fraud detection and risk management, and personalized customer service demands.
- Key Drivers in Cloud Deployment: Increased accessibility, cost efficiency, scalability, and ease of implementation compared to on-premise solutions.
Augmented Analytics Market Product Developments
Recent advancements in Augmented Analytics include the integration of natural language processing (NLP) for more intuitive interaction and the development of more sophisticated AI-powered predictive modeling capabilities. This allows for more automated insights and faster decision-making, addressing the market need for efficient and user-friendly analytical solutions. The development of tools specifically tailored to particular industries is another key trend, improving market fit and addressing niche needs.
Key Drivers of Augmented Analytics Market Growth
Several key factors are propelling the growth of the Augmented Analytics market. Technological advancements in AI and machine learning are continuously improving the accuracy, speed, and ease of use of these solutions. The rising volume and complexity of data generated by businesses necessitate efficient tools for analysis, fueling the adoption of augmented analytics. Moreover, economic factors like the increasing need for cost-optimization and efficiency gains drive the demand for tools that automate data analysis and decision-making processes.
Challenges in the Augmented Analytics Market Market
The Augmented Analytics market faces several challenges, including the high cost of implementation and maintenance, particularly for advanced features and functionalities. Data security and privacy concerns remain significant, requiring robust security measures to protect sensitive data. The market is also highly competitive, with established players and new entrants vying for market share, requiring continuous innovation and differentiation to maintain a competitive edge. These factors can impact market growth and adoption rates, particularly among smaller businesses with limited budgets or technical expertise.
Emerging Opportunities in Augmented Analytics Market
The future of the Augmented Analytics market is bright, with several key opportunities for growth. The integration of augmented analytics with other emerging technologies, such as the metaverse and Web3, will open new avenues for innovation and application. Strategic partnerships between augmented analytics providers and industry-specific businesses will lead to tailored solutions that better address unique industry needs. Further expansion into emerging markets with growing digital economies presents a significant growth opportunity.
Leading Players in the Augmented Analytics Market Sector
- SAS Institute Inc
- TIBCO Software Inc
- IBM Corporation
- ThoughtSpot Inc
- GoodData Corporation
- Microsoft Corporation
- QlikTech International AB
- Sisense Inc
- SAP SE
- MicroStrategy Inc
- Salesforce com inc
Key Milestones in Augmented Analytics Market Industry
- May 2023: TrinityLife Sciences and WhizAI announced a strategic partnership, integrating AI-driven insights into life sciences commercialization. This highlights the growing integration of augmented analytics into specific industry verticals.
- January 2023: Seerist Inc. announced new capabilities for its augmented analytics solution, enhancing threat and security intelligence. This demonstrates ongoing product development and innovation within the market.
Strategic Outlook for Augmented Analytics Market Market
The Augmented Analytics market is poised for continued strong growth, driven by ongoing technological advancements and increasing demand across various industries. Strategic partnerships, focus on user experience, and expansion into niche markets represent key opportunities for market players to achieve sustainable growth and enhance their competitive positions. The focus on user-friendly interfaces and integration with existing business applications will further fuel market expansion.
Augmented Analytics Market Segmentation
-
1. Deployment
- 1.1. On-premise
- 1.2. Cloud
-
2. End-user Industry
- 2.1. BFSI
- 2.2. Telecom & IT
- 2.3. Retail
- 2.4. Healthcare
- 2.5. Manufacturing
- 2.6. Media & Entertainment
- 2.7. Other End-user Industries
Augmented Analytics Market Segmentation By Geography
- 1. North America
- 2. Europe
- 3. Asia Pacific
- 4. Rest of the World
Augmented Analytics Market REPORT HIGHLIGHTS
| Aspects | Details |
|---|---|
| Study Period | 2019-2033 |
| Base Year | 2024 |
| Estimated Year | 2025 |
| Forecast Period | 2025-2033 |
| Historical Period | 2019-2024 |
| Growth Rate | CAGR of 28.09% from 2019-2033 |
| Segmentation |
|
Table of Contents
- 1. Introduction
- 1.1. Research Scope
- 1.2. Market Segmentation
- 1.3. Research Methodology
- 1.4. Definitions and Assumptions
- 2. Executive Summary
- 2.1. Introduction
- 3. Market Dynamics
- 3.1. Introduction
- 3.2. Market Drivers
- 3.2.1. Increasing Demand to Cater Complex Business Data; Huge Adoption of Business Intelligence Tools
- 3.3. Market Restrains
- 3.3.1. Resistance Due to Replacement of Human Intelligence
- 3.4. Market Trends
- 3.4.1. Retail Sector is Expected to Have a Significant Growth During the Forecast Period
- 4. Market Factor Analysis
- 4.1. Porters Five Forces
- 4.2. Supply/Value Chain
- 4.3. PESTEL analysis
- 4.4. Market Entropy
- 4.5. Patent/Trademark Analysis
- 5. Global Augmented Analytics Market Analysis, Insights and Forecast, 2019-2031
- 5.1. Market Analysis, Insights and Forecast - by Deployment
- 5.1.1. On-premise
- 5.1.2. Cloud
- 5.2. Market Analysis, Insights and Forecast - by End-user Industry
- 5.2.1. BFSI
- 5.2.2. Telecom & IT
- 5.2.3. Retail
- 5.2.4. Healthcare
- 5.2.5. Manufacturing
- 5.2.6. Media & Entertainment
- 5.2.7. Other End-user Industries
- 5.3. Market Analysis, Insights and Forecast - by Region
- 5.3.1. North America
- 5.3.2. Europe
- 5.3.3. Asia Pacific
- 5.3.4. Rest of the World
- 5.1. Market Analysis, Insights and Forecast - by Deployment
- 6. North America Augmented Analytics Market Analysis, Insights and Forecast, 2019-2031
- 6.1. Market Analysis, Insights and Forecast - by Deployment
- 6.1.1. On-premise
- 6.1.2. Cloud
- 6.2. Market Analysis, Insights and Forecast - by End-user Industry
- 6.2.1. BFSI
- 6.2.2. Telecom & IT
- 6.2.3. Retail
- 6.2.4. Healthcare
- 6.2.5. Manufacturing
- 6.2.6. Media & Entertainment
- 6.2.7. Other End-user Industries
- 6.1. Market Analysis, Insights and Forecast - by Deployment
- 7. Europe Augmented Analytics Market Analysis, Insights and Forecast, 2019-2031
- 7.1. Market Analysis, Insights and Forecast - by Deployment
- 7.1.1. On-premise
- 7.1.2. Cloud
- 7.2. Market Analysis, Insights and Forecast - by End-user Industry
- 7.2.1. BFSI
- 7.2.2. Telecom & IT
- 7.2.3. Retail
- 7.2.4. Healthcare
- 7.2.5. Manufacturing
- 7.2.6. Media & Entertainment
- 7.2.7. Other End-user Industries
- 7.1. Market Analysis, Insights and Forecast - by Deployment
- 8. Asia Pacific Augmented Analytics Market Analysis, Insights and Forecast, 2019-2031
- 8.1. Market Analysis, Insights and Forecast - by Deployment
- 8.1.1. On-premise
- 8.1.2. Cloud
- 8.2. Market Analysis, Insights and Forecast - by End-user Industry
- 8.2.1. BFSI
- 8.2.2. Telecom & IT
- 8.2.3. Retail
- 8.2.4. Healthcare
- 8.2.5. Manufacturing
- 8.2.6. Media & Entertainment
- 8.2.7. Other End-user Industries
- 8.1. Market Analysis, Insights and Forecast - by Deployment
- 9. Rest of the World Augmented Analytics Market Analysis, Insights and Forecast, 2019-2031
- 9.1. Market Analysis, Insights and Forecast - by Deployment
- 9.1.1. On-premise
- 9.1.2. Cloud
- 9.2. Market Analysis, Insights and Forecast - by End-user Industry
- 9.2.1. BFSI
- 9.2.2. Telecom & IT
- 9.2.3. Retail
- 9.2.4. Healthcare
- 9.2.5. Manufacturing
- 9.2.6. Media & Entertainment
- 9.2.7. Other End-user Industries
- 9.1. Market Analysis, Insights and Forecast - by Deployment
- 10. North America Augmented Analytics Market Analysis, Insights and Forecast, 2019-2031
- 10.1. Market Analysis, Insights and Forecast - By Country/Sub-region
- 10.1.1.
- 11. Europe Augmented Analytics Market Analysis, Insights and Forecast, 2019-2031
- 11.1. Market Analysis, Insights and Forecast - By Country/Sub-region
- 11.1.1.
- 12. Asia Pacific Augmented Analytics Market Analysis, Insights and Forecast, 2019-2031
- 12.1. Market Analysis, Insights and Forecast - By Country/Sub-region
- 12.1.1.
- 13. Rest of the World Augmented Analytics Market Analysis, Insights and Forecast, 2019-2031
- 13.1. Market Analysis, Insights and Forecast - By Country/Sub-region
- 13.1.1.
- 14. Competitive Analysis
- 14.1. Global Market Share Analysis 2024
- 14.2. Company Profiles
- 14.2.1 SAS Institute Inc
- 14.2.1.1. Overview
- 14.2.1.2. Products
- 14.2.1.3. SWOT Analysis
- 14.2.1.4. Recent Developments
- 14.2.1.5. Financials (Based on Availability)
- 14.2.2 TIBCO Software Inc
- 14.2.2.1. Overview
- 14.2.2.2. Products
- 14.2.2.3. SWOT Analysis
- 14.2.2.4. Recent Developments
- 14.2.2.5. Financials (Based on Availability)
- 14.2.3 IBM Corporation
- 14.2.3.1. Overview
- 14.2.3.2. Products
- 14.2.3.3. SWOT Analysis
- 14.2.3.4. Recent Developments
- 14.2.3.5. Financials (Based on Availability)
- 14.2.4 ThoughtSpot Inc
- 14.2.4.1. Overview
- 14.2.4.2. Products
- 14.2.4.3. SWOT Analysis
- 14.2.4.4. Recent Developments
- 14.2.4.5. Financials (Based on Availability)
- 14.2.5 GoodData Corporation*List Not Exhaustive
- 14.2.5.1. Overview
- 14.2.5.2. Products
- 14.2.5.3. SWOT Analysis
- 14.2.5.4. Recent Developments
- 14.2.5.5. Financials (Based on Availability)
- 14.2.6 Microsoft Corporation
- 14.2.6.1. Overview
- 14.2.6.2. Products
- 14.2.6.3. SWOT Analysis
- 14.2.6.4. Recent Developments
- 14.2.6.5. Financials (Based on Availability)
- 14.2.7 QlikTech International AB
- 14.2.7.1. Overview
- 14.2.7.2. Products
- 14.2.7.3. SWOT Analysis
- 14.2.7.4. Recent Developments
- 14.2.7.5. Financials (Based on Availability)
- 14.2.8 Sisense Inc
- 14.2.8.1. Overview
- 14.2.8.2. Products
- 14.2.8.3. SWOT Analysis
- 14.2.8.4. Recent Developments
- 14.2.8.5. Financials (Based on Availability)
- 14.2.9 SAP SE
- 14.2.9.1. Overview
- 14.2.9.2. Products
- 14.2.9.3. SWOT Analysis
- 14.2.9.4. Recent Developments
- 14.2.9.5. Financials (Based on Availability)
- 14.2.10 MicroStrategy Inc
- 14.2.10.1. Overview
- 14.2.10.2. Products
- 14.2.10.3. SWOT Analysis
- 14.2.10.4. Recent Developments
- 14.2.10.5. Financials (Based on Availability)
- 14.2.11 Salesforce com inc
- 14.2.11.1. Overview
- 14.2.11.2. Products
- 14.2.11.3. SWOT Analysis
- 14.2.11.4. Recent Developments
- 14.2.11.5. Financials (Based on Availability)
- 14.2.1 SAS Institute Inc
List of Figures
- Figure 1: Global Augmented Analytics Market Revenue Breakdown (Million, %) by Region 2024 & 2032
- Figure 2: North America Augmented Analytics Market Revenue (Million), by Country 2024 & 2032
- Figure 3: North America Augmented Analytics Market Revenue Share (%), by Country 2024 & 2032
- Figure 4: Europe Augmented Analytics Market Revenue (Million), by Country 2024 & 2032
- Figure 5: Europe Augmented Analytics Market Revenue Share (%), by Country 2024 & 2032
- Figure 6: Asia Pacific Augmented Analytics Market Revenue (Million), by Country 2024 & 2032
- Figure 7: Asia Pacific Augmented Analytics Market Revenue Share (%), by Country 2024 & 2032
- Figure 8: Rest of the World Augmented Analytics Market Revenue (Million), by Country 2024 & 2032
- Figure 9: Rest of the World Augmented Analytics Market Revenue Share (%), by Country 2024 & 2032
- Figure 10: North America Augmented Analytics Market Revenue (Million), by Deployment 2024 & 2032
- Figure 11: North America Augmented Analytics Market Revenue Share (%), by Deployment 2024 & 2032
- Figure 12: North America Augmented Analytics Market Revenue (Million), by End-user Industry 2024 & 2032
- Figure 13: North America Augmented Analytics Market Revenue Share (%), by End-user Industry 2024 & 2032
- Figure 14: North America Augmented Analytics Market Revenue (Million), by Country 2024 & 2032
- Figure 15: North America Augmented Analytics Market Revenue Share (%), by Country 2024 & 2032
- Figure 16: Europe Augmented Analytics Market Revenue (Million), by Deployment 2024 & 2032
- Figure 17: Europe Augmented Analytics Market Revenue Share (%), by Deployment 2024 & 2032
- Figure 18: Europe Augmented Analytics Market Revenue (Million), by End-user Industry 2024 & 2032
- Figure 19: Europe Augmented Analytics Market Revenue Share (%), by End-user Industry 2024 & 2032
- Figure 20: Europe Augmented Analytics Market Revenue (Million), by Country 2024 & 2032
- Figure 21: Europe Augmented Analytics Market Revenue Share (%), by Country 2024 & 2032
- Figure 22: Asia Pacific Augmented Analytics Market Revenue (Million), by Deployment 2024 & 2032
- Figure 23: Asia Pacific Augmented Analytics Market Revenue Share (%), by Deployment 2024 & 2032
- Figure 24: Asia Pacific Augmented Analytics Market Revenue (Million), by End-user Industry 2024 & 2032
- Figure 25: Asia Pacific Augmented Analytics Market Revenue Share (%), by End-user Industry 2024 & 2032
- Figure 26: Asia Pacific Augmented Analytics Market Revenue (Million), by Country 2024 & 2032
- Figure 27: Asia Pacific Augmented Analytics Market Revenue Share (%), by Country 2024 & 2032
- Figure 28: Rest of the World Augmented Analytics Market Revenue (Million), by Deployment 2024 & 2032
- Figure 29: Rest of the World Augmented Analytics Market Revenue Share (%), by Deployment 2024 & 2032
- Figure 30: Rest of the World Augmented Analytics Market Revenue (Million), by End-user Industry 2024 & 2032
- Figure 31: Rest of the World Augmented Analytics Market Revenue Share (%), by End-user Industry 2024 & 2032
- Figure 32: Rest of the World Augmented Analytics Market Revenue (Million), by Country 2024 & 2032
- Figure 33: Rest of the World Augmented Analytics Market Revenue Share (%), by Country 2024 & 2032
List of Tables
- Table 1: Global Augmented Analytics Market Revenue Million Forecast, by Region 2019 & 2032
- Table 2: Global Augmented Analytics Market Revenue Million Forecast, by Deployment 2019 & 2032
- Table 3: Global Augmented Analytics Market Revenue Million Forecast, by End-user Industry 2019 & 2032
- Table 4: Global Augmented Analytics Market Revenue Million Forecast, by Region 2019 & 2032
- Table 5: Global Augmented Analytics Market Revenue Million Forecast, by Country 2019 & 2032
- Table 6: Augmented Analytics Market Revenue (Million) Forecast, by Application 2019 & 2032
- Table 7: Global Augmented Analytics Market Revenue Million Forecast, by Country 2019 & 2032
- Table 8: Augmented Analytics Market Revenue (Million) Forecast, by Application 2019 & 2032
- Table 9: Global Augmented Analytics Market Revenue Million Forecast, by Country 2019 & 2032
- Table 10: Augmented Analytics Market Revenue (Million) Forecast, by Application 2019 & 2032
- Table 11: Global Augmented Analytics Market Revenue Million Forecast, by Country 2019 & 2032
- Table 12: Augmented Analytics Market Revenue (Million) Forecast, by Application 2019 & 2032
- Table 13: Global Augmented Analytics Market Revenue Million Forecast, by Deployment 2019 & 2032
- Table 14: Global Augmented Analytics Market Revenue Million Forecast, by End-user Industry 2019 & 2032
- Table 15: Global Augmented Analytics Market Revenue Million Forecast, by Country 2019 & 2032
- Table 16: Global Augmented Analytics Market Revenue Million Forecast, by Deployment 2019 & 2032
- Table 17: Global Augmented Analytics Market Revenue Million Forecast, by End-user Industry 2019 & 2032
- Table 18: Global Augmented Analytics Market Revenue Million Forecast, by Country 2019 & 2032
- Table 19: Global Augmented Analytics Market Revenue Million Forecast, by Deployment 2019 & 2032
- Table 20: Global Augmented Analytics Market Revenue Million Forecast, by End-user Industry 2019 & 2032
- Table 21: Global Augmented Analytics Market Revenue Million Forecast, by Country 2019 & 2032
- Table 22: Global Augmented Analytics Market Revenue Million Forecast, by Deployment 2019 & 2032
- Table 23: Global Augmented Analytics Market Revenue Million Forecast, by End-user Industry 2019 & 2032
- Table 24: Global Augmented Analytics Market Revenue Million Forecast, by Country 2019 & 2032
Frequently Asked Questions
1. What is the projected Compound Annual Growth Rate (CAGR) of the Augmented Analytics Market?
The projected CAGR is approximately 28.09%.
2. Which companies are prominent players in the Augmented Analytics Market?
Key companies in the market include SAS Institute Inc, TIBCO Software Inc, IBM Corporation, ThoughtSpot Inc, GoodData Corporation*List Not Exhaustive, Microsoft Corporation, QlikTech International AB, Sisense Inc, SAP SE, MicroStrategy Inc, Salesforce com inc.
3. What are the main segments of the Augmented Analytics Market?
The market segments include Deployment, End-user Industry.
4. Can you provide details about the market size?
The market size is estimated to be USD 23.27 Million as of 2022.
5. What are some drivers contributing to market growth?
Increasing Demand to Cater Complex Business Data; Huge Adoption of Business Intelligence Tools.
6. What are the notable trends driving market growth?
Retail Sector is Expected to Have a Significant Growth During the Forecast Period.
7. Are there any restraints impacting market growth?
Resistance Due to Replacement of Human Intelligence.
8. Can you provide examples of recent developments in the market?
May 2023: TrinityLife Sciences, a leader in global life sciences commercialization solutions, and WhizAI, a leader in AI-powered analytics for life sciences and healthcare, announced a strategic partnership that allows life sciences companies to quickly and easily generate and share AI-driven insights. WhizAI’s augmented analytics can be layered on Trinity’s enterprise reporting platforms to bring insights to more organizational stakeholders.
9. What pricing options are available for accessing the report?
Pricing options include single-user, multi-user, and enterprise licenses priced at USD 4750, USD 5250, and USD 8750 respectively.
10. Is the market size provided in terms of value or volume?
The market size is provided in terms of value, measured in Million.
11. Are there any specific market keywords associated with the report?
Yes, the market keyword associated with the report is "Augmented Analytics Market," which aids in identifying and referencing the specific market segment covered.
12. How do I determine which pricing option suits my needs best?
The pricing options vary based on user requirements and access needs. Individual users may opt for single-user licenses, while businesses requiring broader access may choose multi-user or enterprise licenses for cost-effective access to the report.
13. Are there any additional resources or data provided in the Augmented Analytics Market report?
While the report offers comprehensive insights, it's advisable to review the specific contents or supplementary materials provided to ascertain if additional resources or data are available.
14. How can I stay updated on further developments or reports in the Augmented Analytics Market?
To stay informed about further developments, trends, and reports in the Augmented Analytics Market, consider subscribing to industry newsletters, following relevant companies and organizations, or regularly checking reputable industry news sources and publications.
Methodology
Step 1 - Identification of Relevant Samples Size from Population Database


Step 2 - Approaches for Defining Global Market Size (Value, Volume* & Price*)

Note*: In applicable scenarios
Step 3 - Data Sources
Primary Research
- Web Analytics
- Survey Reports
- Research Institute
- Latest Research Reports
- Opinion Leaders
Secondary Research
- Annual Reports
- White Paper
- Latest Press Release
- Industry Association
- Paid Database
- Investor Presentations

Step 4 - Data Triangulation
Involves using different sources of information in order to increase the validity of a study
These sources are likely to be stakeholders in a program - participants, other researchers, program staff, other community members, and so on.
Then we put all data in single framework & apply various statistical tools to find out the dynamic on the market.
During the analysis stage, feedback from the stakeholder groups would be compared to determine areas of agreement as well as areas of divergence
