

Key Insights
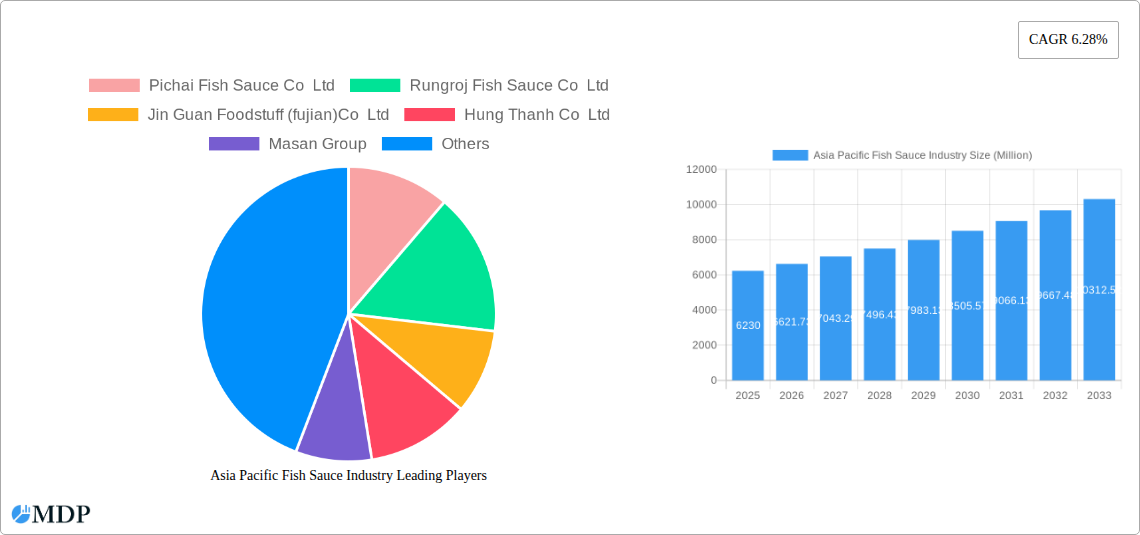
The Asia-Pacific fish sauce market, valued at $6.23 billion in 2025, is projected to experience robust growth, driven by increasing consumer demand for authentic Asian flavors in both domestic and international markets. This growth is fueled by several key factors. Firstly, the rising popularity of Southeast Asian cuisine globally is significantly impacting consumption. Secondly, the increasing adoption of convenient and ready-to-eat food products incorporating fish sauce is boosting demand. Furthermore, the expanding middle class in key Asian countries like China, India, and Vietnam is leading to increased disposable income and higher spending on food items, including condiments like fish sauce. The market segmentation reveals a strong preference for premium fish sauce variants, indicating a willingness to pay more for higher quality and taste. The food manufacturing sector represents a significant portion of the end-user segment, emphasizing the integral role fish sauce plays in the production of various food items. However, the market faces certain challenges including fluctuating raw material prices and potential supply chain disruptions, which could impact production costs and market stability. Competitive dynamics are characterized by a mix of established players like Masan Group and smaller regional producers, highlighting the presence of both large-scale and niche market players. Geographical analysis points to China, Japan, and India as major contributors to the market's overall value, although significant growth potential exists within other Southeast Asian countries. The market is also witnessing a shift towards more sustainable and ethically sourced fish sauce production methods, reflecting growing consumer awareness of environmental and social responsibility.
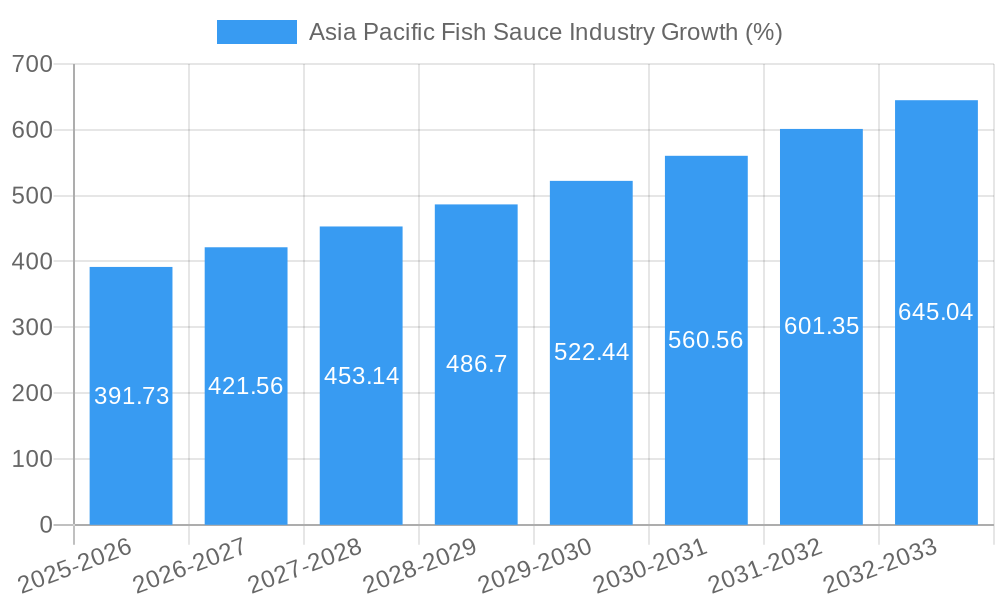
The forecast period (2025-2033) anticipates sustained growth at a Compound Annual Growth Rate (CAGR) of 6.28%, pushing the market value significantly higher by 2033. This growth will be further shaped by evolving consumer preferences, new product innovations, and the expansion of distribution channels. Companies are likely to focus on strategies such as product diversification (e.g., introducing organic or low-sodium options), brand building, and strategic partnerships to capture larger market shares. Government regulations pertaining to food safety and labeling will also play a crucial role in shaping the industry's landscape. Further research into specific regional nuances and consumer behavior will be vital for optimizing marketing and product development efforts to fully capitalize on the projected market growth.
Asia Pacific Fish Sauce Industry: A Comprehensive Market Report (2019-2033)
This comprehensive report provides an in-depth analysis of the Asia Pacific fish sauce industry, covering market dynamics, leading players, key trends, and future growth prospects. With a study period spanning 2019-2033, a base year of 2025, and a forecast period of 2025-2033, this report offers invaluable insights for industry stakeholders, investors, and businesses seeking to capitalize on the burgeoning opportunities within this dynamic market. The report utilizes data from the historical period of 2019-2024 and provides estimations for 2025. All values are expressed in Millions.
Asia Pacific Fish Sauce Industry Market Dynamics & Concentration
The Asia Pacific fish sauce market exhibits a moderately concentrated landscape, with several established players and a growing number of emerging brands competing for market share. Market concentration is influenced by factors such as brand recognition, distribution networks, and production capacity. The market is witnessing significant innovation driven by consumer demand for premium and specialized products, including organic and sustainably sourced options. Regulatory frameworks, particularly concerning food safety and labeling, play a significant role in shaping market dynamics. The presence of alternative condiments, such as soy sauce and other fermented sauces, acts as a competitive pressure and a substitute. End-user trends, particularly shifts in culinary preferences and consumption patterns among different demographic groups, influence market growth. The industry has witnessed a moderate level of M&A activity in recent years, with larger companies seeking to expand their market reach and product portfolios. For example, while exact figures are not publicly available, we estimate that M&A deal counts totaled xx in the period 2019-2024, resulting in a xx% market share consolidation among the top 5 players.
Asia Pacific Fish Sauce Industry Industry Trends & Analysis
The Asia Pacific fish sauce market is experiencing robust growth, driven by several key factors. Increasing consumer preference for authentic Asian cuisines, particularly in Western markets, has significantly boosted demand. The rising popularity of home cooking and the increasing consumption of Southeast Asian food globally fuels market growth. The market is also witnessing a shift towards premium fish sauce segments, reflecting increasing consumer willingness to pay more for high-quality and unique flavors. This trend is reflected in a CAGR of xx% for the premium segment during the forecast period. Technological advancements, such as improved processing techniques and packaging solutions, are enhancing product quality and shelf life. However, the industry faces challenges related to fluctuating raw material prices and sustainability concerns. The market penetration of traditional fish sauce in newer markets is projected to reach xx% by 2033. Competitive dynamics are shaped by factors such as brand loyalty, product differentiation, and pricing strategies.
Leading Markets & Segments in Asia Pacific Fish Sauce Industry
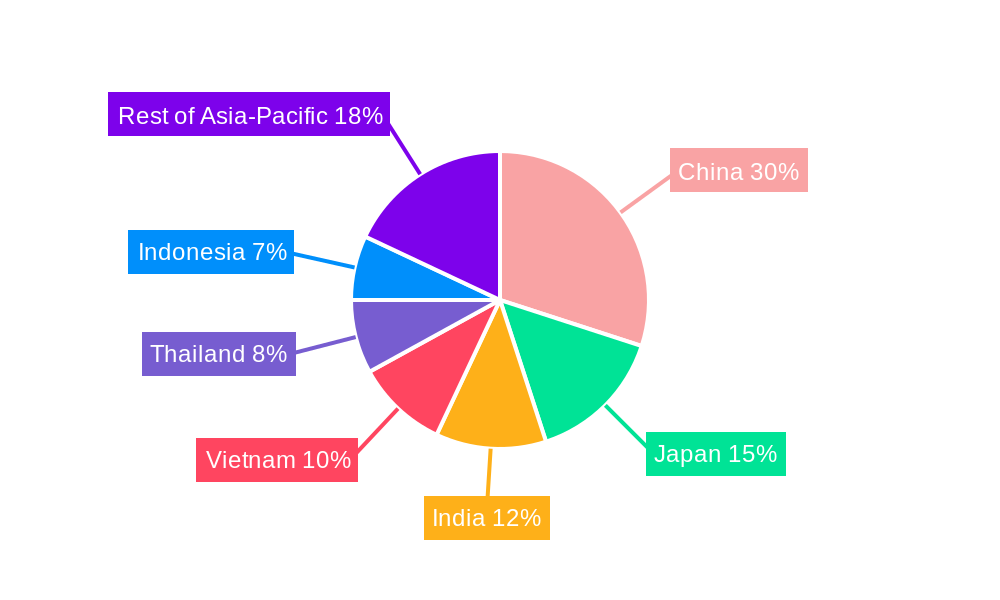
Vietnam remains the dominant market in the Asia Pacific region, primarily due to its long history of fish sauce production and a well-established supply chain. Other key markets include Thailand, China, and Indonesia, each exhibiting significant growth potential. The food service segment represents a substantial portion of overall demand.
- Key Drivers in Vietnam: Strong domestic demand, established production infrastructure, favorable government policies supporting the fishing and food processing industries.
- Key Drivers in Thailand: High per capita consumption, significant export capabilities, strong brand recognition of Thai fish sauce brands.
- Key Drivers in China: Expanding middle class, growing demand for authentic Asian flavors, increasing popularity of Vietnamese and Thai cuisine.
- Key Drivers in Indonesia: Large population, increasing urbanization, and a rising disposable income are driving demand for both traditional and premium varieties.
The premium segment is witnessing faster growth compared to the basic segment due to rising consumer disposable incomes and a preference for high-quality products. Food manufacturers represent the largest end-user segment, driven by their increasing use of fish sauce as an ingredient in a wide range of food products.
Asia Pacific Fish Sauce Industry Product Developments
Recent product innovations have focused on enhancing flavor profiles, developing convenient packaging formats, and introducing organic and sustainably sourced options. Companies are leveraging technology to improve production efficiency and product quality. For instance, advanced fermentation techniques are used to create more consistent and flavorful products. The introduction of new product formats such as single-serve pouches caters to growing consumer demands for convenience. This increased diversity in product offerings ensures market fit for various consumer segments, and promotes brand differentiation within the market.
Key Drivers of Asia Pacific Fish Sauce Industry Growth
Several key factors are driving the growth of the Asia Pacific fish sauce industry. Increasing demand for Asian cuisine globally is a major catalyst. The growth of the food service industry contributes significantly to market expansion. Rising consumer disposable incomes, especially in emerging economies, increase the purchasing power for high-quality ingredients, boosting demand. Technological advancements in fermentation and processing techniques improve product quality and efficiency. Moreover, supportive government policies in several countries promote the sustainable development of the aquaculture and food processing industries.
Challenges in the Asia Pacific Fish Sauce Industry Market
The industry faces challenges related to raw material price volatility and supply chain disruptions, impacting production costs and profitability. Stringent food safety regulations and labeling requirements impose compliance costs. Intense competition from both established and emerging players creates pressure on pricing and margins. Sustainability concerns regarding fishing practices and environmental impact are also gaining prominence and pose a challenge to long-term market sustainability. We estimate that these factors collectively reduced industry growth by approximately xx% in 2024.
Emerging Opportunities in Asia Pacific Fish Sauce Industry
Growing consumer demand for premium and specialized fish sauces presents significant opportunities. The expansion into new markets outside Asia Pacific through strategic partnerships and distribution agreements offers high growth potential. Technological breakthroughs in fermentation and flavor enhancement create possibilities for innovative product development. Investments in sustainable and environmentally friendly practices address growing consumer concerns and improve brand image. The rise of e-commerce channels creates avenues to reach wider customer segments.
Leading Players in the Asia Pacific Fish Sauce Industry Sector
- Pichai Fish Sauce Co Ltd
- Rungroj Fish Sauce Co Ltd
- Jin Guan Foodstuff (fujian) Co Ltd
- Hung Thanh Co Ltd
- Masan Group
- Rayong Fish Sauce Industry co ltd
- Nam Phuong Food (Barona Vietnam)
- Sin Guo Co (Pte) Ltd
- Red Boat Fish Sauce
- Tang Sang Hah Co Ltd
Key Milestones in Asia Pacific Fish Sauce Industry Industry
- September 2021: Red Boat Fish Sauce launched Kho Sauce, expanding its product portfolio and catering to evolving consumer preferences.
- January 2023: Hoang Gia Fish Sauce introduced new product sizes in the Australian market, successfully leveraging promotional strategies to boost sales and brand awareness during Lunar New Year.
Strategic Outlook for Asia Pacific Fish Sauce Industry Market
The Asia Pacific fish sauce market is poised for sustained growth driven by increasing consumer demand, product innovation, and market expansion. Strategic opportunities lie in developing premium and specialized products, expanding into new geographic markets, and embracing sustainable production practices. Companies that successfully adapt to changing consumer preferences, leverage technological advancements, and manage supply chain challenges are expected to thrive in this dynamic market. The long-term outlook remains positive, projecting significant growth in both volume and value over the forecast period.
Asia Pacific Fish Sauce Industry Segmentation
-
1. Product Type
- 1.1. Industrial
- 1.2. Traditional
-
2. Composition
- 2.1. Basic
- 2.2. Premium
-
3. End-User
- 3.1. Food Manufacturers
- 3.2. Retail
- 3.3. Food Service
Asia Pacific Fish Sauce Industry Segmentation By Geography
-
1. Asia Pacific
- 1.1. China
- 1.2. Japan
- 1.3. South Korea
- 1.4. India
- 1.5. Australia
- 1.6. New Zealand
- 1.7. Indonesia
- 1.8. Malaysia
- 1.9. Singapore
- 1.10. Thailand
- 1.11. Vietnam
- 1.12. Philippines
Asia Pacific Fish Sauce Industry REPORT HIGHLIGHTS
| Aspects | Details |
|---|---|
| Study Period | 2019-2033 |
| Base Year | 2024 |
| Estimated Year | 2025 |
| Forecast Period | 2025-2033 |
| Historical Period | 2019-2024 |
| Growth Rate | CAGR of 6.28% from 2019-2033 |
| Segmentation |
|
Table of Contents
- 1. Introduction
- 1.1. Research Scope
- 1.2. Market Segmentation
- 1.3. Research Methodology
- 1.4. Definitions and Assumptions
- 2. Executive Summary
- 2.1. Introduction
- 3. Market Dynamics
- 3.1. Introduction
- 3.2. Market Drivers
- 3.2.1. Health Benefits Promoting Apple Cider Vinegar Demand; Unfiltered Apple Cider Vinegar Being Popular
- 3.3. Market Restrains
- 3.3.1. Rising Demand for Other Vinegar Types
- 3.4. Market Trends
- 3.4.1. Rise in the Demand for Fortified Fish Sauce
- 4. Market Factor Analysis
- 4.1. Porters Five Forces
- 4.2. Supply/Value Chain
- 4.3. PESTEL analysis
- 4.4. Market Entropy
- 4.5. Patent/Trademark Analysis
- 5. Asia Pacific Fish Sauce Industry Analysis, Insights and Forecast, 2019-2031
- 5.1. Market Analysis, Insights and Forecast - by Product Type
- 5.1.1. Industrial
- 5.1.2. Traditional
- 5.2. Market Analysis, Insights and Forecast - by Composition
- 5.2.1. Basic
- 5.2.2. Premium
- 5.3. Market Analysis, Insights and Forecast - by End-User
- 5.3.1. Food Manufacturers
- 5.3.2. Retail
- 5.3.3. Food Service
- 5.4. Market Analysis, Insights and Forecast - by Region
- 5.4.1. Asia Pacific
- 5.1. Market Analysis, Insights and Forecast - by Product Type
- 6. China Asia Pacific Fish Sauce Industry Analysis, Insights and Forecast, 2019-2031
- 7. Japan Asia Pacific Fish Sauce Industry Analysis, Insights and Forecast, 2019-2031
- 8. India Asia Pacific Fish Sauce Industry Analysis, Insights and Forecast, 2019-2031
- 9. South Korea Asia Pacific Fish Sauce Industry Analysis, Insights and Forecast, 2019-2031
- 10. Taiwan Asia Pacific Fish Sauce Industry Analysis, Insights and Forecast, 2019-2031
- 11. Australia Asia Pacific Fish Sauce Industry Analysis, Insights and Forecast, 2019-2031
- 12. Rest of Asia-Pacific Asia Pacific Fish Sauce Industry Analysis, Insights and Forecast, 2019-2031
- 13. Competitive Analysis
- 13.1. Market Share Analysis 2024
- 13.2. Company Profiles
- 13.2.1 Pichai Fish Sauce Co Ltd
- 13.2.1.1. Overview
- 13.2.1.2. Products
- 13.2.1.3. SWOT Analysis
- 13.2.1.4. Recent Developments
- 13.2.1.5. Financials (Based on Availability)
- 13.2.2 Rungroj Fish Sauce Co Ltd
- 13.2.2.1. Overview
- 13.2.2.2. Products
- 13.2.2.3. SWOT Analysis
- 13.2.2.4. Recent Developments
- 13.2.2.5. Financials (Based on Availability)
- 13.2.3 Jin Guan Foodstuff (fujian)Co Ltd
- 13.2.3.1. Overview
- 13.2.3.2. Products
- 13.2.3.3. SWOT Analysis
- 13.2.3.4. Recent Developments
- 13.2.3.5. Financials (Based on Availability)
- 13.2.4 Hung Thanh Co Ltd
- 13.2.4.1. Overview
- 13.2.4.2. Products
- 13.2.4.3. SWOT Analysis
- 13.2.4.4. Recent Developments
- 13.2.4.5. Financials (Based on Availability)
- 13.2.5 Masan Group
- 13.2.5.1. Overview
- 13.2.5.2. Products
- 13.2.5.3. SWOT Analysis
- 13.2.5.4. Recent Developments
- 13.2.5.5. Financials (Based on Availability)
- 13.2.6 Rayong Fish Sauce Industry co ltd
- 13.2.6.1. Overview
- 13.2.6.2. Products
- 13.2.6.3. SWOT Analysis
- 13.2.6.4. Recent Developments
- 13.2.6.5. Financials (Based on Availability)
- 13.2.7 Nam Phuong Food (Barona Vietnam)*List Not Exhaustive
- 13.2.7.1. Overview
- 13.2.7.2. Products
- 13.2.7.3. SWOT Analysis
- 13.2.7.4. Recent Developments
- 13.2.7.5. Financials (Based on Availability)
- 13.2.8 Sin Guo Co (Pte) Ltd
- 13.2.8.1. Overview
- 13.2.8.2. Products
- 13.2.8.3. SWOT Analysis
- 13.2.8.4. Recent Developments
- 13.2.8.5. Financials (Based on Availability)
- 13.2.9 Red Boat Fish Sauce
- 13.2.9.1. Overview
- 13.2.9.2. Products
- 13.2.9.3. SWOT Analysis
- 13.2.9.4. Recent Developments
- 13.2.9.5. Financials (Based on Availability)
- 13.2.10 Tang Sang Hah Co Ltd
- 13.2.10.1. Overview
- 13.2.10.2. Products
- 13.2.10.3. SWOT Analysis
- 13.2.10.4. Recent Developments
- 13.2.10.5. Financials (Based on Availability)
- 13.2.1 Pichai Fish Sauce Co Ltd
List of Figures
- Figure 1: Asia Pacific Fish Sauce Industry Revenue Breakdown (Million, %) by Product 2024 & 2032
- Figure 2: Asia Pacific Fish Sauce Industry Share (%) by Company 2024
List of Tables
- Table 1: Asia Pacific Fish Sauce Industry Revenue Million Forecast, by Region 2019 & 2032
- Table 2: Asia Pacific Fish Sauce Industry Revenue Million Forecast, by Product Type 2019 & 2032
- Table 3: Asia Pacific Fish Sauce Industry Revenue Million Forecast, by Composition 2019 & 2032
- Table 4: Asia Pacific Fish Sauce Industry Revenue Million Forecast, by End-User 2019 & 2032
- Table 5: Asia Pacific Fish Sauce Industry Revenue Million Forecast, by Region 2019 & 2032
- Table 6: Asia Pacific Fish Sauce Industry Revenue Million Forecast, by Country 2019 & 2032
- Table 7: China Asia Pacific Fish Sauce Industry Revenue (Million) Forecast, by Application 2019 & 2032
- Table 8: Japan Asia Pacific Fish Sauce Industry Revenue (Million) Forecast, by Application 2019 & 2032
- Table 9: India Asia Pacific Fish Sauce Industry Revenue (Million) Forecast, by Application 2019 & 2032
- Table 10: South Korea Asia Pacific Fish Sauce Industry Revenue (Million) Forecast, by Application 2019 & 2032
- Table 11: Taiwan Asia Pacific Fish Sauce Industry Revenue (Million) Forecast, by Application 2019 & 2032
- Table 12: Australia Asia Pacific Fish Sauce Industry Revenue (Million) Forecast, by Application 2019 & 2032
- Table 13: Rest of Asia-Pacific Asia Pacific Fish Sauce Industry Revenue (Million) Forecast, by Application 2019 & 2032
- Table 14: Asia Pacific Fish Sauce Industry Revenue Million Forecast, by Product Type 2019 & 2032
- Table 15: Asia Pacific Fish Sauce Industry Revenue Million Forecast, by Composition 2019 & 2032
- Table 16: Asia Pacific Fish Sauce Industry Revenue Million Forecast, by End-User 2019 & 2032
- Table 17: Asia Pacific Fish Sauce Industry Revenue Million Forecast, by Country 2019 & 2032
- Table 18: China Asia Pacific Fish Sauce Industry Revenue (Million) Forecast, by Application 2019 & 2032
- Table 19: Japan Asia Pacific Fish Sauce Industry Revenue (Million) Forecast, by Application 2019 & 2032
- Table 20: South Korea Asia Pacific Fish Sauce Industry Revenue (Million) Forecast, by Application 2019 & 2032
- Table 21: India Asia Pacific Fish Sauce Industry Revenue (Million) Forecast, by Application 2019 & 2032
- Table 22: Australia Asia Pacific Fish Sauce Industry Revenue (Million) Forecast, by Application 2019 & 2032
- Table 23: New Zealand Asia Pacific Fish Sauce Industry Revenue (Million) Forecast, by Application 2019 & 2032
- Table 24: Indonesia Asia Pacific Fish Sauce Industry Revenue (Million) Forecast, by Application 2019 & 2032
- Table 25: Malaysia Asia Pacific Fish Sauce Industry Revenue (Million) Forecast, by Application 2019 & 2032
- Table 26: Singapore Asia Pacific Fish Sauce Industry Revenue (Million) Forecast, by Application 2019 & 2032
- Table 27: Thailand Asia Pacific Fish Sauce Industry Revenue (Million) Forecast, by Application 2019 & 2032
- Table 28: Vietnam Asia Pacific Fish Sauce Industry Revenue (Million) Forecast, by Application 2019 & 2032
- Table 29: Philippines Asia Pacific Fish Sauce Industry Revenue (Million) Forecast, by Application 2019 & 2032
Frequently Asked Questions
1. What is the projected Compound Annual Growth Rate (CAGR) of the Asia Pacific Fish Sauce Industry?
The projected CAGR is approximately 6.28%.
2. Which companies are prominent players in the Asia Pacific Fish Sauce Industry?
Key companies in the market include Pichai Fish Sauce Co Ltd, Rungroj Fish Sauce Co Ltd, Jin Guan Foodstuff (fujian)Co Ltd, Hung Thanh Co Ltd, Masan Group, Rayong Fish Sauce Industry co ltd, Nam Phuong Food (Barona Vietnam)*List Not Exhaustive, Sin Guo Co (Pte) Ltd, Red Boat Fish Sauce, Tang Sang Hah Co Ltd.
3. What are the main segments of the Asia Pacific Fish Sauce Industry?
The market segments include Product Type, Composition, End-User.
4. Can you provide details about the market size?
The market size is estimated to be USD 6.23 Million as of 2022.
5. What are some drivers contributing to market growth?
Health Benefits Promoting Apple Cider Vinegar Demand; Unfiltered Apple Cider Vinegar Being Popular.
6. What are the notable trends driving market growth?
Rise in the Demand for Fortified Fish Sauce.
7. Are there any restraints impacting market growth?
Rising Demand for Other Vinegar Types.
8. Can you provide examples of recent developments in the market?
January 2023: Hoang Gia Fish Sauce launched new product sizes in the Australian market just in time for Lunar New Year 2023. In addition, the company has implemented several promotional strategies to increase sales and brand awareness, such as buy two get one free and combo offers. By introducing different product sizes, Hoang Gia fish sauce can cater to a broader range of customers who may have varying needs or preferences.
9. What pricing options are available for accessing the report?
Pricing options include single-user, multi-user, and enterprise licenses priced at USD 4750, USD 5250, and USD 8750 respectively.
10. Is the market size provided in terms of value or volume?
The market size is provided in terms of value, measured in Million.
11. Are there any specific market keywords associated with the report?
Yes, the market keyword associated with the report is "Asia Pacific Fish Sauce Industry," which aids in identifying and referencing the specific market segment covered.
12. How do I determine which pricing option suits my needs best?
The pricing options vary based on user requirements and access needs. Individual users may opt for single-user licenses, while businesses requiring broader access may choose multi-user or enterprise licenses for cost-effective access to the report.
13. Are there any additional resources or data provided in the Asia Pacific Fish Sauce Industry report?
While the report offers comprehensive insights, it's advisable to review the specific contents or supplementary materials provided to ascertain if additional resources or data are available.
14. How can I stay updated on further developments or reports in the Asia Pacific Fish Sauce Industry?
To stay informed about further developments, trends, and reports in the Asia Pacific Fish Sauce Industry, consider subscribing to industry newsletters, following relevant companies and organizations, or regularly checking reputable industry news sources and publications.
Methodology
Step 1 - Identification of Relevant Samples Size from Population Database


Step 2 - Approaches for Defining Global Market Size (Value, Volume* & Price*)

Note*: In applicable scenarios
Step 3 - Data Sources
Primary Research
- Web Analytics
- Survey Reports
- Research Institute
- Latest Research Reports
- Opinion Leaders
Secondary Research
- Annual Reports
- White Paper
- Latest Press Release
- Industry Association
- Paid Database
- Investor Presentations

Step 4 - Data Triangulation
Involves using different sources of information in order to increase the validity of a study
These sources are likely to be stakeholders in a program - participants, other researchers, program staff, other community members, and so on.
Then we put all data in single framework & apply various statistical tools to find out the dynamic on the market.
During the analysis stage, feedback from the stakeholder groups would be compared to determine areas of agreement as well as areas of divergence
