

Key Insights
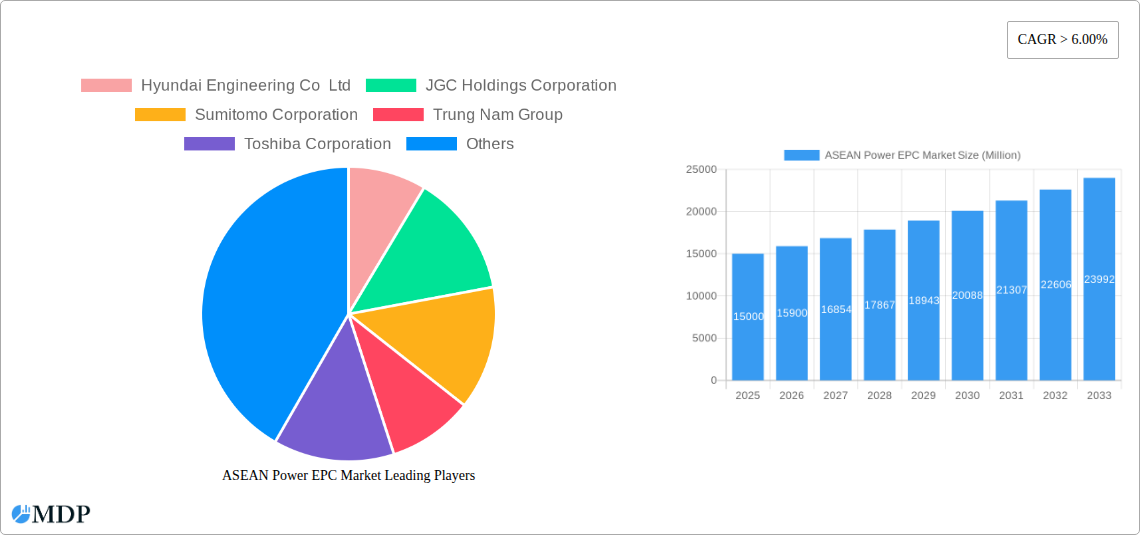
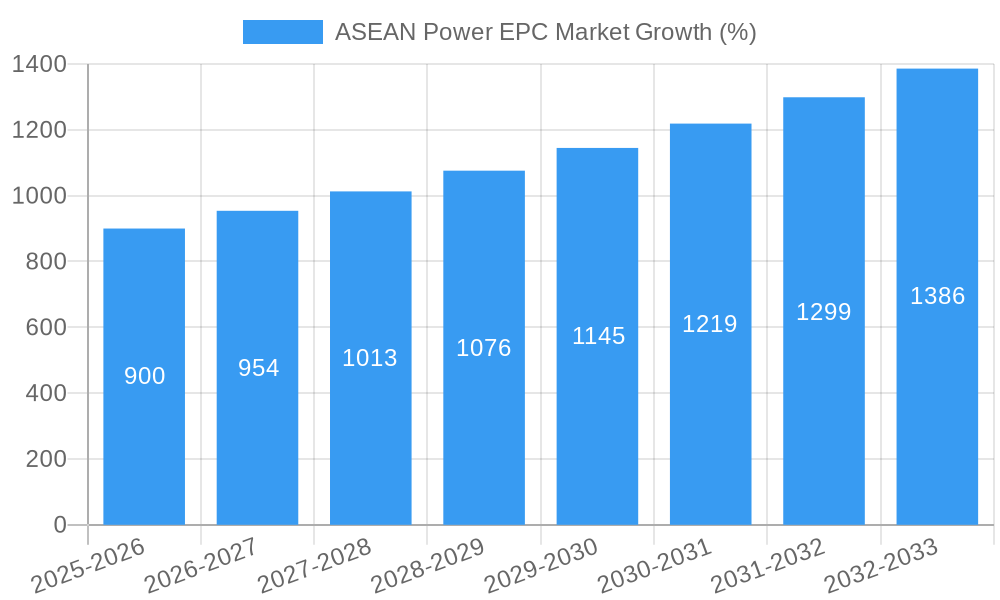
The ASEAN Power EPC (Engineering, Procurement, and Construction) market is experiencing robust growth, driven by increasing energy demand fueled by rapid economic development and urbanization across the region. A CAGR exceeding 6% from 2019-2033 signifies a significant expansion. Key drivers include rising investments in renewable energy sources, particularly solar and wind power, to meet sustainability goals and diversify energy portfolios. Government initiatives promoting energy independence and infrastructure development further propel market growth. While the conventional thermal power segment remains substantial, renewables are rapidly gaining market share, attracting significant investment from both domestic and international players. The market is segmented by power generation type (conventional thermal, renewables, and nuclear), with renewables showing the most dynamic growth trajectory. Major players like Hyundai Engineering, JGC Holdings, and Sumitomo Corporation are leveraging their expertise and regional presence to capitalize on these opportunities. However, challenges such as regulatory hurdles, grid infrastructure limitations, and fluctuating energy prices pose some constraints. The market’s future hinges on successful policy implementation, technological advancements, and sustained economic growth within the ASEAN region. Indonesia, the Philippines, Vietnam, and Singapore are emerging as key markets within ASEAN, owing to their substantial energy needs and favorable investment climates.
The ASEAN Power EPC market's projected growth necessitates a strategic approach by EPC companies. Successful players will need to adapt to evolving technological landscapes, focusing on renewable energy solutions and optimizing project management for efficiency. The increasing complexity of energy projects also demands robust partnerships and collaborations to navigate regulatory frameworks and manage risk. Furthermore, the growing emphasis on sustainability and environmental considerations requires EPC firms to prioritize green technologies and environmentally responsible practices. The development of robust grid infrastructure will be crucial to facilitate the integration of renewable energy sources and unlock the full potential of the ASEAN Power EPC market. Competition is expected to intensify as both regional and global players vie for market share. A strong focus on innovation, cost-effectiveness, and project execution excellence will be pivotal for success in this dynamic and expanding sector.
ASEAN Power EPC Market: A Comprehensive Report (2019-2033)
This comprehensive report provides an in-depth analysis of the ASEAN Power Engineering, Procurement, and Construction (EPC) market from 2019 to 2033. It delves into market dynamics, industry trends, leading players, and future growth opportunities, offering invaluable insights for stakeholders across the power sector. With a focus on key segments – Conventional Thermal Power, Renewables Power, and Nuclear Power – and incorporating data from major players like Hyundai Engineering, JGC Holdings, and Sumitomo Corporation, this report is essential for strategic decision-making. The market is projected to reach xx Million by 2033, growing at a CAGR of xx% during the forecast period (2025-2033).
ASEAN Power EPC Market Dynamics & Concentration
The ASEAN Power EPC market exhibits a moderately concentrated landscape, with several multinational corporations and regional players vying for market share. Market concentration is influenced by factors such as project size, technological expertise, and financial capacity. Larger projects often attract multinational EPC contractors due to their extensive experience and financial resources.
- Market Share: The top five players collectively hold approximately xx% of the market share in 2025, with Hyundai Engineering Co Ltd. estimated to hold xx%, followed by JGC Holdings Corporation at xx%, Sumitomo Corporation at xx%, Trung Nam Group at xx%, and Toshiba Corporation at xx%. This concentration is expected to shift slightly over the forecast period.
- Innovation Drivers: The increasing demand for cleaner energy sources drives innovation in renewable energy EPC projects, pushing companies to adopt advanced technologies and optimize construction methodologies. This includes the integration of smart grids, energy storage systems, and digitalization initiatives.
- Regulatory Frameworks: Government policies and regulations across ASEAN nations significantly impact the market. Policies promoting renewable energy adoption, streamlining permitting processes, and fostering private sector participation create favorable market conditions. Conversely, inconsistent regulatory frameworks across different countries can pose challenges.
- Product Substitutes: The availability of alternative power generation technologies and solutions (such as distributed generation and microgrids) influences the EPC market. The increasing affordability and efficiency of distributed generation technologies can pose some competitive pressure to large-scale EPC projects.
- End-User Trends: The increasing electricity demand driven by rapid economic growth and rising living standards across ASEAN is a key factor driving market growth. This is particularly true for industrial and commercial sectors. Growing urbanization further fuels the demand for power infrastructure development.
- M&A Activities: The number of mergers and acquisitions (M&A) deals in the ASEAN Power EPC sector has shown an increasing trend in recent years, with xx deals recorded between 2019 and 2024. These activities are mainly driven by companies seeking to expand their market reach, acquire specialized technologies, and enhance their project execution capabilities.
ASEAN Power EPC Market Industry Trends & Analysis
The ASEAN Power EPC market is characterized by robust growth driven by several factors. The region’s expanding economies, rising energy consumption, and government initiatives promoting renewable energy development contribute significantly to market expansion. The market is witnessing a significant shift towards renewable energy sources, with solar, wind, and hydropower projects gaining traction. Technological advancements like AI and automation are optimizing EPC processes, leading to increased efficiency and cost savings.
- Market Growth Drivers: The substantial rise in electricity demand, driven by economic growth and population increase, coupled with increasing government investments in power generation infrastructure across ASEAN are primary growth drivers. Furthermore, favorable government policies and incentives promoting renewable energy adoption are significantly stimulating market growth.
- Technological Disruptions: The integration of digital technologies, such as building information modeling (BIM), drones for site surveillance, and AI for project optimization is transforming the industry. This leads to increased efficiency, reduced costs, and improved project management.
- Consumer Preferences: End-users, both industrial and residential, are showing a growing preference for renewable energy sources due to environmental concerns and the decreasing cost of renewable energy technologies. This shifts demand towards renewable EPC projects.
- Competitive Dynamics: The market is characterized by intense competition among international and regional EPC contractors. Competition centers around pricing, project execution capabilities, technical expertise, and the ability to secure projects.
Leading Markets & Segments in ASEAN Power EPC Market
Indonesia and Vietnam currently lead the ASEAN Power EPC market in terms of project volume and investment. The conventional thermal power segment still holds a substantial market share, but the renewable energy segment is experiencing rapid growth, driven primarily by government support and declining renewable energy technology costs. The nuclear power segment is relatively nascent in ASEAN, with limited projects underway.
- Key Drivers for Indonesia: Indonesia’s large and growing energy demand, coupled with substantial government investments in power infrastructure development, positions it as a leading market. Government initiatives to promote renewable energy also contribute to the market growth.
- Key Drivers for Vietnam: Rapid economic growth and industrialization in Vietnam fuel the demand for electricity, driving the development of new power plants. Government focus on diversifying energy sources, including renewable energy, is shaping the market landscape.
- Segment Dominance: Conventional Thermal Power continues to dominate the market owing to its established infrastructure and cost-effectiveness. However, Renewable Power is experiencing exponential growth driven by decreasing technology costs, supportive government policies, and environmental concerns. The Nuclear Power segment, although developing, remains comparatively small.
ASEAN Power EPC Market Product Developments
Recent product developments focus on enhancing project efficiency, minimizing environmental impact, and incorporating digital technologies. Modular construction techniques, prefabricated components, and 3D printing are gaining traction, improving construction speed and reducing costs. The integration of smart grid technologies and energy storage solutions enhances grid stability and reliability.
Key Drivers of ASEAN Power EPC Market Growth
Several key factors contribute to the market's growth trajectory. First, substantial government investments in power infrastructure development across various ASEAN nations stimulate market expansion. Second, the growing demand for electricity, driven by economic growth and increasing urbanization, creates a significant need for power generation and transmission projects. Third, the falling cost of renewable energy technologies makes renewable projects increasingly attractive, boosting market growth.
Challenges in the ASEAN Power EPC Market
The ASEAN Power EPC market faces various challenges. Regulatory inconsistencies across different ASEAN countries, often leading to project delays and increased complexity, represent a significant hurdle. Supply chain disruptions, especially in the procurement of critical equipment and materials, can also impact project timelines and budgets. Furthermore, intense competition among EPC contractors, characterized by fluctuating pricing and aggressive bidding, pressures profit margins.
Emerging Opportunities in ASEAN Power EPC Market
The ASEAN Power EPC market presents numerous long-term growth opportunities. The increasing adoption of renewable energy technologies, particularly solar and wind power, creates significant project opportunities. The development of smart grids and energy storage solutions offers substantial growth potential. Strategic partnerships between international and local EPC contractors can facilitate the execution of large-scale projects and enhance market penetration. Government initiatives promoting energy efficiency and the development of regional power grids further amplify growth opportunities.
Leading Players in the ASEAN Power EPC Market Sector
- Hyundai Engineering Co Ltd
- JGC Holdings Corporation
- Sumitomo Corporation
- Trung Nam Group
- Toshiba Corporation
- Doosan Heavy Industries & Construction Co Ltd
- Indika Energy
- Kawasaki Heavy Industries Ltd
- IHI Corporation
- Mitsubishi Heavy Industries Ltd
Key Milestones in ASEAN Power EPC Market Industry
- December 2021: Solar Philippines Nueva Ecija Corporation (SPNEC) commences construction of a 500 MW solar PV facility in the Philippines.
- October 2021: Mitsubishi Power commissions a 500 MW natural gas turbine at Indonesia's Muara Karang Power Plant.
- March 2022: San Miguel Corp. (SMC) plans to build two gas-fired power stations in the central Philippines, totaling 60 billion Pesos (USD 1.14 billion) in investment.
Strategic Outlook for ASEAN Power EPC Market Market
The ASEAN Power EPC market is poised for significant growth over the next decade, driven by increasing energy demand, government support for renewable energy, and technological advancements. Strategic partnerships, technological innovation, and a focus on sustainable development will be crucial for success in this dynamic market. Companies that can effectively navigate regulatory complexities, manage supply chain risks, and adapt to evolving market trends will be best positioned to capitalize on future opportunities.
ASEAN Power EPC Market Segmentation
-
1. Source
- 1.1. Conventional Thermal Power
- 1.2. Renewables Power
- 1.3. Nuclear Power
-
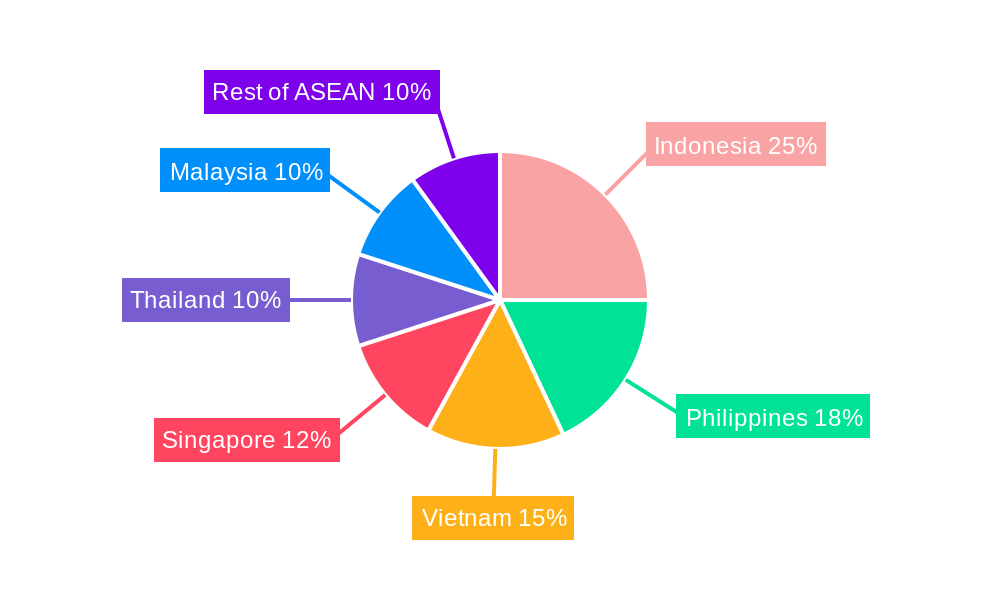
2. Geography
- 2.1. Indonesia
- 2.2. Thailand
- 2.3. Malaysia
- 2.4. Vietnam
- 2.5. Philippines
- 2.6. Rest of the ASEAN Countries
ASEAN Power EPC Market Segmentation By Geography
- 1. Indonesia
- 2. Thailand
- 3. Malaysia
- 4. Vietnam
- 5. Philippines
- 6. Rest of the ASEAN Countries
ASEAN Power EPC Market REPORT HIGHLIGHTS
| Aspects | Details |
|---|---|
| Study Period | 2019-2033 |
| Base Year | 2024 |
| Estimated Year | 2025 |
| Forecast Period | 2025-2033 |
| Historical Period | 2019-2024 |
| Growth Rate | CAGR of > 6.00% from 2019-2033 |
| Segmentation |
|
Table of Contents
- 1. Introduction
- 1.1. Research Scope
- 1.2. Market Segmentation
- 1.3. Research Methodology
- 1.4. Definitions and Assumptions
- 2. Executive Summary
- 2.1. Introduction
- 3. Market Dynamics
- 3.1. Introduction
- 3.2. Market Drivers
- 3.2.1. 4.; Uninterrupted and Reliable Power Supply and Heavy Deployment of DG (diesel generator) Set4.; Improvement in Technology of Diesel Generator
- 3.3. Market Restrains
- 3.3.1. 4.; The Growing Trend of Renewable Power Generation
- 3.4. Market Trends
- 3.4.1. Renewables Power Source to Witness Significant Growth
- 4. Market Factor Analysis
- 4.1. Porters Five Forces
- 4.2. Supply/Value Chain
- 4.3. PESTEL analysis
- 4.4. Market Entropy
- 4.5. Patent/Trademark Analysis
- 5. Global ASEAN Power EPC Market Analysis, Insights and Forecast, 2019-2031
- 5.1. Market Analysis, Insights and Forecast - by Source
- 5.1.1. Conventional Thermal Power
- 5.1.2. Renewables Power
- 5.1.3. Nuclear Power
- 5.2. Market Analysis, Insights and Forecast - by Geography
- 5.2.1. Indonesia
- 5.2.2. Thailand
- 5.2.3. Malaysia
- 5.2.4. Vietnam
- 5.2.5. Philippines
- 5.2.6. Rest of the ASEAN Countries
- 5.3. Market Analysis, Insights and Forecast - by Region
- 5.3.1. Indonesia
- 5.3.2. Thailand
- 5.3.3. Malaysia
- 5.3.4. Vietnam
- 5.3.5. Philippines
- 5.3.6. Rest of the ASEAN Countries
- 5.1. Market Analysis, Insights and Forecast - by Source
- 6. Indonesia ASEAN Power EPC Market Analysis, Insights and Forecast, 2019-2031
- 6.1. Market Analysis, Insights and Forecast - by Source
- 6.1.1. Conventional Thermal Power
- 6.1.2. Renewables Power
- 6.1.3. Nuclear Power
- 6.2. Market Analysis, Insights and Forecast - by Geography
- 6.2.1. Indonesia
- 6.2.2. Thailand
- 6.2.3. Malaysia
- 6.2.4. Vietnam
- 6.2.5. Philippines
- 6.2.6. Rest of the ASEAN Countries
- 6.1. Market Analysis, Insights and Forecast - by Source
- 7. Thailand ASEAN Power EPC Market Analysis, Insights and Forecast, 2019-2031
- 7.1. Market Analysis, Insights and Forecast - by Source
- 7.1.1. Conventional Thermal Power
- 7.1.2. Renewables Power
- 7.1.3. Nuclear Power
- 7.2. Market Analysis, Insights and Forecast - by Geography
- 7.2.1. Indonesia
- 7.2.2. Thailand
- 7.2.3. Malaysia
- 7.2.4. Vietnam
- 7.2.5. Philippines
- 7.2.6. Rest of the ASEAN Countries
- 7.1. Market Analysis, Insights and Forecast - by Source
- 8. Malaysia ASEAN Power EPC Market Analysis, Insights and Forecast, 2019-2031
- 8.1. Market Analysis, Insights and Forecast - by Source
- 8.1.1. Conventional Thermal Power
- 8.1.2. Renewables Power
- 8.1.3. Nuclear Power
- 8.2. Market Analysis, Insights and Forecast - by Geography
- 8.2.1. Indonesia
- 8.2.2. Thailand
- 8.2.3. Malaysia
- 8.2.4. Vietnam
- 8.2.5. Philippines
- 8.2.6. Rest of the ASEAN Countries
- 8.1. Market Analysis, Insights and Forecast - by Source
- 9. Vietnam ASEAN Power EPC Market Analysis, Insights and Forecast, 2019-2031
- 9.1. Market Analysis, Insights and Forecast - by Source
- 9.1.1. Conventional Thermal Power
- 9.1.2. Renewables Power
- 9.1.3. Nuclear Power
- 9.2. Market Analysis, Insights and Forecast - by Geography
- 9.2.1. Indonesia
- 9.2.2. Thailand
- 9.2.3. Malaysia
- 9.2.4. Vietnam
- 9.2.5. Philippines
- 9.2.6. Rest of the ASEAN Countries
- 9.1. Market Analysis, Insights and Forecast - by Source
- 10. Philippines ASEAN Power EPC Market Analysis, Insights and Forecast, 2019-2031
- 10.1. Market Analysis, Insights and Forecast - by Source
- 10.1.1. Conventional Thermal Power
- 10.1.2. Renewables Power
- 10.1.3. Nuclear Power
- 10.2. Market Analysis, Insights and Forecast - by Geography
- 10.2.1. Indonesia
- 10.2.2. Thailand
- 10.2.3. Malaysia
- 10.2.4. Vietnam
- 10.2.5. Philippines
- 10.2.6. Rest of the ASEAN Countries
- 10.1. Market Analysis, Insights and Forecast - by Source
- 11. Rest of the ASEAN Countries ASEAN Power EPC Market Analysis, Insights and Forecast, 2019-2031
- 11.1. Market Analysis, Insights and Forecast - by Source
- 11.1.1. Conventional Thermal Power
- 11.1.2. Renewables Power
- 11.1.3. Nuclear Power
- 11.2. Market Analysis, Insights and Forecast - by Geography
- 11.2.1. Indonesia
- 11.2.2. Thailand
- 11.2.3. Malaysia
- 11.2.4. Vietnam
- 11.2.5. Philippines
- 11.2.6. Rest of the ASEAN Countries
- 11.1. Market Analysis, Insights and Forecast - by Source
- 12. North America ASEAN Power EPC Market Analysis, Insights and Forecast, 2019-2031
- 12.1. Market Analysis, Insights and Forecast - By Country/Sub-region
- 12.1.1 United States
- 12.1.2 Canada
- 12.1.3 Mexico
- 13. Europe ASEAN Power EPC Market Analysis, Insights and Forecast, 2019-2031
- 13.1. Market Analysis, Insights and Forecast - By Country/Sub-region
- 13.1.1 Germany
- 13.1.2 United Kingdom
- 13.1.3 France
- 13.1.4 Spain
- 13.1.5 Italy
- 13.1.6 Spain
- 13.1.7 Belgium
- 13.1.8 Netherland
- 13.1.9 Nordics
- 13.1.10 Rest of Europe
- 14. Asia Pacific ASEAN Power EPC Market Analysis, Insights and Forecast, 2019-2031
- 14.1. Market Analysis, Insights and Forecast - By Country/Sub-region
- 14.1.1 China
- 14.1.2 Japan
- 14.1.3 India
- 14.1.4 South Korea
- 14.1.5 Southeast Asia
- 14.1.6 Australia
- 14.1.7 Indonesia
- 14.1.8 Phillipes
- 14.1.9 Singapore
- 14.1.10 Thailandc
- 14.1.11 Rest of Asia Pacific
- 15. South America ASEAN Power EPC Market Analysis, Insights and Forecast, 2019-2031
- 15.1. Market Analysis, Insights and Forecast - By Country/Sub-region
- 15.1.1 Brazil
- 15.1.2 Argentina
- 15.1.3 Peru
- 15.1.4 Chile
- 15.1.5 Colombia
- 15.1.6 Ecuador
- 15.1.7 Venezuela
- 15.1.8 Rest of South America
- 16. MEA ASEAN Power EPC Market Analysis, Insights and Forecast, 2019-2031
- 16.1. Market Analysis, Insights and Forecast - By Country/Sub-region
- 16.1.1 United Arab Emirates
- 16.1.2 Saudi Arabia
- 16.1.3 South Africa
- 16.1.4 Rest of Middle East and Africa
- 17. Competitive Analysis
- 17.1. Global Market Share Analysis 2024
- 17.2. Company Profiles
- 17.2.1 Hyundai Engineering Co Ltd
- 17.2.1.1. Overview
- 17.2.1.2. Products
- 17.2.1.3. SWOT Analysis
- 17.2.1.4. Recent Developments
- 17.2.1.5. Financials (Based on Availability)
- 17.2.2 JGC Holdings Corporation
- 17.2.2.1. Overview
- 17.2.2.2. Products
- 17.2.2.3. SWOT Analysis
- 17.2.2.4. Recent Developments
- 17.2.2.5. Financials (Based on Availability)
- 17.2.3 Sumitomo Corporation
- 17.2.3.1. Overview
- 17.2.3.2. Products
- 17.2.3.3. SWOT Analysis
- 17.2.3.4. Recent Developments
- 17.2.3.5. Financials (Based on Availability)
- 17.2.4 Trung Nam Group
- 17.2.4.1. Overview
- 17.2.4.2. Products
- 17.2.4.3. SWOT Analysis
- 17.2.4.4. Recent Developments
- 17.2.4.5. Financials (Based on Availability)
- 17.2.5 Toshiba Corporation
- 17.2.5.1. Overview
- 17.2.5.2. Products
- 17.2.5.3. SWOT Analysis
- 17.2.5.4. Recent Developments
- 17.2.5.5. Financials (Based on Availability)
- 17.2.6 Doosan Heavy Industries & Construction Co Ltd
- 17.2.6.1. Overview
- 17.2.6.2. Products
- 17.2.6.3. SWOT Analysis
- 17.2.6.4. Recent Developments
- 17.2.6.5. Financials (Based on Availability)
- 17.2.7 Indika Energy
- 17.2.7.1. Overview
- 17.2.7.2. Products
- 17.2.7.3. SWOT Analysis
- 17.2.7.4. Recent Developments
- 17.2.7.5. Financials (Based on Availability)
- 17.2.8 Kawasaki Heavy Industries Ltd
- 17.2.8.1. Overview
- 17.2.8.2. Products
- 17.2.8.3. SWOT Analysis
- 17.2.8.4. Recent Developments
- 17.2.8.5. Financials (Based on Availability)
- 17.2.9 IHI Corporation
- 17.2.9.1. Overview
- 17.2.9.2. Products
- 17.2.9.3. SWOT Analysis
- 17.2.9.4. Recent Developments
- 17.2.9.5. Financials (Based on Availability)
- 17.2.10 Mitsubishi Heavy Industries Ltd
- 17.2.10.1. Overview
- 17.2.10.2. Products
- 17.2.10.3. SWOT Analysis
- 17.2.10.4. Recent Developments
- 17.2.10.5. Financials (Based on Availability)
- 17.2.1 Hyundai Engineering Co Ltd
List of Figures
- Figure 1: Global ASEAN Power EPC Market Revenue Breakdown (Million, %) by Region 2024 & 2032
- Figure 2: North America ASEAN Power EPC Market Revenue (Million), by Country 2024 & 2032
- Figure 3: North America ASEAN Power EPC Market Revenue Share (%), by Country 2024 & 2032
- Figure 4: Europe ASEAN Power EPC Market Revenue (Million), by Country 2024 & 2032
- Figure 5: Europe ASEAN Power EPC Market Revenue Share (%), by Country 2024 & 2032
- Figure 6: Asia Pacific ASEAN Power EPC Market Revenue (Million), by Country 2024 & 2032
- Figure 7: Asia Pacific ASEAN Power EPC Market Revenue Share (%), by Country 2024 & 2032
- Figure 8: South America ASEAN Power EPC Market Revenue (Million), by Country 2024 & 2032
- Figure 9: South America ASEAN Power EPC Market Revenue Share (%), by Country 2024 & 2032
- Figure 10: MEA ASEAN Power EPC Market Revenue (Million), by Country 2024 & 2032
- Figure 11: MEA ASEAN Power EPC Market Revenue Share (%), by Country 2024 & 2032
- Figure 12: Indonesia ASEAN Power EPC Market Revenue (Million), by Source 2024 & 2032
- Figure 13: Indonesia ASEAN Power EPC Market Revenue Share (%), by Source 2024 & 2032
- Figure 14: Indonesia ASEAN Power EPC Market Revenue (Million), by Geography 2024 & 2032
- Figure 15: Indonesia ASEAN Power EPC Market Revenue Share (%), by Geography 2024 & 2032
- Figure 16: Indonesia ASEAN Power EPC Market Revenue (Million), by Country 2024 & 2032
- Figure 17: Indonesia ASEAN Power EPC Market Revenue Share (%), by Country 2024 & 2032
- Figure 18: Thailand ASEAN Power EPC Market Revenue (Million), by Source 2024 & 2032
- Figure 19: Thailand ASEAN Power EPC Market Revenue Share (%), by Source 2024 & 2032
- Figure 20: Thailand ASEAN Power EPC Market Revenue (Million), by Geography 2024 & 2032
- Figure 21: Thailand ASEAN Power EPC Market Revenue Share (%), by Geography 2024 & 2032
- Figure 22: Thailand ASEAN Power EPC Market Revenue (Million), by Country 2024 & 2032
- Figure 23: Thailand ASEAN Power EPC Market Revenue Share (%), by Country 2024 & 2032
- Figure 24: Malaysia ASEAN Power EPC Market Revenue (Million), by Source 2024 & 2032
- Figure 25: Malaysia ASEAN Power EPC Market Revenue Share (%), by Source 2024 & 2032
- Figure 26: Malaysia ASEAN Power EPC Market Revenue (Million), by Geography 2024 & 2032
- Figure 27: Malaysia ASEAN Power EPC Market Revenue Share (%), by Geography 2024 & 2032
- Figure 28: Malaysia ASEAN Power EPC Market Revenue (Million), by Country 2024 & 2032
- Figure 29: Malaysia ASEAN Power EPC Market Revenue Share (%), by Country 2024 & 2032
- Figure 30: Vietnam ASEAN Power EPC Market Revenue (Million), by Source 2024 & 2032
- Figure 31: Vietnam ASEAN Power EPC Market Revenue Share (%), by Source 2024 & 2032
- Figure 32: Vietnam ASEAN Power EPC Market Revenue (Million), by Geography 2024 & 2032
- Figure 33: Vietnam ASEAN Power EPC Market Revenue Share (%), by Geography 2024 & 2032
- Figure 34: Vietnam ASEAN Power EPC Market Revenue (Million), by Country 2024 & 2032
- Figure 35: Vietnam ASEAN Power EPC Market Revenue Share (%), by Country 2024 & 2032
- Figure 36: Philippines ASEAN Power EPC Market Revenue (Million), by Source 2024 & 2032
- Figure 37: Philippines ASEAN Power EPC Market Revenue Share (%), by Source 2024 & 2032
- Figure 38: Philippines ASEAN Power EPC Market Revenue (Million), by Geography 2024 & 2032
- Figure 39: Philippines ASEAN Power EPC Market Revenue Share (%), by Geography 2024 & 2032
- Figure 40: Philippines ASEAN Power EPC Market Revenue (Million), by Country 2024 & 2032
- Figure 41: Philippines ASEAN Power EPC Market Revenue Share (%), by Country 2024 & 2032
- Figure 42: Rest of the ASEAN Countries ASEAN Power EPC Market Revenue (Million), by Source 2024 & 2032
- Figure 43: Rest of the ASEAN Countries ASEAN Power EPC Market Revenue Share (%), by Source 2024 & 2032
- Figure 44: Rest of the ASEAN Countries ASEAN Power EPC Market Revenue (Million), by Geography 2024 & 2032
- Figure 45: Rest of the ASEAN Countries ASEAN Power EPC Market Revenue Share (%), by Geography 2024 & 2032
- Figure 46: Rest of the ASEAN Countries ASEAN Power EPC Market Revenue (Million), by Country 2024 & 2032
- Figure 47: Rest of the ASEAN Countries ASEAN Power EPC Market Revenue Share (%), by Country 2024 & 2032
List of Tables
- Table 1: Global ASEAN Power EPC Market Revenue Million Forecast, by Region 2019 & 2032
- Table 2: Global ASEAN Power EPC Market Revenue Million Forecast, by Source 2019 & 2032
- Table 3: Global ASEAN Power EPC Market Revenue Million Forecast, by Geography 2019 & 2032
- Table 4: Global ASEAN Power EPC Market Revenue Million Forecast, by Region 2019 & 2032
- Table 5: Global ASEAN Power EPC Market Revenue Million Forecast, by Country 2019 & 2032
- Table 6: United States ASEAN Power EPC Market Revenue (Million) Forecast, by Application 2019 & 2032
- Table 7: Canada ASEAN Power EPC Market Revenue (Million) Forecast, by Application 2019 & 2032
- Table 8: Mexico ASEAN Power EPC Market Revenue (Million) Forecast, by Application 2019 & 2032
- Table 9: Global ASEAN Power EPC Market Revenue Million Forecast, by Country 2019 & 2032
- Table 10: Germany ASEAN Power EPC Market Revenue (Million) Forecast, by Application 2019 & 2032
- Table 11: United Kingdom ASEAN Power EPC Market Revenue (Million) Forecast, by Application 2019 & 2032
- Table 12: France ASEAN Power EPC Market Revenue (Million) Forecast, by Application 2019 & 2032
- Table 13: Spain ASEAN Power EPC Market Revenue (Million) Forecast, by Application 2019 & 2032
- Table 14: Italy ASEAN Power EPC Market Revenue (Million) Forecast, by Application 2019 & 2032
- Table 15: Spain ASEAN Power EPC Market Revenue (Million) Forecast, by Application 2019 & 2032
- Table 16: Belgium ASEAN Power EPC Market Revenue (Million) Forecast, by Application 2019 & 2032
- Table 17: Netherland ASEAN Power EPC Market Revenue (Million) Forecast, by Application 2019 & 2032
- Table 18: Nordics ASEAN Power EPC Market Revenue (Million) Forecast, by Application 2019 & 2032
- Table 19: Rest of Europe ASEAN Power EPC Market Revenue (Million) Forecast, by Application 2019 & 2032
- Table 20: Global ASEAN Power EPC Market Revenue Million Forecast, by Country 2019 & 2032
- Table 21: China ASEAN Power EPC Market Revenue (Million) Forecast, by Application 2019 & 2032
- Table 22: Japan ASEAN Power EPC Market Revenue (Million) Forecast, by Application 2019 & 2032
- Table 23: India ASEAN Power EPC Market Revenue (Million) Forecast, by Application 2019 & 2032
- Table 24: South Korea ASEAN Power EPC Market Revenue (Million) Forecast, by Application 2019 & 2032
- Table 25: Southeast Asia ASEAN Power EPC Market Revenue (Million) Forecast, by Application 2019 & 2032
- Table 26: Australia ASEAN Power EPC Market Revenue (Million) Forecast, by Application 2019 & 2032
- Table 27: Indonesia ASEAN Power EPC Market Revenue (Million) Forecast, by Application 2019 & 2032
- Table 28: Phillipes ASEAN Power EPC Market Revenue (Million) Forecast, by Application 2019 & 2032
- Table 29: Singapore ASEAN Power EPC Market Revenue (Million) Forecast, by Application 2019 & 2032
- Table 30: Thailandc ASEAN Power EPC Market Revenue (Million) Forecast, by Application 2019 & 2032
- Table 31: Rest of Asia Pacific ASEAN Power EPC Market Revenue (Million) Forecast, by Application 2019 & 2032
- Table 32: Global ASEAN Power EPC Market Revenue Million Forecast, by Country 2019 & 2032
- Table 33: Brazil ASEAN Power EPC Market Revenue (Million) Forecast, by Application 2019 & 2032
- Table 34: Argentina ASEAN Power EPC Market Revenue (Million) Forecast, by Application 2019 & 2032
- Table 35: Peru ASEAN Power EPC Market Revenue (Million) Forecast, by Application 2019 & 2032
- Table 36: Chile ASEAN Power EPC Market Revenue (Million) Forecast, by Application 2019 & 2032
- Table 37: Colombia ASEAN Power EPC Market Revenue (Million) Forecast, by Application 2019 & 2032
- Table 38: Ecuador ASEAN Power EPC Market Revenue (Million) Forecast, by Application 2019 & 2032
- Table 39: Venezuela ASEAN Power EPC Market Revenue (Million) Forecast, by Application 2019 & 2032
- Table 40: Rest of South America ASEAN Power EPC Market Revenue (Million) Forecast, by Application 2019 & 2032
- Table 41: Global ASEAN Power EPC Market Revenue Million Forecast, by Country 2019 & 2032
- Table 42: United Arab Emirates ASEAN Power EPC Market Revenue (Million) Forecast, by Application 2019 & 2032
- Table 43: Saudi Arabia ASEAN Power EPC Market Revenue (Million) Forecast, by Application 2019 & 2032
- Table 44: South Africa ASEAN Power EPC Market Revenue (Million) Forecast, by Application 2019 & 2032
- Table 45: Rest of Middle East and Africa ASEAN Power EPC Market Revenue (Million) Forecast, by Application 2019 & 2032
- Table 46: Global ASEAN Power EPC Market Revenue Million Forecast, by Source 2019 & 2032
- Table 47: Global ASEAN Power EPC Market Revenue Million Forecast, by Geography 2019 & 2032
- Table 48: Global ASEAN Power EPC Market Revenue Million Forecast, by Country 2019 & 2032
- Table 49: Global ASEAN Power EPC Market Revenue Million Forecast, by Source 2019 & 2032
- Table 50: Global ASEAN Power EPC Market Revenue Million Forecast, by Geography 2019 & 2032
- Table 51: Global ASEAN Power EPC Market Revenue Million Forecast, by Country 2019 & 2032
- Table 52: Global ASEAN Power EPC Market Revenue Million Forecast, by Source 2019 & 2032
- Table 53: Global ASEAN Power EPC Market Revenue Million Forecast, by Geography 2019 & 2032
- Table 54: Global ASEAN Power EPC Market Revenue Million Forecast, by Country 2019 & 2032
- Table 55: Global ASEAN Power EPC Market Revenue Million Forecast, by Source 2019 & 2032
- Table 56: Global ASEAN Power EPC Market Revenue Million Forecast, by Geography 2019 & 2032
- Table 57: Global ASEAN Power EPC Market Revenue Million Forecast, by Country 2019 & 2032
- Table 58: Global ASEAN Power EPC Market Revenue Million Forecast, by Source 2019 & 2032
- Table 59: Global ASEAN Power EPC Market Revenue Million Forecast, by Geography 2019 & 2032
- Table 60: Global ASEAN Power EPC Market Revenue Million Forecast, by Country 2019 & 2032
- Table 61: Global ASEAN Power EPC Market Revenue Million Forecast, by Source 2019 & 2032
- Table 62: Global ASEAN Power EPC Market Revenue Million Forecast, by Geography 2019 & 2032
- Table 63: Global ASEAN Power EPC Market Revenue Million Forecast, by Country 2019 & 2032
Frequently Asked Questions
1. What is the projected Compound Annual Growth Rate (CAGR) of the ASEAN Power EPC Market?
The projected CAGR is approximately > 6.00%.
2. Which companies are prominent players in the ASEAN Power EPC Market?
Key companies in the market include Hyundai Engineering Co Ltd, JGC Holdings Corporation, Sumitomo Corporation, Trung Nam Group, Toshiba Corporation, Doosan Heavy Industries & Construction Co Ltd, Indika Energy, Kawasaki Heavy Industries Ltd, IHI Corporation, Mitsubishi Heavy Industries Ltd.
3. What are the main segments of the ASEAN Power EPC Market?
The market segments include Source, Geography.
4. Can you provide details about the market size?
The market size is estimated to be USD XX Million as of 2022.
5. What are some drivers contributing to market growth?
4.; Uninterrupted and Reliable Power Supply and Heavy Deployment of DG (diesel generator) Set4.; Improvement in Technology of Diesel Generator.
6. What are the notable trends driving market growth?
Renewables Power Source to Witness Significant Growth.
7. Are there any restraints impacting market growth?
4.; The Growing Trend of Renewable Power Generation.
8. Can you provide examples of recent developments in the market?
In December 2021, Solar Philippines Nueva Ecija Corporation (SPNEC), a major project developer based in the Philippines, started constructing the first 50 MW unit of a 500 MW solar PV facility. The first 50 MW is planned to be commissioned by the end of 2022 and the rest of the project by 2023.
9. What pricing options are available for accessing the report?
Pricing options include single-user, multi-user, and enterprise licenses priced at USD 4750, USD 5250, and USD 8750 respectively.
10. Is the market size provided in terms of value or volume?
The market size is provided in terms of value, measured in Million.
11. Are there any specific market keywords associated with the report?
Yes, the market keyword associated with the report is "ASEAN Power EPC Market," which aids in identifying and referencing the specific market segment covered.
12. How do I determine which pricing option suits my needs best?
The pricing options vary based on user requirements and access needs. Individual users may opt for single-user licenses, while businesses requiring broader access may choose multi-user or enterprise licenses for cost-effective access to the report.
13. Are there any additional resources or data provided in the ASEAN Power EPC Market report?
While the report offers comprehensive insights, it's advisable to review the specific contents or supplementary materials provided to ascertain if additional resources or data are available.
14. How can I stay updated on further developments or reports in the ASEAN Power EPC Market?
To stay informed about further developments, trends, and reports in the ASEAN Power EPC Market, consider subscribing to industry newsletters, following relevant companies and organizations, or regularly checking reputable industry news sources and publications.
Methodology
Step 1 - Identification of Relevant Samples Size from Population Database


Step 2 - Approaches for Defining Global Market Size (Value, Volume* & Price*)

Note*: In applicable scenarios
Step 3 - Data Sources
Primary Research
- Web Analytics
- Survey Reports
- Research Institute
- Latest Research Reports
- Opinion Leaders
Secondary Research
- Annual Reports
- White Paper
- Latest Press Release
- Industry Association
- Paid Database
- Investor Presentations

Step 4 - Data Triangulation
Involves using different sources of information in order to increase the validity of a study
These sources are likely to be stakeholders in a program - participants, other researchers, program staff, other community members, and so on.
Then we put all data in single framework & apply various statistical tools to find out the dynamic on the market.
During the analysis stage, feedback from the stakeholder groups would be compared to determine areas of agreement as well as areas of divergence
