

Key Insights
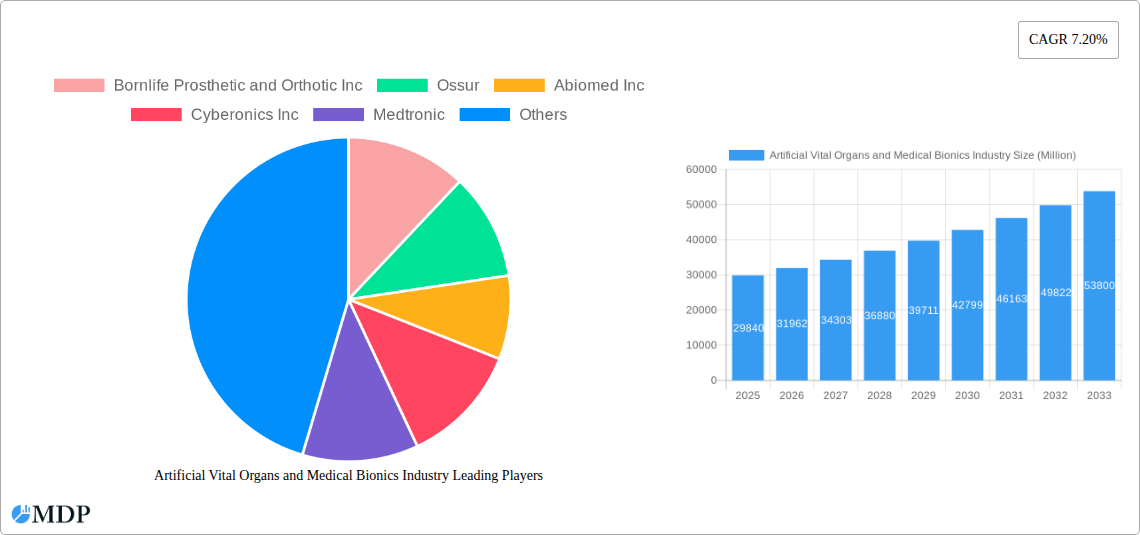
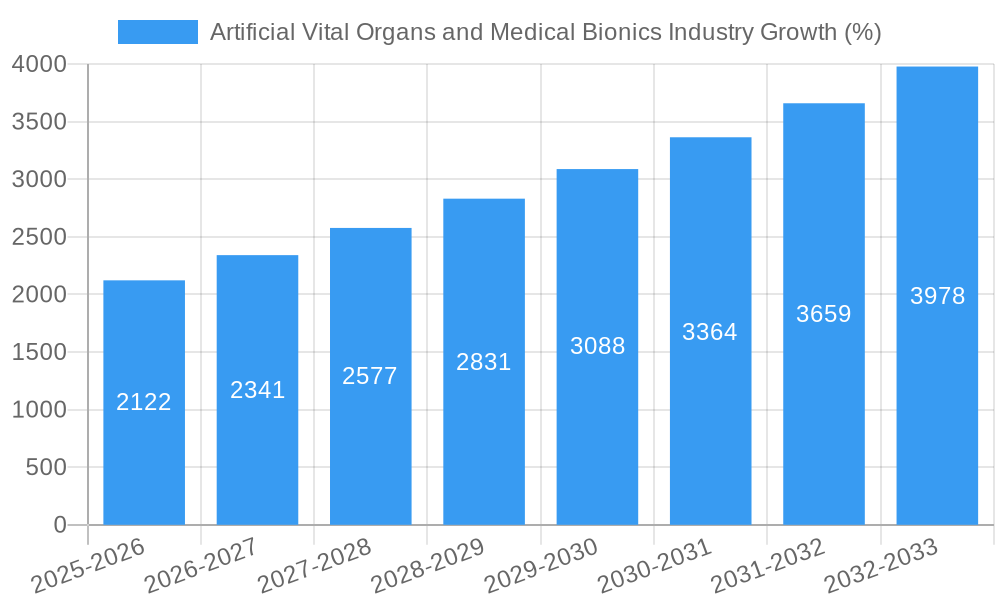
The global artificial vital organs and medical bionics market is experiencing robust growth, projected to reach \$29.84 billion in 2025 and maintain a Compound Annual Growth Rate (CAGR) of 7.20% from 2025 to 2033. This expansion is driven by several key factors. Increasing prevalence of chronic diseases like heart failure and kidney disease necessitates advanced treatment options, fueling demand for artificial organs. Simultaneously, advancements in biomaterials, miniaturization technology, and surgical techniques are enabling the development of more effective and less invasive bionics. The rising geriatric population, coupled with a growing awareness of the benefits of improved quality of life through bionics, further contributes to market growth. Technological innovations, such as the development of biocompatible materials and AI-driven control systems for prosthetic limbs and implants, are key drivers. Regulatory approvals for novel devices and increasing healthcare spending in developed and emerging economies also positively impact market expansion. However, high costs associated with these advanced technologies, ethical concerns surrounding their use, and the potential for complications remain as restraints.
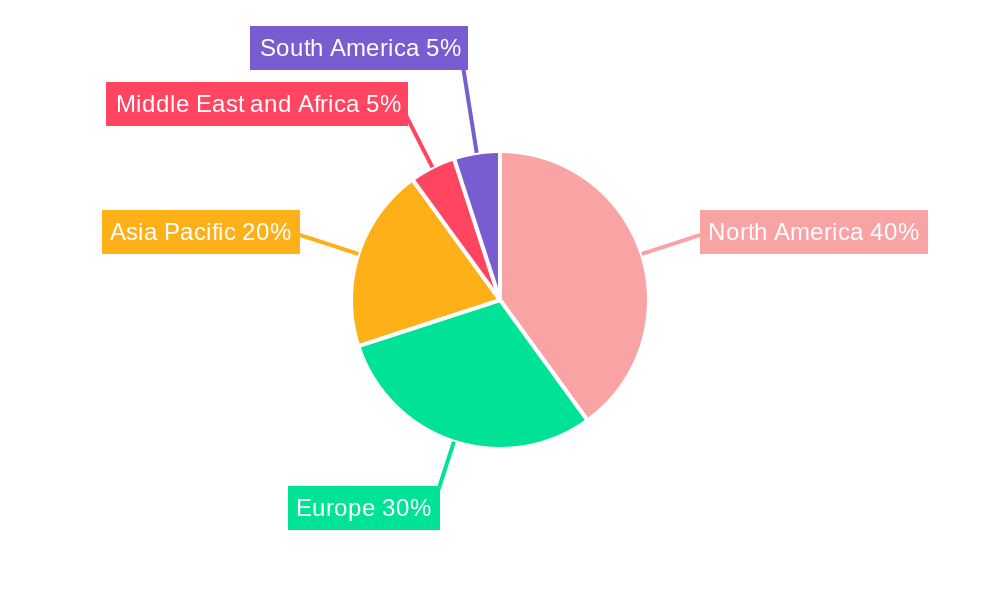
The market segmentation reveals a significant share held by artificial organs, particularly artificial hearts, kidneys, and livers, reflecting the considerable need for organ replacement therapies. Within the bionics segment, exoskeletons and bionic limbs demonstrate strong growth potential, driven by the increasing demand for rehabilitation and mobility solutions. North America currently dominates the market due to advanced healthcare infrastructure and high adoption rates of innovative medical technologies. However, Asia-Pacific is expected to witness significant growth in the coming years, fueled by rising healthcare expenditure and a growing population. Key players, including Medtronic, Abiomed, and Ossur, are actively engaged in research and development, expanding their product portfolios, and collaborating to drive further innovation and market penetration. Future growth will be shaped by continued technological advancements, strategic partnerships, and the increasing focus on personalized medicine tailored to individual patient needs.
Artificial Vital Organs and Medical Bionics Industry: A Comprehensive Market Report (2019-2033)
This comprehensive report provides an in-depth analysis of the Artificial Vital Organs and Medical Bionics industry, encompassing market dynamics, leading players, technological advancements, and future growth prospects. The study period covers 2019-2033, with a base year of 2025 and a forecast period of 2025-2033. This report is essential for industry stakeholders, investors, and researchers seeking a complete understanding of this rapidly evolving sector. Expect detailed insights, actionable data, and strategic recommendations to navigate the complexities of this multi-billion dollar market.
Artificial Vital Organs and Medical Bionics Industry Market Dynamics & Concentration
The global artificial vital organs and medical bionics market is experiencing significant growth, driven by technological advancements, an aging population, and rising prevalence of chronic diseases. Market concentration is moderate, with several key players holding substantial market share, but also featuring numerous smaller, specialized companies. The market is characterized by intense competition, leading to frequent product innovations and mergers & acquisitions (M&A) activities.
Market Concentration Metrics (Estimated 2025):
- Top 5 players hold approximately xx% of the market share.
- The overall market is fragmented, with numerous smaller players specializing in niche segments.
- M&A deal count in the last 5 years: approximately xx deals.
Key Dynamics:
- Innovation Drivers: Continuous R&D in biomaterials, miniaturization, and AI-powered control systems are driving product improvements and expanding applications.
- Regulatory Frameworks: Stringent regulatory approvals and safety standards influence market entry and product development. Variations in regulatory landscapes across different regions impact market dynamics.
- Product Substitutes: Traditional treatment methods and alternative therapies pose competitive pressures. However, the unique benefits of artificial organs and bionics often provide a compelling advantage.
- End-User Trends: Increasing demand for minimally invasive procedures, improved patient outcomes, and enhanced quality of life are major growth drivers.
- M&A Activities: Strategic acquisitions and partnerships are reshaping the competitive landscape, accelerating innovation, and expanding market reach.
Artificial Vital Organs and Medical Bionics Industry Industry Trends & Analysis
The artificial vital organs and medical bionics market exhibits robust growth, projected at a Compound Annual Growth Rate (CAGR) of xx% during the forecast period (2025-2033). This growth is fueled by several key factors:
- Technological Disruptions: Advancements in nanotechnology, 3D printing, and bioprinting are revolutionizing the design and manufacturing of artificial organs and bionic devices. The integration of AI and machine learning is enhancing device functionality and personalization.
- Market Growth Drivers: Rising prevalence of chronic diseases like heart failure, kidney failure, and diabetes; increasing geriatric population; and growing demand for improved healthcare outcomes are key market drivers. The rising disposable incomes in developing economies also contributes to market expansion.
- Consumer Preferences: Patients increasingly prefer minimally invasive procedures, improved cosmetic outcomes, and enhanced functionality. These preferences are driving innovation and shaping product development.
- Competitive Dynamics: The market is characterized by both intense competition among established players and the emergence of innovative startups. This dynamic environment promotes continuous innovation and drives down costs.
- Market Penetration: The market penetration of artificial organs and bionics varies significantly across different segments and geographies. The highest penetration is observed in developed countries with advanced healthcare infrastructure and higher adoption rates.
Leading Markets & Segments in Artificial Vital Organs and Medical Bionics Industry
The North American market currently dominates the global artificial vital organs and medical bionics industry, owing to factors such as advanced healthcare infrastructure, high adoption rates, and significant R&D investment. However, Asia-Pacific is expected to experience the fastest growth rate in the coming years due to rising healthcare expenditure and increasing prevalence of chronic diseases.
Key Drivers by Segment:
Artificial Organs:
- Artificial Heart: High prevalence of heart failure, technological advancements in biomaterials and implant technologies.
- Artificial Kidney: Growing incidence of chronic kidney disease, limitations of dialysis, and government initiatives to improve kidney care (e.g., USD 10.5 Million Kidney Innovation Accelerator prize).
- Artificial Liver: High unmet medical need, ongoing research to improve biocompatibility and functionality.
- Artificial Pancreas: Growing number of diabetic patients, demand for improved glucose control and reduced complications.
- Artificial Lungs: High demand for patients with respiratory failure, advancement in extracorporeal membrane oxygenation (ECMO) technologies.
Bionics:
- Ear Bionics: Rising prevalence of hearing loss, technological advancements in cochlear implants.
- Vision Bionics: Growing need for retinal implants and visual prosthetics, ongoing research in visual restoration.
- Exoskeletons: Increased demand for rehabilitation and assistive devices, technological advancements in robotics and sensors.
- Bionic Limbs: Growing demand for prosthetic limbs with enhanced functionality and intuitive control, technological advancements in materials and control systems.
- Brain Bionics: Growing research in brain-computer interfaces and neuroprosthetics, potential to treat neurological disorders.
- Cardiac Bionics: Demand for implantable cardiac devices for heart failure and arrhythmias, advancements in cardiac rhythm management and resynchronization therapies.
Artificial Vital Organs and Medical Bionics Industry Product Developments
Recent product innovations are focused on miniaturization, biocompatibility, improved functionality, and ease of use. Advances in biomaterials, 3D printing, and AI are enhancing the performance and longevity of these devices. The integration of sensors and wireless technologies is enabling remote monitoring and personalized therapies. The market is witnessing a shift toward less invasive procedures and improved patient experience.
Key Drivers of Artificial Vital Organs and Medical Bionics Industry Growth
Several factors fuel the growth of this industry:
- Technological Advancements: Ongoing innovations in materials science, bioengineering, and AI are leading to more effective and safer devices.
- Economic Factors: Rising disposable incomes, especially in emerging economies, are driving demand for advanced healthcare solutions.
- Regulatory Support: Government initiatives and funding for research and development in this area are stimulating innovation and market growth. Examples include the Kidney Innovation Accelerator prize.
Challenges in the Artificial Vital Organs and Medical Bionics Industry Market
The industry faces several challenges:
- High Regulatory Hurdles: The stringent regulatory requirements for medical devices increase the time and cost associated with product development and market entry.
- Supply Chain Issues: The complex manufacturing processes and reliance on specialized materials can lead to supply chain disruptions.
- Competitive Pressure: The intense competition among established players and emerging startups creates pricing pressure and necessitates continuous innovation.
Emerging Opportunities in Artificial Vital Organs and Medical Bionics Industry
Long-term growth is fueled by several opportunities:
- Technological Breakthroughs: Advancements in gene editing, regenerative medicine, and nanotechnology hold the promise of creating more sophisticated and biocompatible devices.
- Strategic Partnerships: Collaborations between technology companies, medical device manufacturers, and research institutions accelerate innovation and market penetration.
- Market Expansion: Growing demand in emerging markets represents significant expansion potential.
Leading Players in the Artificial Vital Organs and Medical Bionics Industry Sector
- Bornlife Prosthetic and Orthotic Inc
- Ossur
- Abiomed Inc
- Cyberonics Inc
- Medtronic
- Baxter
- Asahi Kasei Medical Co Ltd
- Getinge AB
- Ekso Bionics Holdings Inc
- Boston Scientific Corporation
- Sonova
- Berlin Heart GmbH
Key Milestones in Artificial Vital Organs and Medical Bionics Industry Industry
- August 2022: The American Society of Nephrology and the United States Department of Health and Human Services offered USD 10.5 million for a new prize competition from the Kidney Innovation Accelerator. Phase 2 of the Artificial Kidney Prize competition is looking for suggestions for creating prototype bioartificial kidneys, as well as any novel equipment or parts that would make them possible.
- January 2022: IIT-Kanpur launched a project to develop an advanced artificial heart in collaboration with several Indian hospitals.
Strategic Outlook for Artificial Vital Organs and Medical Bionics Industry Market
The future of the artificial vital organs and medical bionics market is exceptionally promising. Continued technological advancements, rising healthcare expenditures, and an aging global population will drive significant market expansion. Strategic partnerships, focused R&D initiatives, and expansion into new geographical markets present substantial opportunities for growth and market leadership. Companies that embrace innovation, adapt to evolving regulatory landscapes, and prioritize patient-centric design will be best positioned to succeed in this dynamic market.
Artificial Vital Organs and Medical Bionics Industry Segmentation
-
1. Type
-
1.1. Artificial Organ
- 1.1.1. Artificial Heart
- 1.1.2. Artificial Kidney
- 1.1.3. Artificial Lungs
- 1.1.4. Cochlear Implants
- 1.1.5. Other Organ Types
-
1.2. Bionics
- 1.2.1. Vision Bionics
- 1.2.2. Ear Bionics
- 1.2.3. Orthopedic Bionic
- 1.2.4. Cardiac Bionics
-
1.1. Artificial Organ
Artificial Vital Organs and Medical Bionics Industry Segmentation By Geography
-
1. North America
- 1.1. United States
- 1.2. Canada
- 1.3. Mexico
-
2. Europe
- 2.1. Germany
- 2.2. United Kingdom
- 2.3. France
- 2.4. Italy
- 2.5. Spain
- 2.6. Rest of Europe
-
3. Asia Pacific
- 3.1. China
- 3.2. Japan
- 3.3. India
- 3.4. Australia
- 3.5. South Korea
- 3.6. Rest of Asia Pacific
-
4. Middle East and Africa
- 4.1. GCC
- 4.2. South Africa
- 4.3. Rest of Middle East and Africa
-
5. South America
- 5.1. Brazil
- 5.2. Argentina
- 5.3. Rest of South America
Artificial Vital Organs and Medical Bionics Industry REPORT HIGHLIGHTS
| Aspects | Details |
|---|---|
| Study Period | 2019-2033 |
| Base Year | 2024 |
| Estimated Year | 2025 |
| Forecast Period | 2025-2033 |
| Historical Period | 2019-2024 |
| Growth Rate | CAGR of 7.20% from 2019-2033 |
| Segmentation |
|
Table of Contents
- 1. Introduction
- 1.1. Research Scope
- 1.2. Market Segmentation
- 1.3. Research Methodology
- 1.4. Definitions and Assumptions
- 2. Executive Summary
- 2.1. Introduction
- 3. Market Dynamics
- 3.1. Introduction
- 3.2. Market Drivers
- 3.2.1. Increased Incidence of Disabilities and Organ Failures; High Incidence of Road Accidents Leading to Amputations; Scarcity of Donor Organs; Technological Advancements in the Artificial Organ and Bionics
- 3.3. Market Restrains
- 3.3.1. Expensive Procedures; Compatibility Issues and Malfunctions
- 3.4. Market Trends
- 3.4.1. Artificial Kidney by Artificial Organ Segment is anticipated to Grow Over the Forecast Period
- 4. Market Factor Analysis
- 4.1. Porters Five Forces
- 4.2. Supply/Value Chain
- 4.3. PESTEL analysis
- 4.4. Market Entropy
- 4.5. Patent/Trademark Analysis
- 5. Global Artificial Vital Organs and Medical Bionics Industry Analysis, Insights and Forecast, 2019-2031
- 5.1. Market Analysis, Insights and Forecast - by Type
- 5.1.1. Artificial Organ
- 5.1.1.1. Artificial Heart
- 5.1.1.2. Artificial Kidney
- 5.1.1.3. Artificial Lungs
- 5.1.1.4. Cochlear Implants
- 5.1.1.5. Other Organ Types
- 5.1.2. Bionics
- 5.1.2.1. Vision Bionics
- 5.1.2.2. Ear Bionics
- 5.1.2.3. Orthopedic Bionic
- 5.1.2.4. Cardiac Bionics
- 5.1.1. Artificial Organ
- 5.2. Market Analysis, Insights and Forecast - by Region
- 5.2.1. North America
- 5.2.2. Europe
- 5.2.3. Asia Pacific
- 5.2.4. Middle East and Africa
- 5.2.5. South America
- 5.1. Market Analysis, Insights and Forecast - by Type
- 6. North America Artificial Vital Organs and Medical Bionics Industry Analysis, Insights and Forecast, 2019-2031
- 6.1. Market Analysis, Insights and Forecast - by Type
- 6.1.1. Artificial Organ
- 6.1.1.1. Artificial Heart
- 6.1.1.2. Artificial Kidney
- 6.1.1.3. Artificial Lungs
- 6.1.1.4. Cochlear Implants
- 6.1.1.5. Other Organ Types
- 6.1.2. Bionics
- 6.1.2.1. Vision Bionics
- 6.1.2.2. Ear Bionics
- 6.1.2.3. Orthopedic Bionic
- 6.1.2.4. Cardiac Bionics
- 6.1.1. Artificial Organ
- 6.1. Market Analysis, Insights and Forecast - by Type
- 7. Europe Artificial Vital Organs and Medical Bionics Industry Analysis, Insights and Forecast, 2019-2031
- 7.1. Market Analysis, Insights and Forecast - by Type
- 7.1.1. Artificial Organ
- 7.1.1.1. Artificial Heart
- 7.1.1.2. Artificial Kidney
- 7.1.1.3. Artificial Lungs
- 7.1.1.4. Cochlear Implants
- 7.1.1.5. Other Organ Types
- 7.1.2. Bionics
- 7.1.2.1. Vision Bionics
- 7.1.2.2. Ear Bionics
- 7.1.2.3. Orthopedic Bionic
- 7.1.2.4. Cardiac Bionics
- 7.1.1. Artificial Organ
- 7.1. Market Analysis, Insights and Forecast - by Type
- 8. Asia Pacific Artificial Vital Organs and Medical Bionics Industry Analysis, Insights and Forecast, 2019-2031
- 8.1. Market Analysis, Insights and Forecast - by Type
- 8.1.1. Artificial Organ
- 8.1.1.1. Artificial Heart
- 8.1.1.2. Artificial Kidney
- 8.1.1.3. Artificial Lungs
- 8.1.1.4. Cochlear Implants
- 8.1.1.5. Other Organ Types
- 8.1.2. Bionics
- 8.1.2.1. Vision Bionics
- 8.1.2.2. Ear Bionics
- 8.1.2.3. Orthopedic Bionic
- 8.1.2.4. Cardiac Bionics
- 8.1.1. Artificial Organ
- 8.1. Market Analysis, Insights and Forecast - by Type
- 9. Middle East and Africa Artificial Vital Organs and Medical Bionics Industry Analysis, Insights and Forecast, 2019-2031
- 9.1. Market Analysis, Insights and Forecast - by Type
- 9.1.1. Artificial Organ
- 9.1.1.1. Artificial Heart
- 9.1.1.2. Artificial Kidney
- 9.1.1.3. Artificial Lungs
- 9.1.1.4. Cochlear Implants
- 9.1.1.5. Other Organ Types
- 9.1.2. Bionics
- 9.1.2.1. Vision Bionics
- 9.1.2.2. Ear Bionics
- 9.1.2.3. Orthopedic Bionic
- 9.1.2.4. Cardiac Bionics
- 9.1.1. Artificial Organ
- 9.1. Market Analysis, Insights and Forecast - by Type
- 10. South America Artificial Vital Organs and Medical Bionics Industry Analysis, Insights and Forecast, 2019-2031
- 10.1. Market Analysis, Insights and Forecast - by Type
- 10.1.1. Artificial Organ
- 10.1.1.1. Artificial Heart
- 10.1.1.2. Artificial Kidney
- 10.1.1.3. Artificial Lungs
- 10.1.1.4. Cochlear Implants
- 10.1.1.5. Other Organ Types
- 10.1.2. Bionics
- 10.1.2.1. Vision Bionics
- 10.1.2.2. Ear Bionics
- 10.1.2.3. Orthopedic Bionic
- 10.1.2.4. Cardiac Bionics
- 10.1.1. Artificial Organ
- 10.1. Market Analysis, Insights and Forecast - by Type
- 11. North America Artificial Vital Organs and Medical Bionics Industry Analysis, Insights and Forecast, 2019-2031
- 11.1. Market Analysis, Insights and Forecast - By Country/Sub-region
- 11.1.1 United States
- 11.1.2 Canada
- 11.1.3 Mexico
- 12. Europe Artificial Vital Organs and Medical Bionics Industry Analysis, Insights and Forecast, 2019-2031
- 12.1. Market Analysis, Insights and Forecast - By Country/Sub-region
- 12.1.1 Germany
- 12.1.2 United Kingdom
- 12.1.3 France
- 12.1.4 Italy
- 12.1.5 Spain
- 12.1.6 Rest of Europe
- 13. Asia Pacific Artificial Vital Organs and Medical Bionics Industry Analysis, Insights and Forecast, 2019-2031
- 13.1. Market Analysis, Insights and Forecast - By Country/Sub-region
- 13.1.1 China
- 13.1.2 Japan
- 13.1.3 India
- 13.1.4 Australia
- 13.1.5 South Korea
- 13.1.6 Rest of Asia Pacific
- 14. Middle East and Africa Artificial Vital Organs and Medical Bionics Industry Analysis, Insights and Forecast, 2019-2031
- 14.1. Market Analysis, Insights and Forecast - By Country/Sub-region
- 14.1.1 GCC
- 14.1.2 South Africa
- 14.1.3 Rest of Middle East and Africa
- 15. South America Artificial Vital Organs and Medical Bionics Industry Analysis, Insights and Forecast, 2019-2031
- 15.1. Market Analysis, Insights and Forecast - By Country/Sub-region
- 15.1.1 Brazil
- 15.1.2 Argentina
- 15.1.3 Rest of South America
- 16. Competitive Analysis
- 16.1. Global Market Share Analysis 2024
- 16.2. Company Profiles
- 16.2.1 Bornlife Prosthetic and Orthotic Inc
- 16.2.1.1. Overview
- 16.2.1.2. Products
- 16.2.1.3. SWOT Analysis
- 16.2.1.4. Recent Developments
- 16.2.1.5. Financials (Based on Availability)
- 16.2.2 Ossur
- 16.2.2.1. Overview
- 16.2.2.2. Products
- 16.2.2.3. SWOT Analysis
- 16.2.2.4. Recent Developments
- 16.2.2.5. Financials (Based on Availability)
- 16.2.3 Abiomed Inc
- 16.2.3.1. Overview
- 16.2.3.2. Products
- 16.2.3.3. SWOT Analysis
- 16.2.3.4. Recent Developments
- 16.2.3.5. Financials (Based on Availability)
- 16.2.4 Cyberonics Inc
- 16.2.4.1. Overview
- 16.2.4.2. Products
- 16.2.4.3. SWOT Analysis
- 16.2.4.4. Recent Developments
- 16.2.4.5. Financials (Based on Availability)
- 16.2.5 Medtronic
- 16.2.5.1. Overview
- 16.2.5.2. Products
- 16.2.5.3. SWOT Analysis
- 16.2.5.4. Recent Developments
- 16.2.5.5. Financials (Based on Availability)
- 16.2.6 Baxter
- 16.2.6.1. Overview
- 16.2.6.2. Products
- 16.2.6.3. SWOT Analysis
- 16.2.6.4. Recent Developments
- 16.2.6.5. Financials (Based on Availability)
- 16.2.7 Asahi Kasei Medical Co Ltd
- 16.2.7.1. Overview
- 16.2.7.2. Products
- 16.2.7.3. SWOT Analysis
- 16.2.7.4. Recent Developments
- 16.2.7.5. Financials (Based on Availability)
- 16.2.8 Getinge AB
- 16.2.8.1. Overview
- 16.2.8.2. Products
- 16.2.8.3. SWOT Analysis
- 16.2.8.4. Recent Developments
- 16.2.8.5. Financials (Based on Availability)
- 16.2.9 Ekso Bionics Holdings Inc
- 16.2.9.1. Overview
- 16.2.9.2. Products
- 16.2.9.3. SWOT Analysis
- 16.2.9.4. Recent Developments
- 16.2.9.5. Financials (Based on Availability)
- 16.2.10 Boston Scientific Corporation
- 16.2.10.1. Overview
- 16.2.10.2. Products
- 16.2.10.3. SWOT Analysis
- 16.2.10.4. Recent Developments
- 16.2.10.5. Financials (Based on Availability)
- 16.2.11 Sonova*List Not Exhaustive
- 16.2.11.1. Overview
- 16.2.11.2. Products
- 16.2.11.3. SWOT Analysis
- 16.2.11.4. Recent Developments
- 16.2.11.5. Financials (Based on Availability)
- 16.2.12 Berlin Heart GmbH
- 16.2.12.1. Overview
- 16.2.12.2. Products
- 16.2.12.3. SWOT Analysis
- 16.2.12.4. Recent Developments
- 16.2.12.5. Financials (Based on Availability)
- 16.2.1 Bornlife Prosthetic and Orthotic Inc
List of Figures
- Figure 1: Global Artificial Vital Organs and Medical Bionics Industry Revenue Breakdown (Million, %) by Region 2024 & 2032
- Figure 2: Global Artificial Vital Organs and Medical Bionics Industry Volume Breakdown (Piece, %) by Region 2024 & 2032
- Figure 3: North America Artificial Vital Organs and Medical Bionics Industry Revenue (Million), by Country 2024 & 2032
- Figure 4: North America Artificial Vital Organs and Medical Bionics Industry Volume (Piece), by Country 2024 & 2032
- Figure 5: North America Artificial Vital Organs and Medical Bionics Industry Revenue Share (%), by Country 2024 & 2032
- Figure 6: North America Artificial Vital Organs and Medical Bionics Industry Volume Share (%), by Country 2024 & 2032
- Figure 7: Europe Artificial Vital Organs and Medical Bionics Industry Revenue (Million), by Country 2024 & 2032
- Figure 8: Europe Artificial Vital Organs and Medical Bionics Industry Volume (Piece), by Country 2024 & 2032
- Figure 9: Europe Artificial Vital Organs and Medical Bionics Industry Revenue Share (%), by Country 2024 & 2032
- Figure 10: Europe Artificial Vital Organs and Medical Bionics Industry Volume Share (%), by Country 2024 & 2032
- Figure 11: Asia Pacific Artificial Vital Organs and Medical Bionics Industry Revenue (Million), by Country 2024 & 2032
- Figure 12: Asia Pacific Artificial Vital Organs and Medical Bionics Industry Volume (Piece), by Country 2024 & 2032
- Figure 13: Asia Pacific Artificial Vital Organs and Medical Bionics Industry Revenue Share (%), by Country 2024 & 2032
- Figure 14: Asia Pacific Artificial Vital Organs and Medical Bionics Industry Volume Share (%), by Country 2024 & 2032
- Figure 15: Middle East and Africa Artificial Vital Organs and Medical Bionics Industry Revenue (Million), by Country 2024 & 2032
- Figure 16: Middle East and Africa Artificial Vital Organs and Medical Bionics Industry Volume (Piece), by Country 2024 & 2032
- Figure 17: Middle East and Africa Artificial Vital Organs and Medical Bionics Industry Revenue Share (%), by Country 2024 & 2032
- Figure 18: Middle East and Africa Artificial Vital Organs and Medical Bionics Industry Volume Share (%), by Country 2024 & 2032
- Figure 19: South America Artificial Vital Organs and Medical Bionics Industry Revenue (Million), by Country 2024 & 2032
- Figure 20: South America Artificial Vital Organs and Medical Bionics Industry Volume (Piece), by Country 2024 & 2032
- Figure 21: South America Artificial Vital Organs and Medical Bionics Industry Revenue Share (%), by Country 2024 & 2032
- Figure 22: South America Artificial Vital Organs and Medical Bionics Industry Volume Share (%), by Country 2024 & 2032
- Figure 23: North America Artificial Vital Organs and Medical Bionics Industry Revenue (Million), by Type 2024 & 2032
- Figure 24: North America Artificial Vital Organs and Medical Bionics Industry Volume (Piece), by Type 2024 & 2032
- Figure 25: North America Artificial Vital Organs and Medical Bionics Industry Revenue Share (%), by Type 2024 & 2032
- Figure 26: North America Artificial Vital Organs and Medical Bionics Industry Volume Share (%), by Type 2024 & 2032
- Figure 27: North America Artificial Vital Organs and Medical Bionics Industry Revenue (Million), by Country 2024 & 2032
- Figure 28: North America Artificial Vital Organs and Medical Bionics Industry Volume (Piece), by Country 2024 & 2032
- Figure 29: North America Artificial Vital Organs and Medical Bionics Industry Revenue Share (%), by Country 2024 & 2032
- Figure 30: North America Artificial Vital Organs and Medical Bionics Industry Volume Share (%), by Country 2024 & 2032
- Figure 31: Europe Artificial Vital Organs and Medical Bionics Industry Revenue (Million), by Type 2024 & 2032
- Figure 32: Europe Artificial Vital Organs and Medical Bionics Industry Volume (Piece), by Type 2024 & 2032
- Figure 33: Europe Artificial Vital Organs and Medical Bionics Industry Revenue Share (%), by Type 2024 & 2032
- Figure 34: Europe Artificial Vital Organs and Medical Bionics Industry Volume Share (%), by Type 2024 & 2032
- Figure 35: Europe Artificial Vital Organs and Medical Bionics Industry Revenue (Million), by Country 2024 & 2032
- Figure 36: Europe Artificial Vital Organs and Medical Bionics Industry Volume (Piece), by Country 2024 & 2032
- Figure 37: Europe Artificial Vital Organs and Medical Bionics Industry Revenue Share (%), by Country 2024 & 2032
- Figure 38: Europe Artificial Vital Organs and Medical Bionics Industry Volume Share (%), by Country 2024 & 2032
- Figure 39: Asia Pacific Artificial Vital Organs and Medical Bionics Industry Revenue (Million), by Type 2024 & 2032
- Figure 40: Asia Pacific Artificial Vital Organs and Medical Bionics Industry Volume (Piece), by Type 2024 & 2032
- Figure 41: Asia Pacific Artificial Vital Organs and Medical Bionics Industry Revenue Share (%), by Type 2024 & 2032
- Figure 42: Asia Pacific Artificial Vital Organs and Medical Bionics Industry Volume Share (%), by Type 2024 & 2032
- Figure 43: Asia Pacific Artificial Vital Organs and Medical Bionics Industry Revenue (Million), by Country 2024 & 2032
- Figure 44: Asia Pacific Artificial Vital Organs and Medical Bionics Industry Volume (Piece), by Country 2024 & 2032
- Figure 45: Asia Pacific Artificial Vital Organs and Medical Bionics Industry Revenue Share (%), by Country 2024 & 2032
- Figure 46: Asia Pacific Artificial Vital Organs and Medical Bionics Industry Volume Share (%), by Country 2024 & 2032
- Figure 47: Middle East and Africa Artificial Vital Organs and Medical Bionics Industry Revenue (Million), by Type 2024 & 2032
- Figure 48: Middle East and Africa Artificial Vital Organs and Medical Bionics Industry Volume (Piece), by Type 2024 & 2032
- Figure 49: Middle East and Africa Artificial Vital Organs and Medical Bionics Industry Revenue Share (%), by Type 2024 & 2032
- Figure 50: Middle East and Africa Artificial Vital Organs and Medical Bionics Industry Volume Share (%), by Type 2024 & 2032
- Figure 51: Middle East and Africa Artificial Vital Organs and Medical Bionics Industry Revenue (Million), by Country 2024 & 2032
- Figure 52: Middle East and Africa Artificial Vital Organs and Medical Bionics Industry Volume (Piece), by Country 2024 & 2032
- Figure 53: Middle East and Africa Artificial Vital Organs and Medical Bionics Industry Revenue Share (%), by Country 2024 & 2032
- Figure 54: Middle East and Africa Artificial Vital Organs and Medical Bionics Industry Volume Share (%), by Country 2024 & 2032
- Figure 55: South America Artificial Vital Organs and Medical Bionics Industry Revenue (Million), by Type 2024 & 2032
- Figure 56: South America Artificial Vital Organs and Medical Bionics Industry Volume (Piece), by Type 2024 & 2032
- Figure 57: South America Artificial Vital Organs and Medical Bionics Industry Revenue Share (%), by Type 2024 & 2032
- Figure 58: South America Artificial Vital Organs and Medical Bionics Industry Volume Share (%), by Type 2024 & 2032
- Figure 59: South America Artificial Vital Organs and Medical Bionics Industry Revenue (Million), by Country 2024 & 2032
- Figure 60: South America Artificial Vital Organs and Medical Bionics Industry Volume (Piece), by Country 2024 & 2032
- Figure 61: South America Artificial Vital Organs and Medical Bionics Industry Revenue Share (%), by Country 2024 & 2032
- Figure 62: South America Artificial Vital Organs and Medical Bionics Industry Volume Share (%), by Country 2024 & 2032
List of Tables
- Table 1: Global Artificial Vital Organs and Medical Bionics Industry Revenue Million Forecast, by Region 2019 & 2032
- Table 2: Global Artificial Vital Organs and Medical Bionics Industry Volume Piece Forecast, by Region 2019 & 2032
- Table 3: Global Artificial Vital Organs and Medical Bionics Industry Revenue Million Forecast, by Type 2019 & 2032
- Table 4: Global Artificial Vital Organs and Medical Bionics Industry Volume Piece Forecast, by Type 2019 & 2032
- Table 5: Global Artificial Vital Organs and Medical Bionics Industry Revenue Million Forecast, by Region 2019 & 2032
- Table 6: Global Artificial Vital Organs and Medical Bionics Industry Volume Piece Forecast, by Region 2019 & 2032
- Table 7: Global Artificial Vital Organs and Medical Bionics Industry Revenue Million Forecast, by Country 2019 & 2032
- Table 8: Global Artificial Vital Organs and Medical Bionics Industry Volume Piece Forecast, by Country 2019 & 2032
- Table 9: United States Artificial Vital Organs and Medical Bionics Industry Revenue (Million) Forecast, by Application 2019 & 2032
- Table 10: United States Artificial Vital Organs and Medical Bionics Industry Volume (Piece) Forecast, by Application 2019 & 2032
- Table 11: Canada Artificial Vital Organs and Medical Bionics Industry Revenue (Million) Forecast, by Application 2019 & 2032
- Table 12: Canada Artificial Vital Organs and Medical Bionics Industry Volume (Piece) Forecast, by Application 2019 & 2032
- Table 13: Mexico Artificial Vital Organs and Medical Bionics Industry Revenue (Million) Forecast, by Application 2019 & 2032
- Table 14: Mexico Artificial Vital Organs and Medical Bionics Industry Volume (Piece) Forecast, by Application 2019 & 2032
- Table 15: Global Artificial Vital Organs and Medical Bionics Industry Revenue Million Forecast, by Country 2019 & 2032
- Table 16: Global Artificial Vital Organs and Medical Bionics Industry Volume Piece Forecast, by Country 2019 & 2032
- Table 17: Germany Artificial Vital Organs and Medical Bionics Industry Revenue (Million) Forecast, by Application 2019 & 2032
- Table 18: Germany Artificial Vital Organs and Medical Bionics Industry Volume (Piece) Forecast, by Application 2019 & 2032
- Table 19: United Kingdom Artificial Vital Organs and Medical Bionics Industry Revenue (Million) Forecast, by Application 2019 & 2032
- Table 20: United Kingdom Artificial Vital Organs and Medical Bionics Industry Volume (Piece) Forecast, by Application 2019 & 2032
- Table 21: France Artificial Vital Organs and Medical Bionics Industry Revenue (Million) Forecast, by Application 2019 & 2032
- Table 22: France Artificial Vital Organs and Medical Bionics Industry Volume (Piece) Forecast, by Application 2019 & 2032
- Table 23: Italy Artificial Vital Organs and Medical Bionics Industry Revenue (Million) Forecast, by Application 2019 & 2032
- Table 24: Italy Artificial Vital Organs and Medical Bionics Industry Volume (Piece) Forecast, by Application 2019 & 2032
- Table 25: Spain Artificial Vital Organs and Medical Bionics Industry Revenue (Million) Forecast, by Application 2019 & 2032
- Table 26: Spain Artificial Vital Organs and Medical Bionics Industry Volume (Piece) Forecast, by Application 2019 & 2032
- Table 27: Rest of Europe Artificial Vital Organs and Medical Bionics Industry Revenue (Million) Forecast, by Application 2019 & 2032
- Table 28: Rest of Europe Artificial Vital Organs and Medical Bionics Industry Volume (Piece) Forecast, by Application 2019 & 2032
- Table 29: Global Artificial Vital Organs and Medical Bionics Industry Revenue Million Forecast, by Country 2019 & 2032
- Table 30: Global Artificial Vital Organs and Medical Bionics Industry Volume Piece Forecast, by Country 2019 & 2032
- Table 31: China Artificial Vital Organs and Medical Bionics Industry Revenue (Million) Forecast, by Application 2019 & 2032
- Table 32: China Artificial Vital Organs and Medical Bionics Industry Volume (Piece) Forecast, by Application 2019 & 2032
- Table 33: Japan Artificial Vital Organs and Medical Bionics Industry Revenue (Million) Forecast, by Application 2019 & 2032
- Table 34: Japan Artificial Vital Organs and Medical Bionics Industry Volume (Piece) Forecast, by Application 2019 & 2032
- Table 35: India Artificial Vital Organs and Medical Bionics Industry Revenue (Million) Forecast, by Application 2019 & 2032
- Table 36: India Artificial Vital Organs and Medical Bionics Industry Volume (Piece) Forecast, by Application 2019 & 2032
- Table 37: Australia Artificial Vital Organs and Medical Bionics Industry Revenue (Million) Forecast, by Application 2019 & 2032
- Table 38: Australia Artificial Vital Organs and Medical Bionics Industry Volume (Piece) Forecast, by Application 2019 & 2032
- Table 39: South Korea Artificial Vital Organs and Medical Bionics Industry Revenue (Million) Forecast, by Application 2019 & 2032
- Table 40: South Korea Artificial Vital Organs and Medical Bionics Industry Volume (Piece) Forecast, by Application 2019 & 2032
- Table 41: Rest of Asia Pacific Artificial Vital Organs and Medical Bionics Industry Revenue (Million) Forecast, by Application 2019 & 2032
- Table 42: Rest of Asia Pacific Artificial Vital Organs and Medical Bionics Industry Volume (Piece) Forecast, by Application 2019 & 2032
- Table 43: Global Artificial Vital Organs and Medical Bionics Industry Revenue Million Forecast, by Country 2019 & 2032
- Table 44: Global Artificial Vital Organs and Medical Bionics Industry Volume Piece Forecast, by Country 2019 & 2032
- Table 45: GCC Artificial Vital Organs and Medical Bionics Industry Revenue (Million) Forecast, by Application 2019 & 2032
- Table 46: GCC Artificial Vital Organs and Medical Bionics Industry Volume (Piece) Forecast, by Application 2019 & 2032
- Table 47: South Africa Artificial Vital Organs and Medical Bionics Industry Revenue (Million) Forecast, by Application 2019 & 2032
- Table 48: South Africa Artificial Vital Organs and Medical Bionics Industry Volume (Piece) Forecast, by Application 2019 & 2032
- Table 49: Rest of Middle East and Africa Artificial Vital Organs and Medical Bionics Industry Revenue (Million) Forecast, by Application 2019 & 2032
- Table 50: Rest of Middle East and Africa Artificial Vital Organs and Medical Bionics Industry Volume (Piece) Forecast, by Application 2019 & 2032
- Table 51: Global Artificial Vital Organs and Medical Bionics Industry Revenue Million Forecast, by Country 2019 & 2032
- Table 52: Global Artificial Vital Organs and Medical Bionics Industry Volume Piece Forecast, by Country 2019 & 2032
- Table 53: Brazil Artificial Vital Organs and Medical Bionics Industry Revenue (Million) Forecast, by Application 2019 & 2032
- Table 54: Brazil Artificial Vital Organs and Medical Bionics Industry Volume (Piece) Forecast, by Application 2019 & 2032
- Table 55: Argentina Artificial Vital Organs and Medical Bionics Industry Revenue (Million) Forecast, by Application 2019 & 2032
- Table 56: Argentina Artificial Vital Organs and Medical Bionics Industry Volume (Piece) Forecast, by Application 2019 & 2032
- Table 57: Rest of South America Artificial Vital Organs and Medical Bionics Industry Revenue (Million) Forecast, by Application 2019 & 2032
- Table 58: Rest of South America Artificial Vital Organs and Medical Bionics Industry Volume (Piece) Forecast, by Application 2019 & 2032
- Table 59: Global Artificial Vital Organs and Medical Bionics Industry Revenue Million Forecast, by Type 2019 & 2032
- Table 60: Global Artificial Vital Organs and Medical Bionics Industry Volume Piece Forecast, by Type 2019 & 2032
- Table 61: Global Artificial Vital Organs and Medical Bionics Industry Revenue Million Forecast, by Country 2019 & 2032
- Table 62: Global Artificial Vital Organs and Medical Bionics Industry Volume Piece Forecast, by Country 2019 & 2032
- Table 63: United States Artificial Vital Organs and Medical Bionics Industry Revenue (Million) Forecast, by Application 2019 & 2032
- Table 64: United States Artificial Vital Organs and Medical Bionics Industry Volume (Piece) Forecast, by Application 2019 & 2032
- Table 65: Canada Artificial Vital Organs and Medical Bionics Industry Revenue (Million) Forecast, by Application 2019 & 2032
- Table 66: Canada Artificial Vital Organs and Medical Bionics Industry Volume (Piece) Forecast, by Application 2019 & 2032
- Table 67: Mexico Artificial Vital Organs and Medical Bionics Industry Revenue (Million) Forecast, by Application 2019 & 2032
- Table 68: Mexico Artificial Vital Organs and Medical Bionics Industry Volume (Piece) Forecast, by Application 2019 & 2032
- Table 69: Global Artificial Vital Organs and Medical Bionics Industry Revenue Million Forecast, by Type 2019 & 2032
- Table 70: Global Artificial Vital Organs and Medical Bionics Industry Volume Piece Forecast, by Type 2019 & 2032
- Table 71: Global Artificial Vital Organs and Medical Bionics Industry Revenue Million Forecast, by Country 2019 & 2032
- Table 72: Global Artificial Vital Organs and Medical Bionics Industry Volume Piece Forecast, by Country 2019 & 2032
- Table 73: Germany Artificial Vital Organs and Medical Bionics Industry Revenue (Million) Forecast, by Application 2019 & 2032
- Table 74: Germany Artificial Vital Organs and Medical Bionics Industry Volume (Piece) Forecast, by Application 2019 & 2032
- Table 75: United Kingdom Artificial Vital Organs and Medical Bionics Industry Revenue (Million) Forecast, by Application 2019 & 2032
- Table 76: United Kingdom Artificial Vital Organs and Medical Bionics Industry Volume (Piece) Forecast, by Application 2019 & 2032
- Table 77: France Artificial Vital Organs and Medical Bionics Industry Revenue (Million) Forecast, by Application 2019 & 2032
- Table 78: France Artificial Vital Organs and Medical Bionics Industry Volume (Piece) Forecast, by Application 2019 & 2032
- Table 79: Italy Artificial Vital Organs and Medical Bionics Industry Revenue (Million) Forecast, by Application 2019 & 2032
- Table 80: Italy Artificial Vital Organs and Medical Bionics Industry Volume (Piece) Forecast, by Application 2019 & 2032
- Table 81: Spain Artificial Vital Organs and Medical Bionics Industry Revenue (Million) Forecast, by Application 2019 & 2032
- Table 82: Spain Artificial Vital Organs and Medical Bionics Industry Volume (Piece) Forecast, by Application 2019 & 2032
- Table 83: Rest of Europe Artificial Vital Organs and Medical Bionics Industry Revenue (Million) Forecast, by Application 2019 & 2032
- Table 84: Rest of Europe Artificial Vital Organs and Medical Bionics Industry Volume (Piece) Forecast, by Application 2019 & 2032
- Table 85: Global Artificial Vital Organs and Medical Bionics Industry Revenue Million Forecast, by Type 2019 & 2032
- Table 86: Global Artificial Vital Organs and Medical Bionics Industry Volume Piece Forecast, by Type 2019 & 2032
- Table 87: Global Artificial Vital Organs and Medical Bionics Industry Revenue Million Forecast, by Country 2019 & 2032
- Table 88: Global Artificial Vital Organs and Medical Bionics Industry Volume Piece Forecast, by Country 2019 & 2032
- Table 89: China Artificial Vital Organs and Medical Bionics Industry Revenue (Million) Forecast, by Application 2019 & 2032
- Table 90: China Artificial Vital Organs and Medical Bionics Industry Volume (Piece) Forecast, by Application 2019 & 2032
- Table 91: Japan Artificial Vital Organs and Medical Bionics Industry Revenue (Million) Forecast, by Application 2019 & 2032
- Table 92: Japan Artificial Vital Organs and Medical Bionics Industry Volume (Piece) Forecast, by Application 2019 & 2032
- Table 93: India Artificial Vital Organs and Medical Bionics Industry Revenue (Million) Forecast, by Application 2019 & 2032
- Table 94: India Artificial Vital Organs and Medical Bionics Industry Volume (Piece) Forecast, by Application 2019 & 2032
- Table 95: Australia Artificial Vital Organs and Medical Bionics Industry Revenue (Million) Forecast, by Application 2019 & 2032
- Table 96: Australia Artificial Vital Organs and Medical Bionics Industry Volume (Piece) Forecast, by Application 2019 & 2032
- Table 97: South Korea Artificial Vital Organs and Medical Bionics Industry Revenue (Million) Forecast, by Application 2019 & 2032
- Table 98: South Korea Artificial Vital Organs and Medical Bionics Industry Volume (Piece) Forecast, by Application 2019 & 2032
- Table 99: Rest of Asia Pacific Artificial Vital Organs and Medical Bionics Industry Revenue (Million) Forecast, by Application 2019 & 2032
- Table 100: Rest of Asia Pacific Artificial Vital Organs and Medical Bionics Industry Volume (Piece) Forecast, by Application 2019 & 2032
- Table 101: Global Artificial Vital Organs and Medical Bionics Industry Revenue Million Forecast, by Type 2019 & 2032
- Table 102: Global Artificial Vital Organs and Medical Bionics Industry Volume Piece Forecast, by Type 2019 & 2032
- Table 103: Global Artificial Vital Organs and Medical Bionics Industry Revenue Million Forecast, by Country 2019 & 2032
- Table 104: Global Artificial Vital Organs and Medical Bionics Industry Volume Piece Forecast, by Country 2019 & 2032
- Table 105: GCC Artificial Vital Organs and Medical Bionics Industry Revenue (Million) Forecast, by Application 2019 & 2032
- Table 106: GCC Artificial Vital Organs and Medical Bionics Industry Volume (Piece) Forecast, by Application 2019 & 2032
- Table 107: South Africa Artificial Vital Organs and Medical Bionics Industry Revenue (Million) Forecast, by Application 2019 & 2032
- Table 108: South Africa Artificial Vital Organs and Medical Bionics Industry Volume (Piece) Forecast, by Application 2019 & 2032
- Table 109: Rest of Middle East and Africa Artificial Vital Organs and Medical Bionics Industry Revenue (Million) Forecast, by Application 2019 & 2032
- Table 110: Rest of Middle East and Africa Artificial Vital Organs and Medical Bionics Industry Volume (Piece) Forecast, by Application 2019 & 2032
- Table 111: Global Artificial Vital Organs and Medical Bionics Industry Revenue Million Forecast, by Type 2019 & 2032
- Table 112: Global Artificial Vital Organs and Medical Bionics Industry Volume Piece Forecast, by Type 2019 & 2032
- Table 113: Global Artificial Vital Organs and Medical Bionics Industry Revenue Million Forecast, by Country 2019 & 2032
- Table 114: Global Artificial Vital Organs and Medical Bionics Industry Volume Piece Forecast, by Country 2019 & 2032
- Table 115: Brazil Artificial Vital Organs and Medical Bionics Industry Revenue (Million) Forecast, by Application 2019 & 2032
- Table 116: Brazil Artificial Vital Organs and Medical Bionics Industry Volume (Piece) Forecast, by Application 2019 & 2032
- Table 117: Argentina Artificial Vital Organs and Medical Bionics Industry Revenue (Million) Forecast, by Application 2019 & 2032
- Table 118: Argentina Artificial Vital Organs and Medical Bionics Industry Volume (Piece) Forecast, by Application 2019 & 2032
- Table 119: Rest of South America Artificial Vital Organs and Medical Bionics Industry Revenue (Million) Forecast, by Application 2019 & 2032
- Table 120: Rest of South America Artificial Vital Organs and Medical Bionics Industry Volume (Piece) Forecast, by Application 2019 & 2032
Frequently Asked Questions
1. What is the projected Compound Annual Growth Rate (CAGR) of the Artificial Vital Organs and Medical Bionics Industry?
The projected CAGR is approximately 7.20%.
2. Which companies are prominent players in the Artificial Vital Organs and Medical Bionics Industry?
Key companies in the market include Bornlife Prosthetic and Orthotic Inc, Ossur, Abiomed Inc, Cyberonics Inc, Medtronic, Baxter, Asahi Kasei Medical Co Ltd, Getinge AB, Ekso Bionics Holdings Inc, Boston Scientific Corporation, Sonova*List Not Exhaustive, Berlin Heart GmbH.
3. What are the main segments of the Artificial Vital Organs and Medical Bionics Industry?
The market segments include Type.
4. Can you provide details about the market size?
The market size is estimated to be USD 29.84 Million as of 2022.
5. What are some drivers contributing to market growth?
Increased Incidence of Disabilities and Organ Failures; High Incidence of Road Accidents Leading to Amputations; Scarcity of Donor Organs; Technological Advancements in the Artificial Organ and Bionics.
6. What are the notable trends driving market growth?
Artificial Kidney by Artificial Organ Segment is anticipated to Grow Over the Forecast Period.
7. Are there any restraints impacting market growth?
Expensive Procedures; Compatibility Issues and Malfunctions.
8. Can you provide examples of recent developments in the market?
In August 2022, the American Society of Nephrology and the United States Department of Health and Human Services offered USD 10.5 million for a new prize competition from the Kidney Innovation Accelerator. Phase 2 of the Artificial Kidney Prize competition is looking for suggestions for creating prototype bioartificial kidneys, as well as any novel equipment or parts that would make them possible.
9. What pricing options are available for accessing the report?
Pricing options include single-user, multi-user, and enterprise licenses priced at USD 4750, USD 5250, and USD 8750 respectively.
10. Is the market size provided in terms of value or volume?
The market size is provided in terms of value, measured in Million and volume, measured in Piece.
11. Are there any specific market keywords associated with the report?
Yes, the market keyword associated with the report is "Artificial Vital Organs and Medical Bionics Industry," which aids in identifying and referencing the specific market segment covered.
12. How do I determine which pricing option suits my needs best?
The pricing options vary based on user requirements and access needs. Individual users may opt for single-user licenses, while businesses requiring broader access may choose multi-user or enterprise licenses for cost-effective access to the report.
13. Are there any additional resources or data provided in the Artificial Vital Organs and Medical Bionics Industry report?
While the report offers comprehensive insights, it's advisable to review the specific contents or supplementary materials provided to ascertain if additional resources or data are available.
14. How can I stay updated on further developments or reports in the Artificial Vital Organs and Medical Bionics Industry?
To stay informed about further developments, trends, and reports in the Artificial Vital Organs and Medical Bionics Industry, consider subscribing to industry newsletters, following relevant companies and organizations, or regularly checking reputable industry news sources and publications.
Methodology
Step 1 - Identification of Relevant Samples Size from Population Database


Step 2 - Approaches for Defining Global Market Size (Value, Volume* & Price*)

Note*: In applicable scenarios
Step 3 - Data Sources
Primary Research
- Web Analytics
- Survey Reports
- Research Institute
- Latest Research Reports
- Opinion Leaders
Secondary Research
- Annual Reports
- White Paper
- Latest Press Release
- Industry Association
- Paid Database
- Investor Presentations

Step 4 - Data Triangulation
Involves using different sources of information in order to increase the validity of a study
These sources are likely to be stakeholders in a program - participants, other researchers, program staff, other community members, and so on.
Then we put all data in single framework & apply various statistical tools to find out the dynamic on the market.
During the analysis stage, feedback from the stakeholder groups would be compared to determine areas of agreement as well as areas of divergence
