

Key Insights
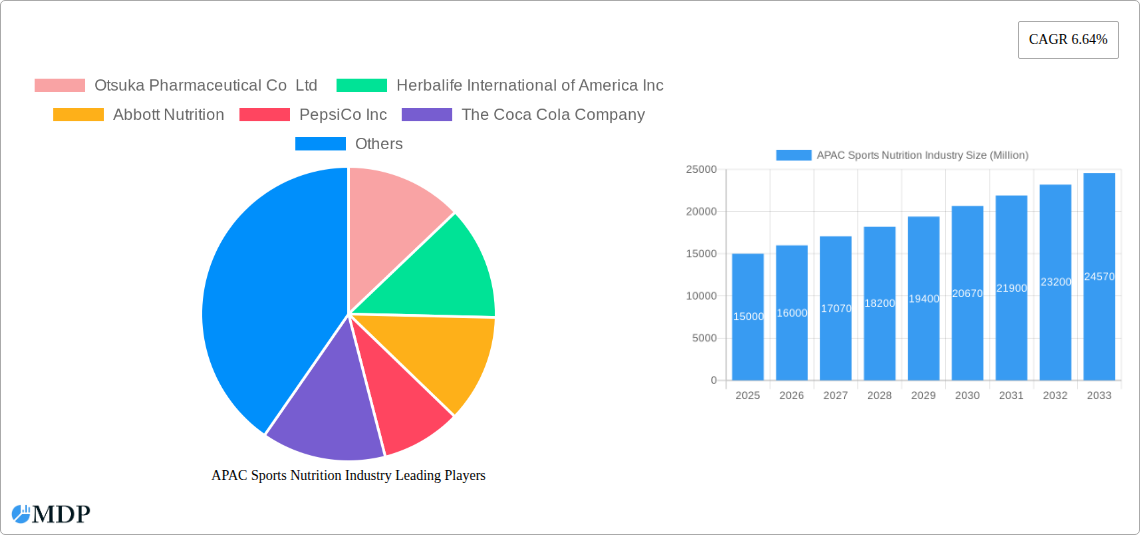
The Asia-Pacific (APAC) sports nutrition market is experiencing robust growth, driven by rising health consciousness, increasing disposable incomes, and a surge in participation in fitness activities across the region. The market's expansion is particularly notable in countries like China, India, and Japan, where a burgeoning middle class with a greater focus on wellness is fueling demand for sports foods, drinks, and supplements. This growth is further amplified by the increasing popularity of various sports and fitness trends, including yoga, running, weight training, and team sports. While the precise market size for APAC in 2025 isn't provided, considering the global CAGR of 6.64% and the strong regional growth drivers, a reasonable estimate places the APAC market value at approximately $15 billion (USD) in 2025. This estimate accounts for the significant market share held by countries like China and India, which are characterized by rapidly expanding fitness and wellness sectors. The growth is expected to continue at a healthy pace, with key segments like sports supplements and online retail channels contributing significantly to overall market expansion.
However, certain challenges exist. Price sensitivity in some APAC markets, particularly in developing economies, can restrain growth. Furthermore, ensuring product quality and authenticity amidst a surge in counterfeit products remains a crucial concern for both consumers and businesses. The regulatory environment surrounding sports nutrition products also varies significantly across different APAC countries, posing logistical and compliance challenges for brands. Despite these hurdles, the long-term outlook for the APAC sports nutrition market remains positive. Continued innovation in product formulation, targeted marketing campaigns that cater to local preferences, and a focus on building consumer trust are key strategies for achieving continued growth in this dynamic market. The increasing penetration of e-commerce and online retail will also play a significant role in shaping the future of this industry.
APAC Sports Nutrition Industry Report: 2019-2033 Forecast
Unlocking the Potential of the Thriving APAC Sports Nutrition Market: A Comprehensive Analysis (2019-2033)
This comprehensive report provides an in-depth analysis of the Asia-Pacific (APAC) sports nutrition industry, offering invaluable insights for stakeholders, investors, and industry professionals. We delve into market dynamics, leading players, emerging trends, and future growth opportunities, providing a detailed forecast from 2019 to 2033. The report covers key segments like Sports Food, Sports Drinks, and Sports Supplements, across various distribution channels including supermarkets, convenience stores, online platforms, and specialty stores. With a base year of 2025 and an estimated year of 2025, this report equips you with the data you need to navigate this dynamic market.
APAC Sports Nutrition Industry Market Dynamics & Concentration
The APAC sports nutrition market exhibits a dynamic interplay of factors influencing its growth and concentration. Market concentration is moderate, with a few key players holding significant shares, while numerous smaller players contribute to a competitive landscape. Innovation is a crucial driver, particularly in product formulation and delivery systems. Stringent regulatory frameworks in various APAC countries affect product approvals and labeling requirements. The market witnesses substitution with functional foods and beverages offering similar benefits. Growing health consciousness among consumers, particularly the rising middle class, is driving demand. Finally, M&A activity remains an important strategy for growth and market consolidation.
- Market Share: Top 5 players hold approximately xx% of the market (2024).
- M&A Deal Counts: An average of xx deals per year were recorded during 2019-2024.
APAC Sports Nutrition Industry Industry Trends & Analysis
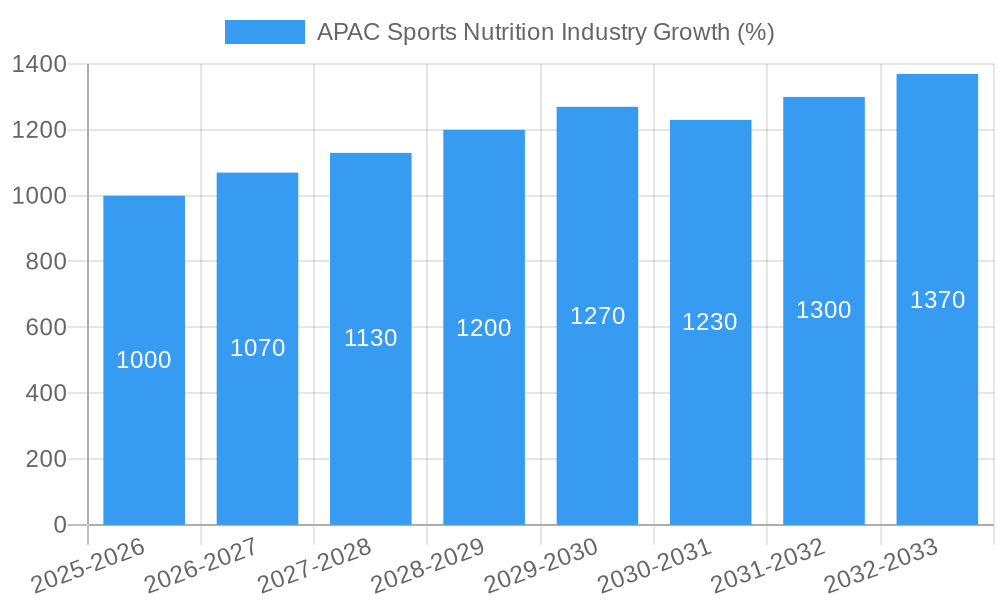
The APAC sports nutrition market demonstrates robust growth, driven by several key factors. The rising health consciousness and fitness culture, particularly among millennials and Gen Z, fuels the demand for sports nutrition products. Technological advancements in product formulation, such as the incorporation of functional ingredients and innovative delivery systems, are enhancing product appeal. Changing consumer preferences toward natural and organic products influence product development. Intense competition among established players and emerging brands shapes market dynamics, leading to price wars and innovation. The market is projected to experience a CAGR of xx% during the forecast period (2025-2033), achieving a market value of approximately $xx Million by 2033. Market penetration in key segments shows significant growth potential, particularly in developing economies.
Leading Markets & Segments in APAC Sports Nutrition Industry
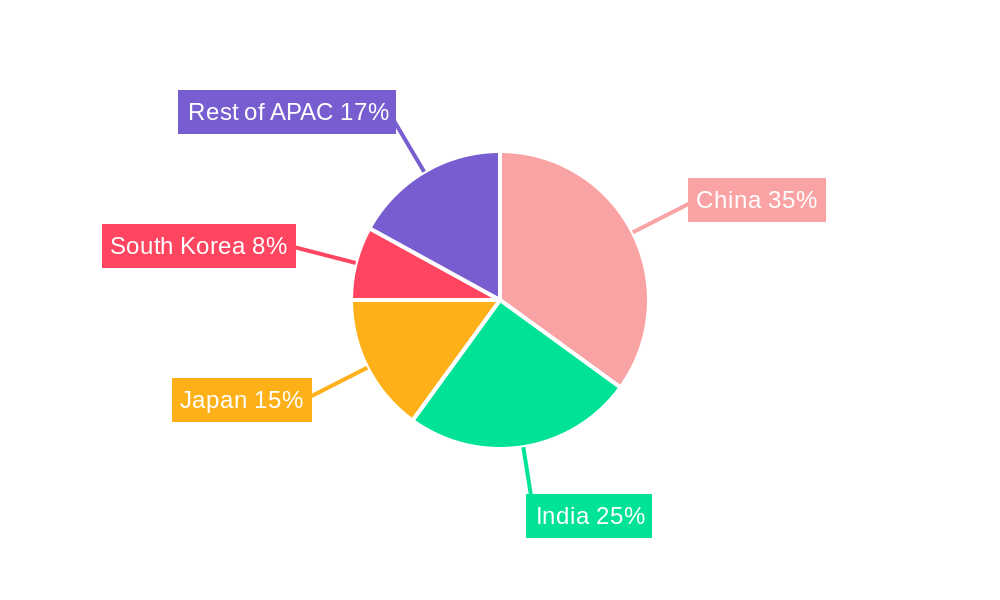
The APAC sports nutrition market is dominated by several key regions and segments. China and India are leading markets, fueled by robust economic growth, rising disposable incomes, and growing fitness awareness. Within product types, sports supplements hold the largest market share, driven by the increasing popularity of strength training and bodybuilding. Supermarkets/hypermarkets represent the largest distribution channel, due to extensive reach and established infrastructure.
Key Drivers by Segment:
- China & India (Regional): Rapid economic growth, rising disposable incomes, and a burgeoning fitness culture. Expanding retail infrastructure also plays a critical role.
- Sports Supplements (Product Type): Growing awareness of the benefits of protein and other supplements for muscle growth and recovery.
- Supermarkets/Hypermarkets (Distribution Channel): Wide reach, established infrastructure, and consumer familiarity.
APAC Sports Nutrition Industry Product Developments
Recent years have seen significant innovations in APAC sports nutrition. Brands are incorporating advanced ingredients such as plant-based protein sources, functional mushrooms, and adaptogens to cater to the growing demand for natural and organic products. Improved delivery systems, such as convenient ready-to-drink formats and specialized formulations, enhance user experience. Technological advancements drive improvements in product efficacy, absorption, and bioavailability. This focus on product innovation secures a strong market position and attracts a wider customer base.
Key Drivers of APAC Sports Nutrition Industry Growth
The APAC sports nutrition industry's growth is driven by a confluence of factors. Technological advancements, such as superior protein extraction techniques and delivery methods, enhance product quality. Favourable economic conditions, including rising disposable incomes, particularly in emerging economies, boost consumer spending on health and wellness. Supportive government regulations regarding product labeling and safety standards encourage market growth. The increasing adoption of a health-conscious lifestyle contributes significantly to expanding demand.
Challenges in the APAC Sports Nutrition Industry Market
Despite its potential, the APAC sports nutrition industry faces challenges. Strict regulatory environments and varying food safety regulations across different APAC countries hinder market expansion. Supply chain complexities and the potential for ingredient shortages pose a risk. Intense competition among established multinational corporations and rapidly growing local brands puts pressure on profit margins. These challenges necessitate strategic planning and risk mitigation strategies for sustained growth.
Emerging Opportunities in APAC Sports Nutrition Industry
The APAC sports nutrition market presents significant long-term growth opportunities. Technological breakthroughs in personalized nutrition and the development of scientifically validated functional foods and supplements will open new avenues. Strategic partnerships between established brands and emerging technology companies will drive innovation. Market expansion into underserved regions with growing health consciousness will further fuel industry growth.
Leading Players in the APAC Sports Nutrition Industry Sector
- Otsuka Pharmaceutical Co Ltd
- Herbalife International of America Inc
- Abbott Nutrition
- PepsiCo Inc
- The Coca Cola Company
- Glanbia PLC
- Cliff Bar & Company
- Zywie Ventures Pvt Ltd
- Muscleblaze
- Healthkart
- General Nutrition Centers Inc
Key Milestones in APAC Sports Nutrition Industry Industry
- August 2022: The Coca-Cola Company launched Limca Sportz, a glucose+electrolyte sports drink. This expansion into the sports nutrition segment by a major beverage company indicates increased market interest.
- September 2022: HRX and OZiva partnered to launch HRX Agame, a new sports & performance nutrition brand in India. This collaboration showcases strategic partnerships driving growth in the Indian market.
- April 2023: Genetic Nutrition, a UK brand, launched its sports nutrition supplements in India. This entry of international brands highlights the growing appeal of the Indian market.
Strategic Outlook for APAC Sports Nutrition Industry Market
The APAC sports nutrition market shows immense potential for future growth. Strategic investments in research and development, particularly in personalized nutrition and innovative product formats, will be crucial. Building strong brands and establishing effective distribution networks are key to market success. Strategic partnerships and acquisitions will enable companies to expand their market reach and diversify their product portfolio. Focusing on sustainability and ethical sourcing will attract health-conscious consumers and strengthen brand reputation. The future holds immense potential for companies that can adapt to the ever-evolving needs and preferences of the APAC consumer.
APAC Sports Nutrition Industry Segmentation
-
1. Product Type
- 1.1. Sports Food
- 1.2. Sports Drinks
- 1.3. Sports Supplements
-
2. Distribution Channel
- 2.1. Supermarkets/Hypermarkets
- 2.2. Convenience Stores
- 2.3. Specialty Stores
- 2.4. Online Stores
- 2.5. Other Distribution Channels
-
3. Geography
- 3.1. China
- 3.2. Japan
- 3.3. India
- 3.4. Australia
- 3.5. Rest of Asia-Pacific
APAC Sports Nutrition Industry Segmentation By Geography
- 1. China
- 2. Japan
- 3. India
- 4. Australia
- 5. Rest of Asia Pacific
APAC Sports Nutrition Industry REPORT HIGHLIGHTS
| Aspects | Details |
|---|---|
| Study Period | 2019-2033 |
| Base Year | 2024 |
| Estimated Year | 2025 |
| Forecast Period | 2025-2033 |
| Historical Period | 2019-2024 |
| Growth Rate | CAGR of 6.64% from 2019-2033 |
| Segmentation |
|
Table of Contents
- 1. Introduction
- 1.1. Research Scope
- 1.2. Market Segmentation
- 1.3. Research Methodology
- 1.4. Definitions and Assumptions
- 2. Executive Summary
- 2.1. Introduction
- 3. Market Dynamics
- 3.1. Introduction
- 3.2. Market Drivers
- 3.2.1. Increasing Sports Participation; Increasing Awareness about Health and Fitness
- 3.3. Market Restrains
- 3.3.1. Adverse Effects of Overconsumption of Products
- 3.4. Market Trends
- 3.4.1. Increasing Sports Participation to Boost Market Growth
- 4. Market Factor Analysis
- 4.1. Porters Five Forces
- 4.2. Supply/Value Chain
- 4.3. PESTEL analysis
- 4.4. Market Entropy
- 4.5. Patent/Trademark Analysis
- 5. Global APAC Sports Nutrition Industry Analysis, Insights and Forecast, 2019-2031
- 5.1. Market Analysis, Insights and Forecast - by Product Type
- 5.1.1. Sports Food
- 5.1.2. Sports Drinks
- 5.1.3. Sports Supplements
- 5.2. Market Analysis, Insights and Forecast - by Distribution Channel
- 5.2.1. Supermarkets/Hypermarkets
- 5.2.2. Convenience Stores
- 5.2.3. Specialty Stores
- 5.2.4. Online Stores
- 5.2.5. Other Distribution Channels
- 5.3. Market Analysis, Insights and Forecast - by Geography
- 5.3.1. China
- 5.3.2. Japan
- 5.3.3. India
- 5.3.4. Australia
- 5.3.5. Rest of Asia-Pacific
- 5.4. Market Analysis, Insights and Forecast - by Region
- 5.4.1. China
- 5.4.2. Japan
- 5.4.3. India
- 5.4.4. Australia
- 5.4.5. Rest of Asia Pacific
- 5.1. Market Analysis, Insights and Forecast - by Product Type
- 6. China APAC Sports Nutrition Industry Analysis, Insights and Forecast, 2019-2031
- 6.1. Market Analysis, Insights and Forecast - by Product Type
- 6.1.1. Sports Food
- 6.1.2. Sports Drinks
- 6.1.3. Sports Supplements
- 6.2. Market Analysis, Insights and Forecast - by Distribution Channel
- 6.2.1. Supermarkets/Hypermarkets
- 6.2.2. Convenience Stores
- 6.2.3. Specialty Stores
- 6.2.4. Online Stores
- 6.2.5. Other Distribution Channels
- 6.3. Market Analysis, Insights and Forecast - by Geography
- 6.3.1. China
- 6.3.2. Japan
- 6.3.3. India
- 6.3.4. Australia
- 6.3.5. Rest of Asia-Pacific
- 6.1. Market Analysis, Insights and Forecast - by Product Type
- 7. Japan APAC Sports Nutrition Industry Analysis, Insights and Forecast, 2019-2031
- 7.1. Market Analysis, Insights and Forecast - by Product Type
- 7.1.1. Sports Food
- 7.1.2. Sports Drinks
- 7.1.3. Sports Supplements
- 7.2. Market Analysis, Insights and Forecast - by Distribution Channel
- 7.2.1. Supermarkets/Hypermarkets
- 7.2.2. Convenience Stores
- 7.2.3. Specialty Stores
- 7.2.4. Online Stores
- 7.2.5. Other Distribution Channels
- 7.3. Market Analysis, Insights and Forecast - by Geography
- 7.3.1. China
- 7.3.2. Japan
- 7.3.3. India
- 7.3.4. Australia
- 7.3.5. Rest of Asia-Pacific
- 7.1. Market Analysis, Insights and Forecast - by Product Type
- 8. India APAC Sports Nutrition Industry Analysis, Insights and Forecast, 2019-2031
- 8.1. Market Analysis, Insights and Forecast - by Product Type
- 8.1.1. Sports Food
- 8.1.2. Sports Drinks
- 8.1.3. Sports Supplements
- 8.2. Market Analysis, Insights and Forecast - by Distribution Channel
- 8.2.1. Supermarkets/Hypermarkets
- 8.2.2. Convenience Stores
- 8.2.3. Specialty Stores
- 8.2.4. Online Stores
- 8.2.5. Other Distribution Channels
- 8.3. Market Analysis, Insights and Forecast - by Geography
- 8.3.1. China
- 8.3.2. Japan
- 8.3.3. India
- 8.3.4. Australia
- 8.3.5. Rest of Asia-Pacific
- 8.1. Market Analysis, Insights and Forecast - by Product Type
- 9. Australia APAC Sports Nutrition Industry Analysis, Insights and Forecast, 2019-2031
- 9.1. Market Analysis, Insights and Forecast - by Product Type
- 9.1.1. Sports Food
- 9.1.2. Sports Drinks
- 9.1.3. Sports Supplements
- 9.2. Market Analysis, Insights and Forecast - by Distribution Channel
- 9.2.1. Supermarkets/Hypermarkets
- 9.2.2. Convenience Stores
- 9.2.3. Specialty Stores
- 9.2.4. Online Stores
- 9.2.5. Other Distribution Channels
- 9.3. Market Analysis, Insights and Forecast - by Geography
- 9.3.1. China
- 9.3.2. Japan
- 9.3.3. India
- 9.3.4. Australia
- 9.3.5. Rest of Asia-Pacific
- 9.1. Market Analysis, Insights and Forecast - by Product Type
- 10. Rest of Asia Pacific APAC Sports Nutrition Industry Analysis, Insights and Forecast, 2019-2031
- 10.1. Market Analysis, Insights and Forecast - by Product Type
- 10.1.1. Sports Food
- 10.1.2. Sports Drinks
- 10.1.3. Sports Supplements
- 10.2. Market Analysis, Insights and Forecast - by Distribution Channel
- 10.2.1. Supermarkets/Hypermarkets
- 10.2.2. Convenience Stores
- 10.2.3. Specialty Stores
- 10.2.4. Online Stores
- 10.2.5. Other Distribution Channels
- 10.3. Market Analysis, Insights and Forecast - by Geography
- 10.3.1. China
- 10.3.2. Japan
- 10.3.3. India
- 10.3.4. Australia
- 10.3.5. Rest of Asia-Pacific
- 10.1. Market Analysis, Insights and Forecast - by Product Type
- 11. North America APAC Sports Nutrition Industry Analysis, Insights and Forecast, 2019-2031
- 11.1. Market Analysis, Insights and Forecast - By Country/Sub-region
- 11.1.1 United States
- 11.1.2 Canada
- 11.1.3 Mexico
- 12. Europe APAC Sports Nutrition Industry Analysis, Insights and Forecast, 2019-2031
- 12.1. Market Analysis, Insights and Forecast - By Country/Sub-region
- 12.1.1 Germany
- 12.1.2 United Kingdom
- 12.1.3 France
- 12.1.4 Spain
- 12.1.5 Italy
- 12.1.6 Spain
- 12.1.7 Belgium
- 12.1.8 Netherland
- 12.1.9 Nordics
- 12.1.10 Rest of Europe
- 13. Asia Pacific APAC Sports Nutrition Industry Analysis, Insights and Forecast, 2019-2031
- 13.1. Market Analysis, Insights and Forecast - By Country/Sub-region
- 13.1.1 China
- 13.1.2 Japan
- 13.1.3 India
- 13.1.4 South Korea
- 13.1.5 Southeast Asia
- 13.1.6 Australia
- 13.1.7 Indonesia
- 13.1.8 Phillipes
- 13.1.9 Singapore
- 13.1.10 Thailandc
- 13.1.11 Rest of Asia Pacific
- 14. South America APAC Sports Nutrition Industry Analysis, Insights and Forecast, 2019-2031
- 14.1. Market Analysis, Insights and Forecast - By Country/Sub-region
- 14.1.1 Brazil
- 14.1.2 Argentina
- 14.1.3 Peru
- 14.1.4 Chile
- 14.1.5 Colombia
- 14.1.6 Ecuador
- 14.1.7 Venezuela
- 14.1.8 Rest of South America
- 15. North America APAC Sports Nutrition Industry Analysis, Insights and Forecast, 2019-2031
- 15.1. Market Analysis, Insights and Forecast - By Country/Sub-region
- 15.1.1 United States
- 15.1.2 Canada
- 15.1.3 Mexico
- 16. MEA APAC Sports Nutrition Industry Analysis, Insights and Forecast, 2019-2031
- 16.1. Market Analysis, Insights and Forecast - By Country/Sub-region
- 16.1.1 United Arab Emirates
- 16.1.2 Saudi Arabia
- 16.1.3 South Africa
- 16.1.4 Rest of Middle East and Africa
- 17. Competitive Analysis
- 17.1. Global Market Share Analysis 2024
- 17.2. Company Profiles
- 17.2.1 Otsuka Pharmaceutical Co Ltd
- 17.2.1.1. Overview
- 17.2.1.2. Products
- 17.2.1.3. SWOT Analysis
- 17.2.1.4. Recent Developments
- 17.2.1.5. Financials (Based on Availability)
- 17.2.2 Herbalife International of America Inc
- 17.2.2.1. Overview
- 17.2.2.2. Products
- 17.2.2.3. SWOT Analysis
- 17.2.2.4. Recent Developments
- 17.2.2.5. Financials (Based on Availability)
- 17.2.3 Abbott Nutrition
- 17.2.3.1. Overview
- 17.2.3.2. Products
- 17.2.3.3. SWOT Analysis
- 17.2.3.4. Recent Developments
- 17.2.3.5. Financials (Based on Availability)
- 17.2.4 PepsiCo Inc
- 17.2.4.1. Overview
- 17.2.4.2. Products
- 17.2.4.3. SWOT Analysis
- 17.2.4.4. Recent Developments
- 17.2.4.5. Financials (Based on Availability)
- 17.2.5 The Coca Cola Company
- 17.2.5.1. Overview
- 17.2.5.2. Products
- 17.2.5.3. SWOT Analysis
- 17.2.5.4. Recent Developments
- 17.2.5.5. Financials (Based on Availability)
- 17.2.6 Glanbia PLC
- 17.2.6.1. Overview
- 17.2.6.2. Products
- 17.2.6.3. SWOT Analysis
- 17.2.6.4. Recent Developments
- 17.2.6.5. Financials (Based on Availability)
- 17.2.7 Cliff Bar & Company
- 17.2.7.1. Overview
- 17.2.7.2. Products
- 17.2.7.3. SWOT Analysis
- 17.2.7.4. Recent Developments
- 17.2.7.5. Financials (Based on Availability)
- 17.2.8 Zywie Ventures Pvt Ltd
- 17.2.8.1. Overview
- 17.2.8.2. Products
- 17.2.8.3. SWOT Analysis
- 17.2.8.4. Recent Developments
- 17.2.8.5. Financials (Based on Availability)
- 17.2.9 Muscleblaze
- 17.2.9.1. Overview
- 17.2.9.2. Products
- 17.2.9.3. SWOT Analysis
- 17.2.9.4. Recent Developments
- 17.2.9.5. Financials (Based on Availability)
- 17.2.10 Healthkart
- 17.2.10.1. Overview
- 17.2.10.2. Products
- 17.2.10.3. SWOT Analysis
- 17.2.10.4. Recent Developments
- 17.2.10.5. Financials (Based on Availability)
- 17.2.11 General Nutrition Centers Inc
- 17.2.11.1. Overview
- 17.2.11.2. Products
- 17.2.11.3. SWOT Analysis
- 17.2.11.4. Recent Developments
- 17.2.11.5. Financials (Based on Availability)
- 17.2.1 Otsuka Pharmaceutical Co Ltd
List of Figures
- Figure 1: Global APAC Sports Nutrition Industry Revenue Breakdown (Million, %) by Region 2024 & 2032
- Figure 2: North America APAC Sports Nutrition Industry Revenue (Million), by Country 2024 & 2032
- Figure 3: North America APAC Sports Nutrition Industry Revenue Share (%), by Country 2024 & 2032
- Figure 4: Europe APAC Sports Nutrition Industry Revenue (Million), by Country 2024 & 2032
- Figure 5: Europe APAC Sports Nutrition Industry Revenue Share (%), by Country 2024 & 2032
- Figure 6: Asia Pacific APAC Sports Nutrition Industry Revenue (Million), by Country 2024 & 2032
- Figure 7: Asia Pacific APAC Sports Nutrition Industry Revenue Share (%), by Country 2024 & 2032
- Figure 8: South America APAC Sports Nutrition Industry Revenue (Million), by Country 2024 & 2032
- Figure 9: South America APAC Sports Nutrition Industry Revenue Share (%), by Country 2024 & 2032
- Figure 10: North America APAC Sports Nutrition Industry Revenue (Million), by Country 2024 & 2032
- Figure 11: North America APAC Sports Nutrition Industry Revenue Share (%), by Country 2024 & 2032
- Figure 12: MEA APAC Sports Nutrition Industry Revenue (Million), by Country 2024 & 2032
- Figure 13: MEA APAC Sports Nutrition Industry Revenue Share (%), by Country 2024 & 2032
- Figure 14: China APAC Sports Nutrition Industry Revenue (Million), by Product Type 2024 & 2032
- Figure 15: China APAC Sports Nutrition Industry Revenue Share (%), by Product Type 2024 & 2032
- Figure 16: China APAC Sports Nutrition Industry Revenue (Million), by Distribution Channel 2024 & 2032
- Figure 17: China APAC Sports Nutrition Industry Revenue Share (%), by Distribution Channel 2024 & 2032
- Figure 18: China APAC Sports Nutrition Industry Revenue (Million), by Geography 2024 & 2032
- Figure 19: China APAC Sports Nutrition Industry Revenue Share (%), by Geography 2024 & 2032
- Figure 20: China APAC Sports Nutrition Industry Revenue (Million), by Country 2024 & 2032
- Figure 21: China APAC Sports Nutrition Industry Revenue Share (%), by Country 2024 & 2032
- Figure 22: Japan APAC Sports Nutrition Industry Revenue (Million), by Product Type 2024 & 2032
- Figure 23: Japan APAC Sports Nutrition Industry Revenue Share (%), by Product Type 2024 & 2032
- Figure 24: Japan APAC Sports Nutrition Industry Revenue (Million), by Distribution Channel 2024 & 2032
- Figure 25: Japan APAC Sports Nutrition Industry Revenue Share (%), by Distribution Channel 2024 & 2032
- Figure 26: Japan APAC Sports Nutrition Industry Revenue (Million), by Geography 2024 & 2032
- Figure 27: Japan APAC Sports Nutrition Industry Revenue Share (%), by Geography 2024 & 2032
- Figure 28: Japan APAC Sports Nutrition Industry Revenue (Million), by Country 2024 & 2032
- Figure 29: Japan APAC Sports Nutrition Industry Revenue Share (%), by Country 2024 & 2032
- Figure 30: India APAC Sports Nutrition Industry Revenue (Million), by Product Type 2024 & 2032
- Figure 31: India APAC Sports Nutrition Industry Revenue Share (%), by Product Type 2024 & 2032
- Figure 32: India APAC Sports Nutrition Industry Revenue (Million), by Distribution Channel 2024 & 2032
- Figure 33: India APAC Sports Nutrition Industry Revenue Share (%), by Distribution Channel 2024 & 2032
- Figure 34: India APAC Sports Nutrition Industry Revenue (Million), by Geography 2024 & 2032
- Figure 35: India APAC Sports Nutrition Industry Revenue Share (%), by Geography 2024 & 2032
- Figure 36: India APAC Sports Nutrition Industry Revenue (Million), by Country 2024 & 2032
- Figure 37: India APAC Sports Nutrition Industry Revenue Share (%), by Country 2024 & 2032
- Figure 38: Australia APAC Sports Nutrition Industry Revenue (Million), by Product Type 2024 & 2032
- Figure 39: Australia APAC Sports Nutrition Industry Revenue Share (%), by Product Type 2024 & 2032
- Figure 40: Australia APAC Sports Nutrition Industry Revenue (Million), by Distribution Channel 2024 & 2032
- Figure 41: Australia APAC Sports Nutrition Industry Revenue Share (%), by Distribution Channel 2024 & 2032
- Figure 42: Australia APAC Sports Nutrition Industry Revenue (Million), by Geography 2024 & 2032
- Figure 43: Australia APAC Sports Nutrition Industry Revenue Share (%), by Geography 2024 & 2032
- Figure 44: Australia APAC Sports Nutrition Industry Revenue (Million), by Country 2024 & 2032
- Figure 45: Australia APAC Sports Nutrition Industry Revenue Share (%), by Country 2024 & 2032
- Figure 46: Rest of Asia Pacific APAC Sports Nutrition Industry Revenue (Million), by Product Type 2024 & 2032
- Figure 47: Rest of Asia Pacific APAC Sports Nutrition Industry Revenue Share (%), by Product Type 2024 & 2032
- Figure 48: Rest of Asia Pacific APAC Sports Nutrition Industry Revenue (Million), by Distribution Channel 2024 & 2032
- Figure 49: Rest of Asia Pacific APAC Sports Nutrition Industry Revenue Share (%), by Distribution Channel 2024 & 2032
- Figure 50: Rest of Asia Pacific APAC Sports Nutrition Industry Revenue (Million), by Geography 2024 & 2032
- Figure 51: Rest of Asia Pacific APAC Sports Nutrition Industry Revenue Share (%), by Geography 2024 & 2032
- Figure 52: Rest of Asia Pacific APAC Sports Nutrition Industry Revenue (Million), by Country 2024 & 2032
- Figure 53: Rest of Asia Pacific APAC Sports Nutrition Industry Revenue Share (%), by Country 2024 & 2032
List of Tables
- Table 1: Global APAC Sports Nutrition Industry Revenue Million Forecast, by Region 2019 & 2032
- Table 2: Global APAC Sports Nutrition Industry Revenue Million Forecast, by Product Type 2019 & 2032
- Table 3: Global APAC Sports Nutrition Industry Revenue Million Forecast, by Distribution Channel 2019 & 2032
- Table 4: Global APAC Sports Nutrition Industry Revenue Million Forecast, by Geography 2019 & 2032
- Table 5: Global APAC Sports Nutrition Industry Revenue Million Forecast, by Region 2019 & 2032
- Table 6: Global APAC Sports Nutrition Industry Revenue Million Forecast, by Country 2019 & 2032
- Table 7: United States APAC Sports Nutrition Industry Revenue (Million) Forecast, by Application 2019 & 2032
- Table 8: Canada APAC Sports Nutrition Industry Revenue (Million) Forecast, by Application 2019 & 2032
- Table 9: Mexico APAC Sports Nutrition Industry Revenue (Million) Forecast, by Application 2019 & 2032
- Table 10: Global APAC Sports Nutrition Industry Revenue Million Forecast, by Country 2019 & 2032
- Table 11: Germany APAC Sports Nutrition Industry Revenue (Million) Forecast, by Application 2019 & 2032
- Table 12: United Kingdom APAC Sports Nutrition Industry Revenue (Million) Forecast, by Application 2019 & 2032
- Table 13: France APAC Sports Nutrition Industry Revenue (Million) Forecast, by Application 2019 & 2032
- Table 14: Spain APAC Sports Nutrition Industry Revenue (Million) Forecast, by Application 2019 & 2032
- Table 15: Italy APAC Sports Nutrition Industry Revenue (Million) Forecast, by Application 2019 & 2032
- Table 16: Spain APAC Sports Nutrition Industry Revenue (Million) Forecast, by Application 2019 & 2032
- Table 17: Belgium APAC Sports Nutrition Industry Revenue (Million) Forecast, by Application 2019 & 2032
- Table 18: Netherland APAC Sports Nutrition Industry Revenue (Million) Forecast, by Application 2019 & 2032
- Table 19: Nordics APAC Sports Nutrition Industry Revenue (Million) Forecast, by Application 2019 & 2032
- Table 20: Rest of Europe APAC Sports Nutrition Industry Revenue (Million) Forecast, by Application 2019 & 2032
- Table 21: Global APAC Sports Nutrition Industry Revenue Million Forecast, by Country 2019 & 2032
- Table 22: China APAC Sports Nutrition Industry Revenue (Million) Forecast, by Application 2019 & 2032
- Table 23: Japan APAC Sports Nutrition Industry Revenue (Million) Forecast, by Application 2019 & 2032
- Table 24: India APAC Sports Nutrition Industry Revenue (Million) Forecast, by Application 2019 & 2032
- Table 25: South Korea APAC Sports Nutrition Industry Revenue (Million) Forecast, by Application 2019 & 2032
- Table 26: Southeast Asia APAC Sports Nutrition Industry Revenue (Million) Forecast, by Application 2019 & 2032
- Table 27: Australia APAC Sports Nutrition Industry Revenue (Million) Forecast, by Application 2019 & 2032
- Table 28: Indonesia APAC Sports Nutrition Industry Revenue (Million) Forecast, by Application 2019 & 2032
- Table 29: Phillipes APAC Sports Nutrition Industry Revenue (Million) Forecast, by Application 2019 & 2032
- Table 30: Singapore APAC Sports Nutrition Industry Revenue (Million) Forecast, by Application 2019 & 2032
- Table 31: Thailandc APAC Sports Nutrition Industry Revenue (Million) Forecast, by Application 2019 & 2032
- Table 32: Rest of Asia Pacific APAC Sports Nutrition Industry Revenue (Million) Forecast, by Application 2019 & 2032
- Table 33: Global APAC Sports Nutrition Industry Revenue Million Forecast, by Country 2019 & 2032
- Table 34: Brazil APAC Sports Nutrition Industry Revenue (Million) Forecast, by Application 2019 & 2032
- Table 35: Argentina APAC Sports Nutrition Industry Revenue (Million) Forecast, by Application 2019 & 2032
- Table 36: Peru APAC Sports Nutrition Industry Revenue (Million) Forecast, by Application 2019 & 2032
- Table 37: Chile APAC Sports Nutrition Industry Revenue (Million) Forecast, by Application 2019 & 2032
- Table 38: Colombia APAC Sports Nutrition Industry Revenue (Million) Forecast, by Application 2019 & 2032
- Table 39: Ecuador APAC Sports Nutrition Industry Revenue (Million) Forecast, by Application 2019 & 2032
- Table 40: Venezuela APAC Sports Nutrition Industry Revenue (Million) Forecast, by Application 2019 & 2032
- Table 41: Rest of South America APAC Sports Nutrition Industry Revenue (Million) Forecast, by Application 2019 & 2032
- Table 42: Global APAC Sports Nutrition Industry Revenue Million Forecast, by Country 2019 & 2032
- Table 43: United States APAC Sports Nutrition Industry Revenue (Million) Forecast, by Application 2019 & 2032
- Table 44: Canada APAC Sports Nutrition Industry Revenue (Million) Forecast, by Application 2019 & 2032
- Table 45: Mexico APAC Sports Nutrition Industry Revenue (Million) Forecast, by Application 2019 & 2032
- Table 46: Global APAC Sports Nutrition Industry Revenue Million Forecast, by Country 2019 & 2032
- Table 47: United Arab Emirates APAC Sports Nutrition Industry Revenue (Million) Forecast, by Application 2019 & 2032
- Table 48: Saudi Arabia APAC Sports Nutrition Industry Revenue (Million) Forecast, by Application 2019 & 2032
- Table 49: South Africa APAC Sports Nutrition Industry Revenue (Million) Forecast, by Application 2019 & 2032
- Table 50: Rest of Middle East and Africa APAC Sports Nutrition Industry Revenue (Million) Forecast, by Application 2019 & 2032
- Table 51: Global APAC Sports Nutrition Industry Revenue Million Forecast, by Product Type 2019 & 2032
- Table 52: Global APAC Sports Nutrition Industry Revenue Million Forecast, by Distribution Channel 2019 & 2032
- Table 53: Global APAC Sports Nutrition Industry Revenue Million Forecast, by Geography 2019 & 2032
- Table 54: Global APAC Sports Nutrition Industry Revenue Million Forecast, by Country 2019 & 2032
- Table 55: Global APAC Sports Nutrition Industry Revenue Million Forecast, by Product Type 2019 & 2032
- Table 56: Global APAC Sports Nutrition Industry Revenue Million Forecast, by Distribution Channel 2019 & 2032
- Table 57: Global APAC Sports Nutrition Industry Revenue Million Forecast, by Geography 2019 & 2032
- Table 58: Global APAC Sports Nutrition Industry Revenue Million Forecast, by Country 2019 & 2032
- Table 59: Global APAC Sports Nutrition Industry Revenue Million Forecast, by Product Type 2019 & 2032
- Table 60: Global APAC Sports Nutrition Industry Revenue Million Forecast, by Distribution Channel 2019 & 2032
- Table 61: Global APAC Sports Nutrition Industry Revenue Million Forecast, by Geography 2019 & 2032
- Table 62: Global APAC Sports Nutrition Industry Revenue Million Forecast, by Country 2019 & 2032
- Table 63: Global APAC Sports Nutrition Industry Revenue Million Forecast, by Product Type 2019 & 2032
- Table 64: Global APAC Sports Nutrition Industry Revenue Million Forecast, by Distribution Channel 2019 & 2032
- Table 65: Global APAC Sports Nutrition Industry Revenue Million Forecast, by Geography 2019 & 2032
- Table 66: Global APAC Sports Nutrition Industry Revenue Million Forecast, by Country 2019 & 2032
- Table 67: Global APAC Sports Nutrition Industry Revenue Million Forecast, by Product Type 2019 & 2032
- Table 68: Global APAC Sports Nutrition Industry Revenue Million Forecast, by Distribution Channel 2019 & 2032
- Table 69: Global APAC Sports Nutrition Industry Revenue Million Forecast, by Geography 2019 & 2032
- Table 70: Global APAC Sports Nutrition Industry Revenue Million Forecast, by Country 2019 & 2032
Frequently Asked Questions
1. What is the projected Compound Annual Growth Rate (CAGR) of the APAC Sports Nutrition Industry?
The projected CAGR is approximately 6.64%.
2. Which companies are prominent players in the APAC Sports Nutrition Industry?
Key companies in the market include Otsuka Pharmaceutical Co Ltd , Herbalife International of America Inc, Abbott Nutrition, PepsiCo Inc, The Coca Cola Company, Glanbia PLC, Cliff Bar & Company, Zywie Ventures Pvt Ltd, Muscleblaze, Healthkart, General Nutrition Centers Inc.
3. What are the main segments of the APAC Sports Nutrition Industry?
The market segments include Product Type, Distribution Channel, Geography.
4. Can you provide details about the market size?
The market size is estimated to be USD XX Million as of 2022.
5. What are some drivers contributing to market growth?
Increasing Sports Participation; Increasing Awareness about Health and Fitness.
6. What are the notable trends driving market growth?
Increasing Sports Participation to Boost Market Growth.
7. Are there any restraints impacting market growth?
Adverse Effects of Overconsumption of Products.
8. Can you provide examples of recent developments in the market?
April 2023: UK sports nutrition brand Genetic Nutrition launched its high-quality sports nutrition supplements in India. The brand's range of supplements includes protein powders, amino acids, and vitamins formulated using best-in-class ingredients for maximum effectiveness.
9. What pricing options are available for accessing the report?
Pricing options include single-user, multi-user, and enterprise licenses priced at USD 4750, USD 5250, and USD 8750 respectively.
10. Is the market size provided in terms of value or volume?
The market size is provided in terms of value, measured in Million.
11. Are there any specific market keywords associated with the report?
Yes, the market keyword associated with the report is "APAC Sports Nutrition Industry," which aids in identifying and referencing the specific market segment covered.
12. How do I determine which pricing option suits my needs best?
The pricing options vary based on user requirements and access needs. Individual users may opt for single-user licenses, while businesses requiring broader access may choose multi-user or enterprise licenses for cost-effective access to the report.
13. Are there any additional resources or data provided in the APAC Sports Nutrition Industry report?
While the report offers comprehensive insights, it's advisable to review the specific contents or supplementary materials provided to ascertain if additional resources or data are available.
14. How can I stay updated on further developments or reports in the APAC Sports Nutrition Industry?
To stay informed about further developments, trends, and reports in the APAC Sports Nutrition Industry, consider subscribing to industry newsletters, following relevant companies and organizations, or regularly checking reputable industry news sources and publications.
Methodology
Step 1 - Identification of Relevant Samples Size from Population Database


Step 2 - Approaches for Defining Global Market Size (Value, Volume* & Price*)

Note*: In applicable scenarios
Step 3 - Data Sources
Primary Research
- Web Analytics
- Survey Reports
- Research Institute
- Latest Research Reports
- Opinion Leaders
Secondary Research
- Annual Reports
- White Paper
- Latest Press Release
- Industry Association
- Paid Database
- Investor Presentations

Step 4 - Data Triangulation
Involves using different sources of information in order to increase the validity of a study
These sources are likely to be stakeholders in a program - participants, other researchers, program staff, other community members, and so on.
Then we put all data in single framework & apply various statistical tools to find out the dynamic on the market.
During the analysis stage, feedback from the stakeholder groups would be compared to determine areas of agreement as well as areas of divergence
