

Key Insights
The Asia-Pacific (APAC) medical imaging devices market is poised for significant expansion, fueled by the rising incidence of chronic diseases, an aging demographic, enhanced healthcare infrastructure, and increasing disposable income. The region's diverse healthcare ecosystem presents a landscape of both opportunity and challenge. Major economies such as China, India, and Japan are at the forefront, investing heavily in cutting-edge imaging technologies and expanding diagnostic capabilities. Concurrently, Southeast Asian nations offer substantial untapped potential, though healthcare infrastructure development varies. The market is segmented by modality, including MRI, CT, X-ray, ultrasound, and nuclear imaging, with a notable preference for cost-effective yet dependable solutions across many areas. Key application segments driving demand include cardiology, oncology, and neurology, with oncology and cardiology expected to be primary growth drivers. The increasing adoption of minimally invasive procedures and the emphasis on early diagnosis further propel market growth. The competitive environment features a blend of global leaders and regional competitors, fostering price competition and technological innovation, collectively contributing to the market's robust growth prospects.
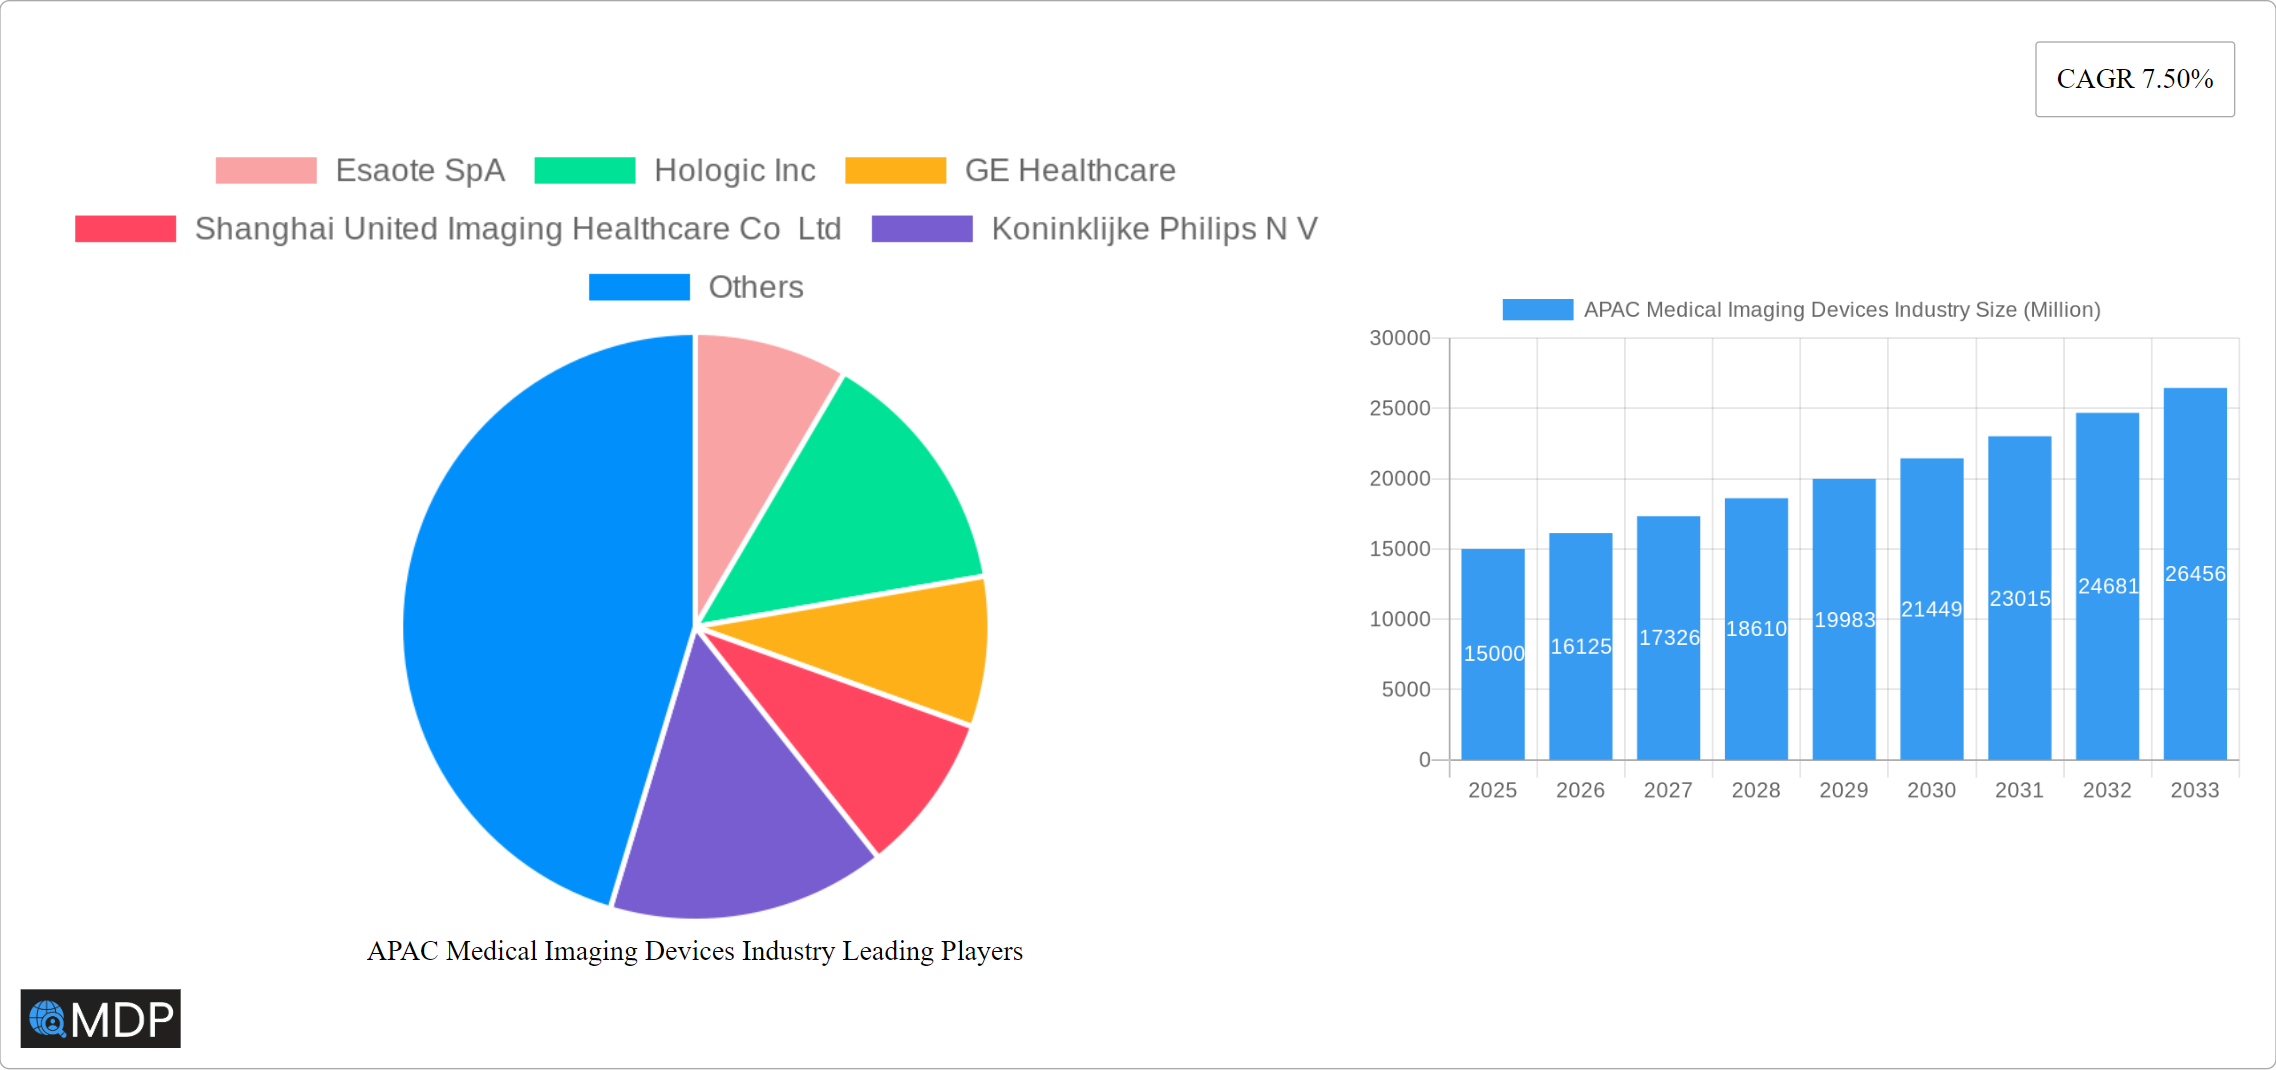
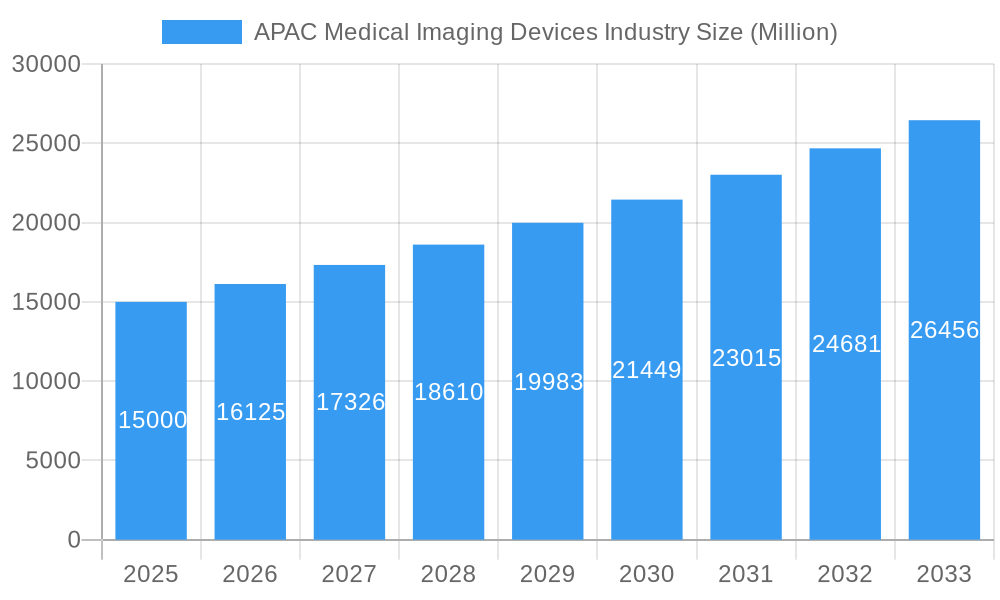
APAC Medical Imaging Devices Industry Market Size (In Billion)
The APAC medical imaging devices market is projected to achieve a Compound Annual Growth Rate (CAGR) of 8%, indicating substantial expansion over the forecast period. This growth is expected to be dynamic across the region. Developed markets like Japan and South Korea will likely focus on advanced technologies, while emerging economies such as India and Indonesia are anticipated to experience higher growth rates, driven by escalating healthcare expenditures and infrastructure development. Regulatory frameworks and government initiatives aimed at improving healthcare accessibility are crucial in shaping the market's trajectory. Continuous technological advancements, particularly in AI-powered image analysis and portable imaging systems, are further enhancing market dynamism. Persistent challenges include the demand for skilled professionals for operating and interpreting advanced imaging systems, alongside the imperative to address disparities in healthcare access among different socioeconomic groups. The market size is estimated at $143.12 billion in the base year 2025.
APAC Medical Imaging Devices Industry Company Market Share
APAC Medical Imaging Devices Industry: A Comprehensive Market Report (2019-2033)
This in-depth report provides a comprehensive analysis of the Asia-Pacific (APAC) medical imaging devices market, covering the period from 2019 to 2033. It delves into market dynamics, leading players, technological advancements, and future growth prospects, offering invaluable insights for industry stakeholders, investors, and strategic decision-makers. The report utilizes data from the historical period (2019-2024), with the base year set at 2025 and the forecast period extending to 2033. The market is segmented by modality (MRI, CT, X-ray, Ultrasound, Nuclear Imaging), application (Cardiology, Oncology, Neurology, Orthopedics, Gastroenterology, Gynecology, Other Applications), end-user (Hospital, Diagnostic Centers, Other End-Users), and specific segments like Single Photon Emission Computed Tomography (SPECT) and Mammography, offering granular market analysis. Key players analyzed include Esaote SpA, Hologic Inc, GE Healthcare, Shanghai United Imaging Healthcare Co Ltd, Koninklijke Philips N V, Siemens AG, FUJIFILM Holdings Corporation, Carestream Health, J Morita Corporation, Canon Medical Systems Corporation, Teknova Medical Systems Limited, and Shimadzu Corporation.
APAC Medical Imaging Devices Industry Market Dynamics & Concentration
The Asia-Pacific (APAC) medical imaging devices market is experiencing robust growth, fueled by a confluence of factors. These include the rising prevalence of chronic diseases like cancer, cardiovascular conditions, and diabetes; increasing healthcare expenditure, particularly in rapidly developing economies; and significant technological advancements that continuously improve diagnostic capabilities. Market concentration is moderately high, with several multinational corporations holding substantial market share. However, a dynamic ecosystem of smaller companies also thrives, often specializing in niche applications or regional markets. Estimates suggest the top five players commanded approximately 60% of the market in 2025. Innovation remains a pivotal driver, with ongoing advancements in imaging technologies leading to improved diagnostic accuracy, faster turnaround times, and ultimately, better patient outcomes. Stringent regulatory frameworks and ethical considerations, varying across different APAC nations, significantly influence market practices and product approvals. The presence of substitute technologies, such as advanced diagnostic laboratory tests and telehealth solutions, introduces competitive pressure, prompting continuous innovation and improvement. End-user trends reveal a strong preference for minimally invasive procedures and advanced imaging modalities that reduce patient discomfort and recovery times. Mergers and acquisitions (M&A) activity has been significant, with approximately xx major deals recorded between 2019 and 2024, reflecting the ongoing consolidation and expansion strategies of key players seeking to increase market dominance and geographical reach.
APAC Medical Imaging Devices Industry Industry Trends & Analysis
The APAC medical imaging devices market is projected to exhibit a robust Compound Annual Growth Rate (CAGR) of xx% during the forecast period (2025-2033). This growth is driven by several converging trends. Technological disruptions, such as the increasing integration of Artificial Intelligence (AI) for image analysis and the development of higher-resolution imaging systems, are significantly impacting market dynamics, enhancing diagnostic accuracy, and improving workflow efficiency. Consumer preferences are evolving towards advanced imaging techniques that offer quicker, more comfortable, and less invasive diagnostic experiences. The competitive landscape is intensely dynamic, with established companies and emerging players focusing on product innovation, strategic partnerships (including collaborations with hospitals and healthcare providers), and aggressive geographical expansion to maintain a competitive edge. Market penetration of advanced imaging modalities, particularly Magnetic Resonance Imaging (MRI) and Computed Tomography (CT), is steadily increasing across the region, although penetration rates vary considerably across different APAC countries due to factors like healthcare infrastructure and economic development. The market penetration of AI-powered imaging analysis systems is currently estimated at approximately xx% and is projected to reach xx% by 2033, representing a substantial growth opportunity.
Leading Markets & Segments in APAC Medical Imaging Devices Industry
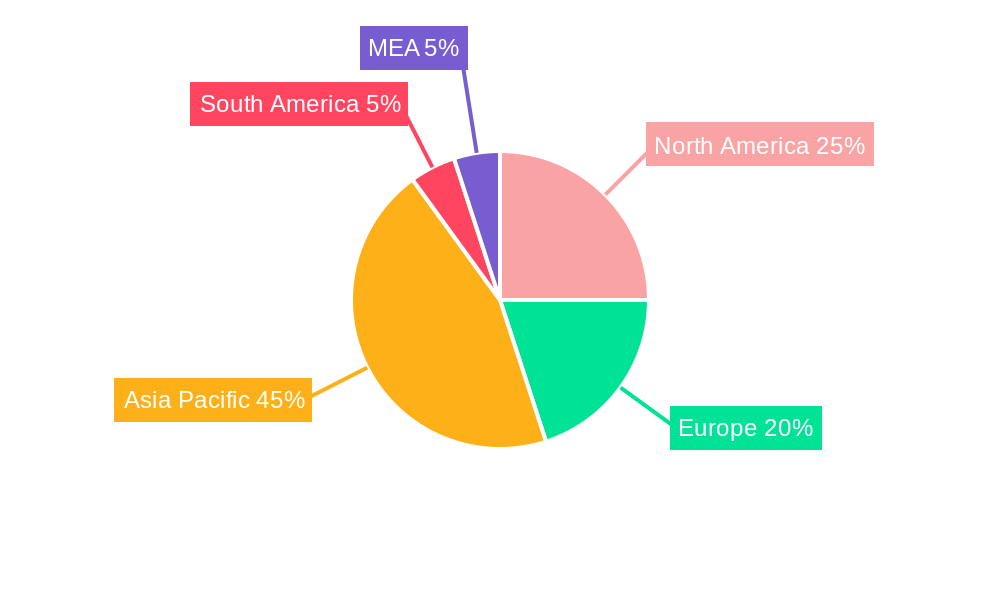
Dominant Regions: China and India are the leading markets within APAC, exhibiting significant growth driven by their large populations, increasing healthcare infrastructure development, and rising disposable incomes. Japan and South Korea also contribute substantially.
Dominant Modalities: CT and X-ray systems currently dominate the market, owing to their wide availability and relative affordability compared to MRI and Nuclear Imaging. Ultrasound systems have considerable market share, due to their portability and affordability. However, the market share of MRI and Nuclear Imaging is projected to rise moderately, driven by increasing demand for high-resolution images for specialized applications.
Dominant Applications: Oncology, cardiology, and neurology are leading application areas. Growth in these segments is fueled by rising incidence rates of cancers, cardiovascular diseases, and neurological disorders.
Dominant End-Users: Hospitals remain the dominant end-user segment, due to their extensive diagnostic capabilities and high patient volumes. Diagnostic centers are also exhibiting significant growth, owing to their specialized services and increasing convenience.
Key Drivers: Factors such as rising government investments in healthcare infrastructure, favorable economic policies supporting healthcare technology, and increasing awareness about disease prevention and early detection contribute significantly to the growth of specific segments and regions.
APAC Medical Imaging Devices Industry Product Developments
Recent product innovations are characterized by a focus on miniaturization, leading to more compact and portable systems; substantial improvements in image quality, including enhanced contrast resolution and spatial resolution; the widespread adoption of AI-powered image analysis for improved diagnostic accuracy and workflow automation; and increased portability, enabling wider access in remote or underserved areas. Manufacturers are emphasizing systems with advanced features such as reduced radiation exposure (for X-ray and CT systems), faster scanning speeds, and user-friendly interfaces. These improvements directly address specific market needs for enhanced diagnostic accuracy, reduced costs, improved patient experience, and streamlined workflows. The seamless integration of AI in image analysis is revolutionizing radiology departments, streamlining workflows, and ultimately improving both diagnostic accuracy and radiologist efficiency.
Key Drivers of APAC Medical Imaging Devices Industry Growth
Several key factors are driving the remarkable growth of the APAC medical imaging devices market. Technological advancements, such as AI-powered image analysis, improved imaging techniques (e.g., higher resolution, 3D imaging), and the development of new modalities, are primary growth drivers. Rising healthcare expenditure, fueled by both government initiatives and increasing private healthcare spending, is another significant factor. Governments across the region are investing heavily in upgrading healthcare infrastructure and expanding access to advanced diagnostic services. Growing awareness regarding the importance of preventive healthcare and early diagnosis, coupled with increasing health literacy among the population, is playing a crucial role. Furthermore, increasingly favorable regulatory frameworks in several APAC countries, aiming to streamline approvals and encourage innovation, are further accelerating market growth.
Challenges in the APAC Medical Imaging Devices Industry Market
High initial investment costs for advanced imaging equipment pose a barrier to entry for smaller players. Stringent regulatory approvals and compliance requirements can delay product launches and increase costs. Supply chain disruptions and fluctuations in raw material prices can impact manufacturing and profitability. Intense competition among established players and emerging companies creates challenges for market share acquisition and pricing strategies. The impact of these factors on market growth is estimated to be approximately xx Million annually.
Emerging Opportunities in APAP Medical Imaging Devices Industry
Emerging opportunities are plentiful within the APAC market. The increasing adoption of telehealth and remote diagnostics offers potential for growth in the provision of imaging services across geographically dispersed populations. Strategic partnerships between medical device manufacturers and healthcare providers are likely to improve efficiency and broaden access to advanced imaging technology. Expansion into underserved markets and emerging economies within APAC offers significant growth potential. Technological breakthroughs in AI and other related fields are also expected to significantly boost market growth in the future.
Leading Players in the APAC Medical Imaging Devices Industry Sector
- Esaote SpA
- Hologic Inc
- GE Healthcare
- Shanghai United Imaging Healthcare Co Ltd
- Koninklijke Philips N V
- Siemens AG
- FUJIFILM Holdings Corporation
- Carestream Health
- J Morita Corporation
- Canon Medical Systems Corporation
- Teknova Medical Systems Limited
- Shimadzu Corporation
Key Milestones in APAC Medical Imaging Devices Industry Industry
- October 2022: Luxonus Inc. received approval to market its photoacoustic 3D imaging system in Japan, signifying a significant expansion in the range of available imaging technologies and potentially opening new diagnostic avenues.
- February 2022: Siemens Healthineers and Universal Medical Imaging signed a strategic collaboration agreement in China, aiming to enhance healthcare access through advanced imaging technologies and the implementation of remote diagnosis capabilities. This highlights the increasingly important role of collaborative approaches in penetrating this diverse and geographically expansive market.
- [Add another recent milestone here with details]
Strategic Outlook for APAC Medical Imaging Devices Industry Market
The APAC medical imaging devices market is poised for continued expansion, driven by a combination of factors such as technological innovation, increasing healthcare spending, and growing demand for advanced diagnostic solutions. Strategic partnerships, geographical expansion, and product diversification will be key elements for companies seeking success. The market presents significant opportunities for both established players and emerging companies to capture market share. The focus on providing high-quality, cost-effective, and accessible imaging services will be crucial for market leadership.
APAC Medical Imaging Devices Industry Segmentation
-
1. Modality
-
1.1. MRI
- 1.1.1. Low and mid field MRI systems (<1.5 T)
- 1.1.2. High field MRI systems (1.5-3 T)
- 1.1.3. Very Hig
-
1.2. Computed Tomography
- 1.2.1. Low End Scanners (~16-Slice)
- 1.2.2. Mid Range Scanners (~64-Slice)
- 1.2.3. High End Scanners (128-Slice and More)
-
1.3. Ultrasound
- 1.3.1. 2D Ultrasound
- 1.3.2. 3D Ultrasound
- 1.3.3. Other Types of Ultrasound
-
1.4. X-Ray
- 1.4.1. Analog Systems
- 1.4.2. Digital Systems
-
1.5. Nuclear Imaging
- 1.5.1. Positron Emission Tomography (PET)
- 1.5.2. Single Photon Emission Computed Tomography (SPECT)
- 1.6. Fluoroscopy
- 1.7. Mammography
-
1.1. MRI
-
2. Application
- 2.1. Cardiology
- 2.2. Oncology
- 2.3. Neurology
- 2.4. Orthopedics
- 2.5. Gastroenterology
- 2.6. Gynecology
- 2.7. Other Applications
-
3. End-User
- 3.1. Hospital
- 3.2. Diagnostic Centers
- 3.3. Other End-Users
-
4. Geography
- 4.1. China
- 4.2. Japan
- 4.3. India
- 4.4. Australia
- 4.5. South Korea
- 4.6. Rest of Asia-Pacific
APAC Medical Imaging Devices Industry Segmentation By Geography
- 1. China
- 2. Japan
- 3. India
- 4. Australia
- 5. South Korea
- 6. Rest of Asia Pacific
APAC Medical Imaging Devices Industry Regional Market Share
Geographic Coverage of APAC Medical Imaging Devices Industry
APAC Medical Imaging Devices Industry REPORT HIGHLIGHTS
| Aspects | Details |
|---|---|
| Study Period | 2020-2034 |
| Base Year | 2025 |
| Estimated Year | 2026 |
| Forecast Period | 2026-2034 |
| Historical Period | 2020-2025 |
| Growth Rate | CAGR of 8% from 2020-2034 |
| Segmentation |
|
Table of Contents
- 1. Introduction
- 1.1. Research Scope
- 1.2. Market Segmentation
- 1.3. Research Objective
- 1.4. Definitions and Assumptions
- 2. Executive Summary
- 2.1. Market Snapshot
- 3. Market Dynamics
- 3.1. Market Drivers
- 3.2. Market Restrains
- 3.3. Market Trends
- 3.4. Market Opportunities
- 4. Market Factor Analysis
- 4.1. Porters Five Forces
- 4.1.1. Bargaining Power of Suppliers
- 4.1.2. Bargaining Power of Buyers
- 4.1.3. Threat of New Entrants
- 4.1.4. Threat of Substitutes
- 4.1.5. Competitive Rivalry
- 4.2. PESTEL analysis
- 4.3. BCG Analysis
- 4.3.1. Stars (High Growth, High Market Share)
- 4.3.2. Cash Cows (Low Growth, High Market Share)
- 4.3.3. Question Mark (High Growth, Low Market Share)
- 4.3.4. Dogs (Low Growth, Low Market Share)
- 4.4. Ansoff Matrix Analysis
- 4.5. Supply Chain Analysis
- 4.6. Regulatory Landscape
- 4.7. Current Market Potential and Opportunity Assessment (TAM–SAM–SOM Framework)
- 4.8. MDP Analyst Note
- 4.1. Porters Five Forces
- 5. Market Analysis, Insights and Forecast 2021-2033
- 5.1. Market Analysis, Insights and Forecast - by Modality
- 5.1.1. MRI
- 5.1.1.1. Low and mid field MRI systems (<1.5 T)
- 5.1.1.2. High field MRI systems (1.5-3 T)
- 5.1.1.3. Very Hig
- 5.1.2. Computed Tomography
- 5.1.2.1. Low End Scanners (~16-Slice)
- 5.1.2.2. Mid Range Scanners (~64-Slice)
- 5.1.2.3. High End Scanners (128-Slice and More)
- 5.1.3. Ultrasound
- 5.1.3.1. 2D Ultrasound
- 5.1.3.2. 3D Ultrasound
- 5.1.3.3. Other Types of Ultrasound
- 5.1.4. X-Ray
- 5.1.4.1. Analog Systems
- 5.1.4.2. Digital Systems
- 5.1.5. Nuclear Imaging
- 5.1.5.1. Positron Emission Tomography (PET)
- 5.1.5.2. Single Photon Emission Computed Tomography (SPECT)
- 5.1.6. Fluoroscopy
- 5.1.7. Mammography
- 5.1.1. MRI
- 5.2. Market Analysis, Insights and Forecast - by Application
- 5.2.1. Cardiology
- 5.2.2. Oncology
- 5.2.3. Neurology
- 5.2.4. Orthopedics
- 5.2.5. Gastroenterology
- 5.2.6. Gynecology
- 5.2.7. Other Applications
- 5.3. Market Analysis, Insights and Forecast - by End-User
- 5.3.1. Hospital
- 5.3.2. Diagnostic Centers
- 5.3.3. Other End-Users
- 5.4. Market Analysis, Insights and Forecast - by Geography
- 5.4.1. China
- 5.4.2. Japan
- 5.4.3. India
- 5.4.4. Australia
- 5.4.5. South Korea
- 5.4.6. Rest of Asia-Pacific
- 5.5. Market Analysis, Insights and Forecast - by Region
- 5.5.1. China
- 5.5.2. Japan
- 5.5.3. India
- 5.5.4. Australia
- 5.5.5. South Korea
- 5.5.6. Rest of Asia Pacific
- 5.1. Market Analysis, Insights and Forecast - by Modality
- 6. Global APAC Medical Imaging Devices Industry Analysis, Insights and Forecast, 2021-2033
- 6.1. Market Analysis, Insights and Forecast - by Modality
- 6.1.1. MRI
- 6.1.1.1. Low and mid field MRI systems (<1.5 T)
- 6.1.1.2. High field MRI systems (1.5-3 T)
- 6.1.1.3. Very Hig
- 6.1.2. Computed Tomography
- 6.1.2.1. Low End Scanners (~16-Slice)
- 6.1.2.2. Mid Range Scanners (~64-Slice)
- 6.1.2.3. High End Scanners (128-Slice and More)
- 6.1.3. Ultrasound
- 6.1.3.1. 2D Ultrasound
- 6.1.3.2. 3D Ultrasound
- 6.1.3.3. Other Types of Ultrasound
- 6.1.4. X-Ray
- 6.1.4.1. Analog Systems
- 6.1.4.2. Digital Systems
- 6.1.5. Nuclear Imaging
- 6.1.5.1. Positron Emission Tomography (PET)
- 6.1.5.2. Single Photon Emission Computed Tomography (SPECT)
- 6.1.6. Fluoroscopy
- 6.1.7. Mammography
- 6.1.1. MRI
- 6.2. Market Analysis, Insights and Forecast - by Application
- 6.2.1. Cardiology
- 6.2.2. Oncology
- 6.2.3. Neurology
- 6.2.4. Orthopedics
- 6.2.5. Gastroenterology
- 6.2.6. Gynecology
- 6.2.7. Other Applications
- 6.3. Market Analysis, Insights and Forecast - by End-User
- 6.3.1. Hospital
- 6.3.2. Diagnostic Centers
- 6.3.3. Other End-Users
- 6.4. Market Analysis, Insights and Forecast - by Geography
- 6.4.1. China
- 6.4.2. Japan
- 6.4.3. India
- 6.4.4. Australia
- 6.4.5. South Korea
- 6.4.6. Rest of Asia-Pacific
- 6.1. Market Analysis, Insights and Forecast - by Modality
- 7. China APAC Medical Imaging Devices Industry Analysis, Insights and Forecast, 2020-2032
- 7.1. Market Analysis, Insights and Forecast - by Modality
- 7.1.1. MRI
- 7.1.1.1. Low and mid field MRI systems (<1.5 T)
- 7.1.1.2. High field MRI systems (1.5-3 T)
- 7.1.1.3. Very Hig
- 7.1.2. Computed Tomography
- 7.1.2.1. Low End Scanners (~16-Slice)
- 7.1.2.2. Mid Range Scanners (~64-Slice)
- 7.1.2.3. High End Scanners (128-Slice and More)
- 7.1.3. Ultrasound
- 7.1.3.1. 2D Ultrasound
- 7.1.3.2. 3D Ultrasound
- 7.1.3.3. Other Types of Ultrasound
- 7.1.4. X-Ray
- 7.1.4.1. Analog Systems
- 7.1.4.2. Digital Systems
- 7.1.5. Nuclear Imaging
- 7.1.5.1. Positron Emission Tomography (PET)
- 7.1.5.2. Single Photon Emission Computed Tomography (SPECT)
- 7.1.6. Fluoroscopy
- 7.1.7. Mammography
- 7.1.1. MRI
- 7.2. Market Analysis, Insights and Forecast - by Application
- 7.2.1. Cardiology
- 7.2.2. Oncology
- 7.2.3. Neurology
- 7.2.4. Orthopedics
- 7.2.5. Gastroenterology
- 7.2.6. Gynecology
- 7.2.7. Other Applications
- 7.3. Market Analysis, Insights and Forecast - by End-User
- 7.3.1. Hospital
- 7.3.2. Diagnostic Centers
- 7.3.3. Other End-Users
- 7.4. Market Analysis, Insights and Forecast - by Geography
- 7.4.1. China
- 7.4.2. Japan
- 7.4.3. India
- 7.4.4. Australia
- 7.4.5. South Korea
- 7.4.6. Rest of Asia-Pacific
- 7.1. Market Analysis, Insights and Forecast - by Modality
- 8. Japan APAC Medical Imaging Devices Industry Analysis, Insights and Forecast, 2020-2032
- 8.1. Market Analysis, Insights and Forecast - by Modality
- 8.1.1. MRI
- 8.1.1.1. Low and mid field MRI systems (<1.5 T)
- 8.1.1.2. High field MRI systems (1.5-3 T)
- 8.1.1.3. Very Hig
- 8.1.2. Computed Tomography
- 8.1.2.1. Low End Scanners (~16-Slice)
- 8.1.2.2. Mid Range Scanners (~64-Slice)
- 8.1.2.3. High End Scanners (128-Slice and More)
- 8.1.3. Ultrasound
- 8.1.3.1. 2D Ultrasound
- 8.1.3.2. 3D Ultrasound
- 8.1.3.3. Other Types of Ultrasound
- 8.1.4. X-Ray
- 8.1.4.1. Analog Systems
- 8.1.4.2. Digital Systems
- 8.1.5. Nuclear Imaging
- 8.1.5.1. Positron Emission Tomography (PET)
- 8.1.5.2. Single Photon Emission Computed Tomography (SPECT)
- 8.1.6. Fluoroscopy
- 8.1.7. Mammography
- 8.1.1. MRI
- 8.2. Market Analysis, Insights and Forecast - by Application
- 8.2.1. Cardiology
- 8.2.2. Oncology
- 8.2.3. Neurology
- 8.2.4. Orthopedics
- 8.2.5. Gastroenterology
- 8.2.6. Gynecology
- 8.2.7. Other Applications
- 8.3. Market Analysis, Insights and Forecast - by End-User
- 8.3.1. Hospital
- 8.3.2. Diagnostic Centers
- 8.3.3. Other End-Users
- 8.4. Market Analysis, Insights and Forecast - by Geography
- 8.4.1. China
- 8.4.2. Japan
- 8.4.3. India
- 8.4.4. Australia
- 8.4.5. South Korea
- 8.4.6. Rest of Asia-Pacific
- 8.1. Market Analysis, Insights and Forecast - by Modality
- 9. India APAC Medical Imaging Devices Industry Analysis, Insights and Forecast, 2020-2032
- 9.1. Market Analysis, Insights and Forecast - by Modality
- 9.1.1. MRI
- 9.1.1.1. Low and mid field MRI systems (<1.5 T)
- 9.1.1.2. High field MRI systems (1.5-3 T)
- 9.1.1.3. Very Hig
- 9.1.2. Computed Tomography
- 9.1.2.1. Low End Scanners (~16-Slice)
- 9.1.2.2. Mid Range Scanners (~64-Slice)
- 9.1.2.3. High End Scanners (128-Slice and More)
- 9.1.3. Ultrasound
- 9.1.3.1. 2D Ultrasound
- 9.1.3.2. 3D Ultrasound
- 9.1.3.3. Other Types of Ultrasound
- 9.1.4. X-Ray
- 9.1.4.1. Analog Systems
- 9.1.4.2. Digital Systems
- 9.1.5. Nuclear Imaging
- 9.1.5.1. Positron Emission Tomography (PET)
- 9.1.5.2. Single Photon Emission Computed Tomography (SPECT)
- 9.1.6. Fluoroscopy
- 9.1.7. Mammography
- 9.1.1. MRI
- 9.2. Market Analysis, Insights and Forecast - by Application
- 9.2.1. Cardiology
- 9.2.2. Oncology
- 9.2.3. Neurology
- 9.2.4. Orthopedics
- 9.2.5. Gastroenterology
- 9.2.6. Gynecology
- 9.2.7. Other Applications
- 9.3. Market Analysis, Insights and Forecast - by End-User
- 9.3.1. Hospital
- 9.3.2. Diagnostic Centers
- 9.3.3. Other End-Users
- 9.4. Market Analysis, Insights and Forecast - by Geography
- 9.4.1. China
- 9.4.2. Japan
- 9.4.3. India
- 9.4.4. Australia
- 9.4.5. South Korea
- 9.4.6. Rest of Asia-Pacific
- 9.1. Market Analysis, Insights and Forecast - by Modality
- 10. Australia APAC Medical Imaging Devices Industry Analysis, Insights and Forecast, 2020-2032
- 10.1. Market Analysis, Insights and Forecast - by Modality
- 10.1.1. MRI
- 10.1.1.1. Low and mid field MRI systems (<1.5 T)
- 10.1.1.2. High field MRI systems (1.5-3 T)
- 10.1.1.3. Very Hig
- 10.1.2. Computed Tomography
- 10.1.2.1. Low End Scanners (~16-Slice)
- 10.1.2.2. Mid Range Scanners (~64-Slice)
- 10.1.2.3. High End Scanners (128-Slice and More)
- 10.1.3. Ultrasound
- 10.1.3.1. 2D Ultrasound
- 10.1.3.2. 3D Ultrasound
- 10.1.3.3. Other Types of Ultrasound
- 10.1.4. X-Ray
- 10.1.4.1. Analog Systems
- 10.1.4.2. Digital Systems
- 10.1.5. Nuclear Imaging
- 10.1.5.1. Positron Emission Tomography (PET)
- 10.1.5.2. Single Photon Emission Computed Tomography (SPECT)
- 10.1.6. Fluoroscopy
- 10.1.7. Mammography
- 10.1.1. MRI
- 10.2. Market Analysis, Insights and Forecast - by Application
- 10.2.1. Cardiology
- 10.2.2. Oncology
- 10.2.3. Neurology
- 10.2.4. Orthopedics
- 10.2.5. Gastroenterology
- 10.2.6. Gynecology
- 10.2.7. Other Applications
- 10.3. Market Analysis, Insights and Forecast - by End-User
- 10.3.1. Hospital
- 10.3.2. Diagnostic Centers
- 10.3.3. Other End-Users
- 10.4. Market Analysis, Insights and Forecast - by Geography
- 10.4.1. China
- 10.4.2. Japan
- 10.4.3. India
- 10.4.4. Australia
- 10.4.5. South Korea
- 10.4.6. Rest of Asia-Pacific
- 10.1. Market Analysis, Insights and Forecast - by Modality
- 11. South Korea APAC Medical Imaging Devices Industry Analysis, Insights and Forecast, 2020-2032
- 11.1. Market Analysis, Insights and Forecast - by Modality
- 11.1.1. MRI
- 11.1.1.1. Low and mid field MRI systems (<1.5 T)
- 11.1.1.2. High field MRI systems (1.5-3 T)
- 11.1.1.3. Very Hig
- 11.1.2. Computed Tomography
- 11.1.2.1. Low End Scanners (~16-Slice)
- 11.1.2.2. Mid Range Scanners (~64-Slice)
- 11.1.2.3. High End Scanners (128-Slice and More)
- 11.1.3. Ultrasound
- 11.1.3.1. 2D Ultrasound
- 11.1.3.2. 3D Ultrasound
- 11.1.3.3. Other Types of Ultrasound
- 11.1.4. X-Ray
- 11.1.4.1. Analog Systems
- 11.1.4.2. Digital Systems
- 11.1.5. Nuclear Imaging
- 11.1.5.1. Positron Emission Tomography (PET)
- 11.1.5.2. Single Photon Emission Computed Tomography (SPECT)
- 11.1.6. Fluoroscopy
- 11.1.7. Mammography
- 11.1.1. MRI
- 11.2. Market Analysis, Insights and Forecast - by Application
- 11.2.1. Cardiology
- 11.2.2. Oncology
- 11.2.3. Neurology
- 11.2.4. Orthopedics
- 11.2.5. Gastroenterology
- 11.2.6. Gynecology
- 11.2.7. Other Applications
- 11.3. Market Analysis, Insights and Forecast - by End-User
- 11.3.1. Hospital
- 11.3.2. Diagnostic Centers
- 11.3.3. Other End-Users
- 11.4. Market Analysis, Insights and Forecast - by Geography
- 11.4.1. China
- 11.4.2. Japan
- 11.4.3. India
- 11.4.4. Australia
- 11.4.5. South Korea
- 11.4.6. Rest of Asia-Pacific
- 11.1. Market Analysis, Insights and Forecast - by Modality
- 12. Rest of Asia Pacific APAC Medical Imaging Devices Industry Analysis, Insights and Forecast, 2020-2032
- 12.1. Market Analysis, Insights and Forecast - by Modality
- 12.1.1. MRI
- 12.1.1.1. Low and mid field MRI systems (<1.5 T)
- 12.1.1.2. High field MRI systems (1.5-3 T)
- 12.1.1.3. Very Hig
- 12.1.2. Computed Tomography
- 12.1.2.1. Low End Scanners (~16-Slice)
- 12.1.2.2. Mid Range Scanners (~64-Slice)
- 12.1.2.3. High End Scanners (128-Slice and More)
- 12.1.3. Ultrasound
- 12.1.3.1. 2D Ultrasound
- 12.1.3.2. 3D Ultrasound
- 12.1.3.3. Other Types of Ultrasound
- 12.1.4. X-Ray
- 12.1.4.1. Analog Systems
- 12.1.4.2. Digital Systems
- 12.1.5. Nuclear Imaging
- 12.1.5.1. Positron Emission Tomography (PET)
- 12.1.5.2. Single Photon Emission Computed Tomography (SPECT)
- 12.1.6. Fluoroscopy
- 12.1.7. Mammography
- 12.1.1. MRI
- 12.2. Market Analysis, Insights and Forecast - by Application
- 12.2.1. Cardiology
- 12.2.2. Oncology
- 12.2.3. Neurology
- 12.2.4. Orthopedics
- 12.2.5. Gastroenterology
- 12.2.6. Gynecology
- 12.2.7. Other Applications
- 12.3. Market Analysis, Insights and Forecast - by End-User
- 12.3.1. Hospital
- 12.3.2. Diagnostic Centers
- 12.3.3. Other End-Users
- 12.4. Market Analysis, Insights and Forecast - by Geography
- 12.4.1. China
- 12.4.2. Japan
- 12.4.3. India
- 12.4.4. Australia
- 12.4.5. South Korea
- 12.4.6. Rest of Asia-Pacific
- 12.1. Market Analysis, Insights and Forecast - by Modality
- 13. Competitive Analysis
- 13.1. Company Profiles
- 13.1.1 Esaote SpA
- 13.1.1.1. Company Overview
- 13.1.1.2. Products
- 13.1.1.3. Company Financials
- 13.1.1.4. SWOT Analysis
- 13.1.2 Hologic Inc
- 13.1.2.1. Company Overview
- 13.1.2.2. Products
- 13.1.2.3. Company Financials
- 13.1.2.4. SWOT Analysis
- 13.1.3 GE Healthcare
- 13.1.3.1. Company Overview
- 13.1.3.2. Products
- 13.1.3.3. Company Financials
- 13.1.3.4. SWOT Analysis
- 13.1.4 Shanghai United Imaging Healthcare Co Ltd
- 13.1.4.1. Company Overview
- 13.1.4.2. Products
- 13.1.4.3. Company Financials
- 13.1.4.4. SWOT Analysis
- 13.1.5 Koninklijke Philips N V
- 13.1.5.1. Company Overview
- 13.1.5.2. Products
- 13.1.5.3. Company Financials
- 13.1.5.4. SWOT Analysis
- 13.1.6 Siemens AG
- 13.1.6.1. Company Overview
- 13.1.6.2. Products
- 13.1.6.3. Company Financials
- 13.1.6.4. SWOT Analysis
- 13.1.7 FUJIFILM Holdings Corporation
- 13.1.7.1. Company Overview
- 13.1.7.2. Products
- 13.1.7.3. Company Financials
- 13.1.7.4. SWOT Analysis
- 13.1.8 Carestream Health
- 13.1.8.1. Company Overview
- 13.1.8.2. Products
- 13.1.8.3. Company Financials
- 13.1.8.4. SWOT Analysis
- 13.1.9 J Morita Corporation
- 13.1.9.1. Company Overview
- 13.1.9.2. Products
- 13.1.9.3. Company Financials
- 13.1.9.4. SWOT Analysis
- 13.1.10 Canon Medical Systems Corporation
- 13.1.10.1. Company Overview
- 13.1.10.2. Products
- 13.1.10.3. Company Financials
- 13.1.10.4. SWOT Analysis
- 13.1.11 Teknova Medical Systems Limited
- 13.1.11.1. Company Overview
- 13.1.11.2. Products
- 13.1.11.3. Company Financials
- 13.1.11.4. SWOT Analysis
- 13.1.12 Shimadzu Corporation
- 13.1.12.1. Company Overview
- 13.1.12.2. Products
- 13.1.12.3. Company Financials
- 13.1.12.4. SWOT Analysis
- 13.1.1 Esaote SpA
- 13.2. Market Entropy
- 13.2.1 Company's Key Areas Served
- 13.2.2 Recent Developments
- 13.3. Company Market Share Analysis 2025
- 13.3.1 Top 5 Companies Market Share Analysis
- 13.3.2 Top 3 Companies Market Share Analysis
- 13.4. List of Potential Customers
- 14. Research Methodology
List of Figures
- Figure 1: Global APAC Medical Imaging Devices Industry Revenue Breakdown (billion, %) by Region 2025 & 2033
- Figure 2: Global APAC Medical Imaging Devices Industry Volume Breakdown (K Unit, %) by Region 2025 & 2033
- Figure 3: China APAC Medical Imaging Devices Industry Revenue (billion), by Modality 2025 & 2033
- Figure 4: China APAC Medical Imaging Devices Industry Volume (K Unit), by Modality 2025 & 2033
- Figure 5: China APAC Medical Imaging Devices Industry Revenue Share (%), by Modality 2025 & 2033
- Figure 6: China APAC Medical Imaging Devices Industry Volume Share (%), by Modality 2025 & 2033
- Figure 7: China APAC Medical Imaging Devices Industry Revenue (billion), by Application 2025 & 2033
- Figure 8: China APAC Medical Imaging Devices Industry Volume (K Unit), by Application 2025 & 2033
- Figure 9: China APAC Medical Imaging Devices Industry Revenue Share (%), by Application 2025 & 2033
- Figure 10: China APAC Medical Imaging Devices Industry Volume Share (%), by Application 2025 & 2033
- Figure 11: China APAC Medical Imaging Devices Industry Revenue (billion), by End-User 2025 & 2033
- Figure 12: China APAC Medical Imaging Devices Industry Volume (K Unit), by End-User 2025 & 2033
- Figure 13: China APAC Medical Imaging Devices Industry Revenue Share (%), by End-User 2025 & 2033
- Figure 14: China APAC Medical Imaging Devices Industry Volume Share (%), by End-User 2025 & 2033
- Figure 15: China APAC Medical Imaging Devices Industry Revenue (billion), by Geography 2025 & 2033
- Figure 16: China APAC Medical Imaging Devices Industry Volume (K Unit), by Geography 2025 & 2033
- Figure 17: China APAC Medical Imaging Devices Industry Revenue Share (%), by Geography 2025 & 2033
- Figure 18: China APAC Medical Imaging Devices Industry Volume Share (%), by Geography 2025 & 2033
- Figure 19: China APAC Medical Imaging Devices Industry Revenue (billion), by Country 2025 & 2033
- Figure 20: China APAC Medical Imaging Devices Industry Volume (K Unit), by Country 2025 & 2033
- Figure 21: China APAC Medical Imaging Devices Industry Revenue Share (%), by Country 2025 & 2033
- Figure 22: China APAC Medical Imaging Devices Industry Volume Share (%), by Country 2025 & 2033
- Figure 23: Japan APAC Medical Imaging Devices Industry Revenue (billion), by Modality 2025 & 2033
- Figure 24: Japan APAC Medical Imaging Devices Industry Volume (K Unit), by Modality 2025 & 2033
- Figure 25: Japan APAC Medical Imaging Devices Industry Revenue Share (%), by Modality 2025 & 2033
- Figure 26: Japan APAC Medical Imaging Devices Industry Volume Share (%), by Modality 2025 & 2033
- Figure 27: Japan APAC Medical Imaging Devices Industry Revenue (billion), by Application 2025 & 2033
- Figure 28: Japan APAC Medical Imaging Devices Industry Volume (K Unit), by Application 2025 & 2033
- Figure 29: Japan APAC Medical Imaging Devices Industry Revenue Share (%), by Application 2025 & 2033
- Figure 30: Japan APAC Medical Imaging Devices Industry Volume Share (%), by Application 2025 & 2033
- Figure 31: Japan APAC Medical Imaging Devices Industry Revenue (billion), by End-User 2025 & 2033
- Figure 32: Japan APAC Medical Imaging Devices Industry Volume (K Unit), by End-User 2025 & 2033
- Figure 33: Japan APAC Medical Imaging Devices Industry Revenue Share (%), by End-User 2025 & 2033
- Figure 34: Japan APAC Medical Imaging Devices Industry Volume Share (%), by End-User 2025 & 2033
- Figure 35: Japan APAC Medical Imaging Devices Industry Revenue (billion), by Geography 2025 & 2033
- Figure 36: Japan APAC Medical Imaging Devices Industry Volume (K Unit), by Geography 2025 & 2033
- Figure 37: Japan APAC Medical Imaging Devices Industry Revenue Share (%), by Geography 2025 & 2033
- Figure 38: Japan APAC Medical Imaging Devices Industry Volume Share (%), by Geography 2025 & 2033
- Figure 39: Japan APAC Medical Imaging Devices Industry Revenue (billion), by Country 2025 & 2033
- Figure 40: Japan APAC Medical Imaging Devices Industry Volume (K Unit), by Country 2025 & 2033
- Figure 41: Japan APAC Medical Imaging Devices Industry Revenue Share (%), by Country 2025 & 2033
- Figure 42: Japan APAC Medical Imaging Devices Industry Volume Share (%), by Country 2025 & 2033
- Figure 43: India APAC Medical Imaging Devices Industry Revenue (billion), by Modality 2025 & 2033
- Figure 44: India APAC Medical Imaging Devices Industry Volume (K Unit), by Modality 2025 & 2033
- Figure 45: India APAC Medical Imaging Devices Industry Revenue Share (%), by Modality 2025 & 2033
- Figure 46: India APAC Medical Imaging Devices Industry Volume Share (%), by Modality 2025 & 2033
- Figure 47: India APAC Medical Imaging Devices Industry Revenue (billion), by Application 2025 & 2033
- Figure 48: India APAC Medical Imaging Devices Industry Volume (K Unit), by Application 2025 & 2033
- Figure 49: India APAC Medical Imaging Devices Industry Revenue Share (%), by Application 2025 & 2033
- Figure 50: India APAC Medical Imaging Devices Industry Volume Share (%), by Application 2025 & 2033
- Figure 51: India APAC Medical Imaging Devices Industry Revenue (billion), by End-User 2025 & 2033
- Figure 52: India APAC Medical Imaging Devices Industry Volume (K Unit), by End-User 2025 & 2033
- Figure 53: India APAC Medical Imaging Devices Industry Revenue Share (%), by End-User 2025 & 2033
- Figure 54: India APAC Medical Imaging Devices Industry Volume Share (%), by End-User 2025 & 2033
- Figure 55: India APAC Medical Imaging Devices Industry Revenue (billion), by Geography 2025 & 2033
- Figure 56: India APAC Medical Imaging Devices Industry Volume (K Unit), by Geography 2025 & 2033
- Figure 57: India APAC Medical Imaging Devices Industry Revenue Share (%), by Geography 2025 & 2033
- Figure 58: India APAC Medical Imaging Devices Industry Volume Share (%), by Geography 2025 & 2033
- Figure 59: India APAC Medical Imaging Devices Industry Revenue (billion), by Country 2025 & 2033
- Figure 60: India APAC Medical Imaging Devices Industry Volume (K Unit), by Country 2025 & 2033
- Figure 61: India APAC Medical Imaging Devices Industry Revenue Share (%), by Country 2025 & 2033
- Figure 62: India APAC Medical Imaging Devices Industry Volume Share (%), by Country 2025 & 2033
- Figure 63: Australia APAC Medical Imaging Devices Industry Revenue (billion), by Modality 2025 & 2033
- Figure 64: Australia APAC Medical Imaging Devices Industry Volume (K Unit), by Modality 2025 & 2033
- Figure 65: Australia APAC Medical Imaging Devices Industry Revenue Share (%), by Modality 2025 & 2033
- Figure 66: Australia APAC Medical Imaging Devices Industry Volume Share (%), by Modality 2025 & 2033
- Figure 67: Australia APAC Medical Imaging Devices Industry Revenue (billion), by Application 2025 & 2033
- Figure 68: Australia APAC Medical Imaging Devices Industry Volume (K Unit), by Application 2025 & 2033
- Figure 69: Australia APAC Medical Imaging Devices Industry Revenue Share (%), by Application 2025 & 2033
- Figure 70: Australia APAC Medical Imaging Devices Industry Volume Share (%), by Application 2025 & 2033
- Figure 71: Australia APAC Medical Imaging Devices Industry Revenue (billion), by End-User 2025 & 2033
- Figure 72: Australia APAC Medical Imaging Devices Industry Volume (K Unit), by End-User 2025 & 2033
- Figure 73: Australia APAC Medical Imaging Devices Industry Revenue Share (%), by End-User 2025 & 2033
- Figure 74: Australia APAC Medical Imaging Devices Industry Volume Share (%), by End-User 2025 & 2033
- Figure 75: Australia APAC Medical Imaging Devices Industry Revenue (billion), by Geography 2025 & 2033
- Figure 76: Australia APAC Medical Imaging Devices Industry Volume (K Unit), by Geography 2025 & 2033
- Figure 77: Australia APAC Medical Imaging Devices Industry Revenue Share (%), by Geography 2025 & 2033
- Figure 78: Australia APAC Medical Imaging Devices Industry Volume Share (%), by Geography 2025 & 2033
- Figure 79: Australia APAC Medical Imaging Devices Industry Revenue (billion), by Country 2025 & 2033
- Figure 80: Australia APAC Medical Imaging Devices Industry Volume (K Unit), by Country 2025 & 2033
- Figure 81: Australia APAC Medical Imaging Devices Industry Revenue Share (%), by Country 2025 & 2033
- Figure 82: Australia APAC Medical Imaging Devices Industry Volume Share (%), by Country 2025 & 2033
- Figure 83: South Korea APAC Medical Imaging Devices Industry Revenue (billion), by Modality 2025 & 2033
- Figure 84: South Korea APAC Medical Imaging Devices Industry Volume (K Unit), by Modality 2025 & 2033
- Figure 85: South Korea APAC Medical Imaging Devices Industry Revenue Share (%), by Modality 2025 & 2033
- Figure 86: South Korea APAC Medical Imaging Devices Industry Volume Share (%), by Modality 2025 & 2033
- Figure 87: South Korea APAC Medical Imaging Devices Industry Revenue (billion), by Application 2025 & 2033
- Figure 88: South Korea APAC Medical Imaging Devices Industry Volume (K Unit), by Application 2025 & 2033
- Figure 89: South Korea APAC Medical Imaging Devices Industry Revenue Share (%), by Application 2025 & 2033
- Figure 90: South Korea APAC Medical Imaging Devices Industry Volume Share (%), by Application 2025 & 2033
- Figure 91: South Korea APAC Medical Imaging Devices Industry Revenue (billion), by End-User 2025 & 2033
- Figure 92: South Korea APAC Medical Imaging Devices Industry Volume (K Unit), by End-User 2025 & 2033
- Figure 93: South Korea APAC Medical Imaging Devices Industry Revenue Share (%), by End-User 2025 & 2033
- Figure 94: South Korea APAC Medical Imaging Devices Industry Volume Share (%), by End-User 2025 & 2033
- Figure 95: South Korea APAC Medical Imaging Devices Industry Revenue (billion), by Geography 2025 & 2033
- Figure 96: South Korea APAC Medical Imaging Devices Industry Volume (K Unit), by Geography 2025 & 2033
- Figure 97: South Korea APAC Medical Imaging Devices Industry Revenue Share (%), by Geography 2025 & 2033
- Figure 98: South Korea APAC Medical Imaging Devices Industry Volume Share (%), by Geography 2025 & 2033
- Figure 99: South Korea APAC Medical Imaging Devices Industry Revenue (billion), by Country 2025 & 2033
- Figure 100: South Korea APAC Medical Imaging Devices Industry Volume (K Unit), by Country 2025 & 2033
- Figure 101: South Korea APAC Medical Imaging Devices Industry Revenue Share (%), by Country 2025 & 2033
- Figure 102: South Korea APAC Medical Imaging Devices Industry Volume Share (%), by Country 2025 & 2033
- Figure 103: Rest of Asia Pacific APAC Medical Imaging Devices Industry Revenue (billion), by Modality 2025 & 2033
- Figure 104: Rest of Asia Pacific APAC Medical Imaging Devices Industry Volume (K Unit), by Modality 2025 & 2033
- Figure 105: Rest of Asia Pacific APAC Medical Imaging Devices Industry Revenue Share (%), by Modality 2025 & 2033
- Figure 106: Rest of Asia Pacific APAC Medical Imaging Devices Industry Volume Share (%), by Modality 2025 & 2033
- Figure 107: Rest of Asia Pacific APAC Medical Imaging Devices Industry Revenue (billion), by Application 2025 & 2033
- Figure 108: Rest of Asia Pacific APAC Medical Imaging Devices Industry Volume (K Unit), by Application 2025 & 2033
- Figure 109: Rest of Asia Pacific APAC Medical Imaging Devices Industry Revenue Share (%), by Application 2025 & 2033
- Figure 110: Rest of Asia Pacific APAC Medical Imaging Devices Industry Volume Share (%), by Application 2025 & 2033
- Figure 111: Rest of Asia Pacific APAC Medical Imaging Devices Industry Revenue (billion), by End-User 2025 & 2033
- Figure 112: Rest of Asia Pacific APAC Medical Imaging Devices Industry Volume (K Unit), by End-User 2025 & 2033
- Figure 113: Rest of Asia Pacific APAC Medical Imaging Devices Industry Revenue Share (%), by End-User 2025 & 2033
- Figure 114: Rest of Asia Pacific APAC Medical Imaging Devices Industry Volume Share (%), by End-User 2025 & 2033
- Figure 115: Rest of Asia Pacific APAC Medical Imaging Devices Industry Revenue (billion), by Geography 2025 & 2033
- Figure 116: Rest of Asia Pacific APAC Medical Imaging Devices Industry Volume (K Unit), by Geography 2025 & 2033
- Figure 117: Rest of Asia Pacific APAC Medical Imaging Devices Industry Revenue Share (%), by Geography 2025 & 2033
- Figure 118: Rest of Asia Pacific APAC Medical Imaging Devices Industry Volume Share (%), by Geography 2025 & 2033
- Figure 119: Rest of Asia Pacific APAC Medical Imaging Devices Industry Revenue (billion), by Country 2025 & 2033
- Figure 120: Rest of Asia Pacific APAC Medical Imaging Devices Industry Volume (K Unit), by Country 2025 & 2033
- Figure 121: Rest of Asia Pacific APAC Medical Imaging Devices Industry Revenue Share (%), by Country 2025 & 2033
- Figure 122: Rest of Asia Pacific APAC Medical Imaging Devices Industry Volume Share (%), by Country 2025 & 2033
List of Tables
- Table 1: Global APAC Medical Imaging Devices Industry Revenue billion Forecast, by Modality 2020 & 2033
- Table 2: Global APAC Medical Imaging Devices Industry Volume K Unit Forecast, by Modality 2020 & 2033
- Table 3: Global APAC Medical Imaging Devices Industry Revenue billion Forecast, by Application 2020 & 2033
- Table 4: Global APAC Medical Imaging Devices Industry Volume K Unit Forecast, by Application 2020 & 2033
- Table 5: Global APAC Medical Imaging Devices Industry Revenue billion Forecast, by End-User 2020 & 2033
- Table 6: Global APAC Medical Imaging Devices Industry Volume K Unit Forecast, by End-User 2020 & 2033
- Table 7: Global APAC Medical Imaging Devices Industry Revenue billion Forecast, by Geography 2020 & 2033
- Table 8: Global APAC Medical Imaging Devices Industry Volume K Unit Forecast, by Geography 2020 & 2033
- Table 9: Global APAC Medical Imaging Devices Industry Revenue billion Forecast, by Region 2020 & 2033
- Table 10: Global APAC Medical Imaging Devices Industry Volume K Unit Forecast, by Region 2020 & 2033
- Table 11: Global APAC Medical Imaging Devices Industry Revenue billion Forecast, by Modality 2020 & 2033
- Table 12: Global APAC Medical Imaging Devices Industry Volume K Unit Forecast, by Modality 2020 & 2033
- Table 13: Global APAC Medical Imaging Devices Industry Revenue billion Forecast, by Application 2020 & 2033
- Table 14: Global APAC Medical Imaging Devices Industry Volume K Unit Forecast, by Application 2020 & 2033
- Table 15: Global APAC Medical Imaging Devices Industry Revenue billion Forecast, by End-User 2020 & 2033
- Table 16: Global APAC Medical Imaging Devices Industry Volume K Unit Forecast, by End-User 2020 & 2033
- Table 17: Global APAC Medical Imaging Devices Industry Revenue billion Forecast, by Geography 2020 & 2033
- Table 18: Global APAC Medical Imaging Devices Industry Volume K Unit Forecast, by Geography 2020 & 2033
- Table 19: Global APAC Medical Imaging Devices Industry Revenue billion Forecast, by Country 2020 & 2033
- Table 20: Global APAC Medical Imaging Devices Industry Volume K Unit Forecast, by Country 2020 & 2033
- Table 21: Global APAC Medical Imaging Devices Industry Revenue billion Forecast, by Modality 2020 & 2033
- Table 22: Global APAC Medical Imaging Devices Industry Volume K Unit Forecast, by Modality 2020 & 2033
- Table 23: Global APAC Medical Imaging Devices Industry Revenue billion Forecast, by Application 2020 & 2033
- Table 24: Global APAC Medical Imaging Devices Industry Volume K Unit Forecast, by Application 2020 & 2033
- Table 25: Global APAC Medical Imaging Devices Industry Revenue billion Forecast, by End-User 2020 & 2033
- Table 26: Global APAC Medical Imaging Devices Industry Volume K Unit Forecast, by End-User 2020 & 2033
- Table 27: Global APAC Medical Imaging Devices Industry Revenue billion Forecast, by Geography 2020 & 2033
- Table 28: Global APAC Medical Imaging Devices Industry Volume K Unit Forecast, by Geography 2020 & 2033
- Table 29: Global APAC Medical Imaging Devices Industry Revenue billion Forecast, by Country 2020 & 2033
- Table 30: Global APAC Medical Imaging Devices Industry Volume K Unit Forecast, by Country 2020 & 2033
- Table 31: Global APAC Medical Imaging Devices Industry Revenue billion Forecast, by Modality 2020 & 2033
- Table 32: Global APAC Medical Imaging Devices Industry Volume K Unit Forecast, by Modality 2020 & 2033
- Table 33: Global APAC Medical Imaging Devices Industry Revenue billion Forecast, by Application 2020 & 2033
- Table 34: Global APAC Medical Imaging Devices Industry Volume K Unit Forecast, by Application 2020 & 2033
- Table 35: Global APAC Medical Imaging Devices Industry Revenue billion Forecast, by End-User 2020 & 2033
- Table 36: Global APAC Medical Imaging Devices Industry Volume K Unit Forecast, by End-User 2020 & 2033
- Table 37: Global APAC Medical Imaging Devices Industry Revenue billion Forecast, by Geography 2020 & 2033
- Table 38: Global APAC Medical Imaging Devices Industry Volume K Unit Forecast, by Geography 2020 & 2033
- Table 39: Global APAC Medical Imaging Devices Industry Revenue billion Forecast, by Country 2020 & 2033
- Table 40: Global APAC Medical Imaging Devices Industry Volume K Unit Forecast, by Country 2020 & 2033
- Table 41: Global APAC Medical Imaging Devices Industry Revenue billion Forecast, by Modality 2020 & 2033
- Table 42: Global APAC Medical Imaging Devices Industry Volume K Unit Forecast, by Modality 2020 & 2033
- Table 43: Global APAC Medical Imaging Devices Industry Revenue billion Forecast, by Application 2020 & 2033
- Table 44: Global APAC Medical Imaging Devices Industry Volume K Unit Forecast, by Application 2020 & 2033
- Table 45: Global APAC Medical Imaging Devices Industry Revenue billion Forecast, by End-User 2020 & 2033
- Table 46: Global APAC Medical Imaging Devices Industry Volume K Unit Forecast, by End-User 2020 & 2033
- Table 47: Global APAC Medical Imaging Devices Industry Revenue billion Forecast, by Geography 2020 & 2033
- Table 48: Global APAC Medical Imaging Devices Industry Volume K Unit Forecast, by Geography 2020 & 2033
- Table 49: Global APAC Medical Imaging Devices Industry Revenue billion Forecast, by Country 2020 & 2033
- Table 50: Global APAC Medical Imaging Devices Industry Volume K Unit Forecast, by Country 2020 & 2033
- Table 51: Global APAC Medical Imaging Devices Industry Revenue billion Forecast, by Modality 2020 & 2033
- Table 52: Global APAC Medical Imaging Devices Industry Volume K Unit Forecast, by Modality 2020 & 2033
- Table 53: Global APAC Medical Imaging Devices Industry Revenue billion Forecast, by Application 2020 & 2033
- Table 54: Global APAC Medical Imaging Devices Industry Volume K Unit Forecast, by Application 2020 & 2033
- Table 55: Global APAC Medical Imaging Devices Industry Revenue billion Forecast, by End-User 2020 & 2033
- Table 56: Global APAC Medical Imaging Devices Industry Volume K Unit Forecast, by End-User 2020 & 2033
- Table 57: Global APAC Medical Imaging Devices Industry Revenue billion Forecast, by Geography 2020 & 2033
- Table 58: Global APAC Medical Imaging Devices Industry Volume K Unit Forecast, by Geography 2020 & 2033
- Table 59: Global APAC Medical Imaging Devices Industry Revenue billion Forecast, by Country 2020 & 2033
- Table 60: Global APAC Medical Imaging Devices Industry Volume K Unit Forecast, by Country 2020 & 2033
- Table 61: Global APAC Medical Imaging Devices Industry Revenue billion Forecast, by Modality 2020 & 2033
- Table 62: Global APAC Medical Imaging Devices Industry Volume K Unit Forecast, by Modality 2020 & 2033
- Table 63: Global APAC Medical Imaging Devices Industry Revenue billion Forecast, by Application 2020 & 2033
- Table 64: Global APAC Medical Imaging Devices Industry Volume K Unit Forecast, by Application 2020 & 2033
- Table 65: Global APAC Medical Imaging Devices Industry Revenue billion Forecast, by End-User 2020 & 2033
- Table 66: Global APAC Medical Imaging Devices Industry Volume K Unit Forecast, by End-User 2020 & 2033
- Table 67: Global APAC Medical Imaging Devices Industry Revenue billion Forecast, by Geography 2020 & 2033
- Table 68: Global APAC Medical Imaging Devices Industry Volume K Unit Forecast, by Geography 2020 & 2033
- Table 69: Global APAC Medical Imaging Devices Industry Revenue billion Forecast, by Country 2020 & 2033
- Table 70: Global APAC Medical Imaging Devices Industry Volume K Unit Forecast, by Country 2020 & 2033
Frequently Asked Questions
1. What is the projected Compound Annual Growth Rate (CAGR) of the APAC Medical Imaging Devices Industry?
The projected CAGR is approximately 8%.
2. Which companies are prominent players in the APAC Medical Imaging Devices Industry?
Key companies in the market include Esaote SpA, Hologic Inc, GE Healthcare, Shanghai United Imaging Healthcare Co Ltd, Koninklijke Philips N V, Siemens AG, FUJIFILM Holdings Corporation, Carestream Health, J Morita Corporation, Canon Medical Systems Corporation, Teknova Medical Systems Limited, Shimadzu Corporation.
3. What are the main segments of the APAC Medical Imaging Devices Industry?
The market segments include Modality, Application, End-User, Geography.
4. Can you provide details about the market size?
The market size is estimated to be USD 143.12 billion as of 2022.
5. What are some drivers contributing to market growth?
Rising Prevalence of Chronic Diseases; Technological Advancement in Imaging Modalities; Growing Emphasis on Early Diagnosis.
6. What are the notable trends driving market growth?
Oncology Segment is Expected to Witness a Healthy Growth in Coming Years.
7. Are there any restraints impacting market growth?
Lack of Skilled Radiologist; High Cost of Advanced Diagnostic Imaging Devices.
8. Can you provide examples of recent developments in the market?
October 2022: Luxonus Inc. received approval to market its photoacoustic 3D imaging system in Japan.
9. What pricing options are available for accessing the report?
Pricing options include single-user, multi-user, and enterprise licenses priced at USD 4750, USD 5250, and USD 8750 respectively.
10. Is the market size provided in terms of value or volume?
The market size is provided in terms of value, measured in billion and volume, measured in K Unit.
11. Are there any specific market keywords associated with the report?
Yes, the market keyword associated with the report is "APAC Medical Imaging Devices Industry," which aids in identifying and referencing the specific market segment covered.
12. How do I determine which pricing option suits my needs best?
The pricing options vary based on user requirements and access needs. Individual users may opt for single-user licenses, while businesses requiring broader access may choose multi-user or enterprise licenses for cost-effective access to the report.
13. Are there any additional resources or data provided in the APAC Medical Imaging Devices Industry report?
While the report offers comprehensive insights, it's advisable to review the specific contents or supplementary materials provided to ascertain if additional resources or data are available.
14. How can I stay updated on further developments or reports in the APAC Medical Imaging Devices Industry?
To stay informed about further developments, trends, and reports in the APAC Medical Imaging Devices Industry, consider subscribing to industry newsletters, following relevant companies and organizations, or regularly checking reputable industry news sources and publications.
Methodology
Step 1 - Identification of Relevant Samples Size from Population Database


Step 2 - Approaches for Defining Global Market Size (Value, Volume* & Price*)

Note*: In applicable scenarios
Step 3 - Data Sources
Primary Research
- Web Analytics
- Survey Reports
- Research Institute
- Latest Research Reports
- Opinion Leaders
Secondary Research
- Annual Reports
- White Paper
- Latest Press Release
- Industry Association
- Paid Database
- Investor Presentations

Step 4 - Data Triangulation
Involves using different sources of information in order to increase the validity of a study
These sources are likely to be stakeholders in a program - participants, other researchers, program staff, other community members, and so on.
Then we put all data in single framework & apply various statistical tools to find out the dynamic on the market.
During the analysis stage, feedback from the stakeholder groups would be compared to determine areas of agreement as well as areas of divergence