

Key Insights
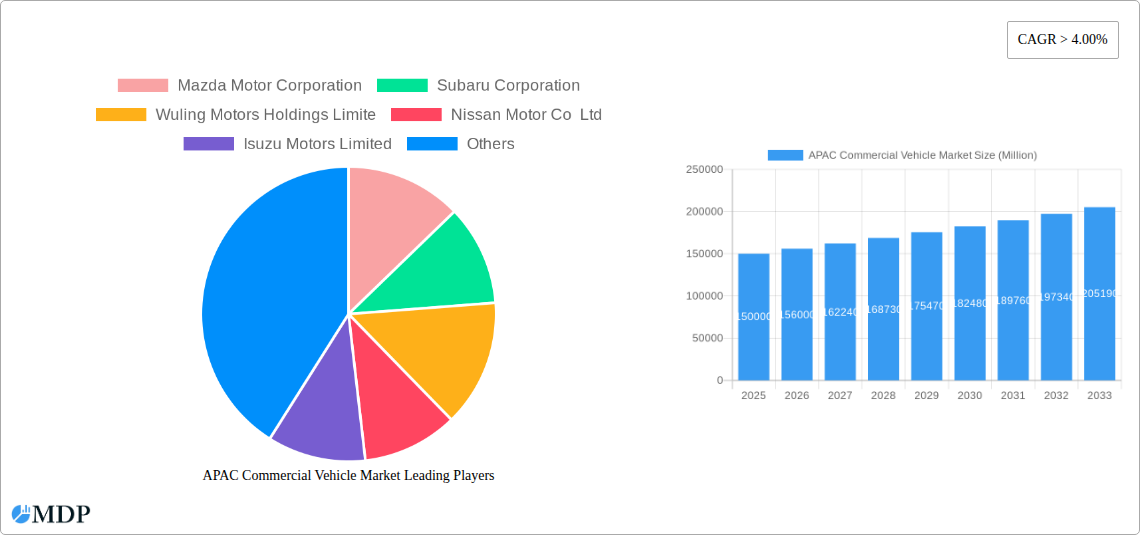
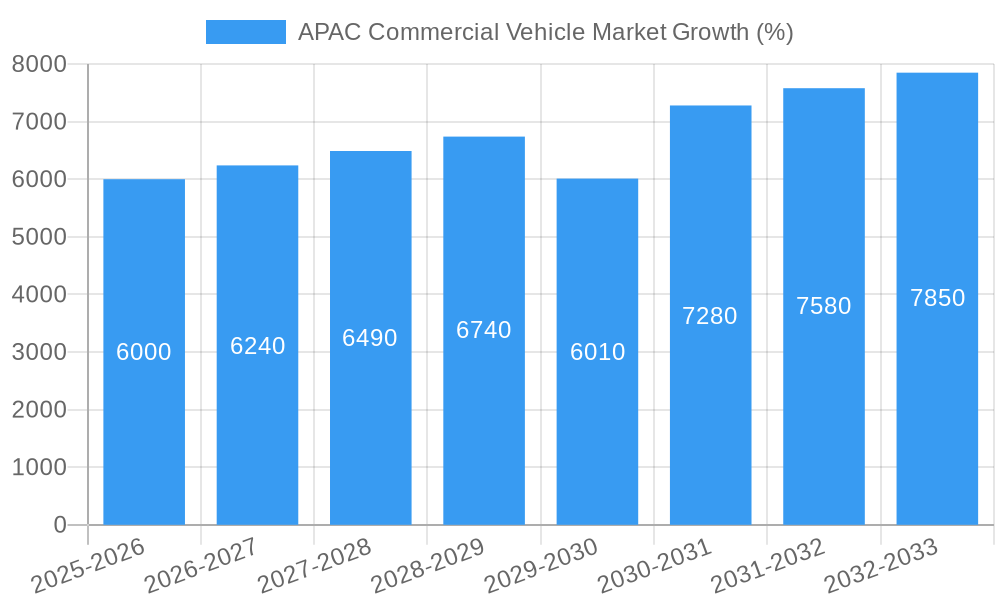
The Asia-Pacific (APAC) commercial vehicle market is experiencing robust growth, driven by increasing urbanization, expanding e-commerce logistics, and infrastructure development across the region. A compound annual growth rate (CAGR) exceeding 4% indicates a consistently expanding market, projected to reach significant value by 2033. Key market segments include LPG-fueled vehicles, hybrid and electric commercial vehicles, encompassing diverse vehicle types. Australia, China, India, Indonesia, Japan, Malaysia, South Korea, and Thailand represent major contributors to this growth, reflecting the diverse economic landscapes and infrastructural needs within the region. The market's expansion is fueled by government initiatives promoting sustainable transportation, a burgeoning middle class increasing demand for goods and services, and the ongoing modernization of logistics networks. However, challenges such as fluctuating fuel prices, stringent emission regulations, and the initial high cost of electric and hybrid vehicles pose potential restraints to the market's growth. Nevertheless, the long-term outlook remains positive, driven by technological advancements and sustained economic development across the APAC region.
The competitive landscape is marked by a mix of global and regional players, including major automotive manufacturers such as Toyota, Hyundai, and Tata Motors, alongside regional players like Wuling Motors and Anhui Ankai. These companies are strategically investing in research and development, focusing on fuel efficiency, technological innovation (especially in electric and hybrid technologies), and adapting their offerings to suit the specific needs of various APAC markets. Strategic partnerships, mergers, and acquisitions are likely to further shape the competitive dynamics in the coming years, as companies seek to expand their market share and solidify their position within this expanding sector. The market’s segmentation allows for focused strategies by manufacturers, catering to the unique needs of different countries and transportation sectors, leading to specialization and further market growth.
APAC Commercial Vehicle Market: A Comprehensive Report (2019-2033)
This in-depth report provides a comprehensive analysis of the Asia-Pacific Commercial Vehicle Market, offering invaluable insights for industry stakeholders. Covering the period 2019-2033, with a focus on 2025, this report dissects market dynamics, trends, leading players, and future opportunities across key segments. Maximize your understanding of this rapidly evolving market and make informed strategic decisions.
APAC Commercial Vehicle Market Dynamics & Concentration
The APAC commercial vehicle market is experiencing significant shifts driven by technological advancements, evolving regulatory landscapes, and dynamic consumer preferences. Market concentration is moderate, with a few major players holding substantial shares but numerous regional and niche players contributing significantly. Innovation in areas like hybrid and electric vehicles (HEVs) is reshaping the industry, impacting both market share and M&A activity. Stringent emission regulations are pushing manufacturers towards cleaner technologies. The rise of e-commerce and last-mile delivery solutions fuels demand for specific commercial vehicle types.
- Market Concentration: The top 5 players hold approximately xx% of the market share in 2025 (estimated).
- M&A Activity: An estimated xx M&A deals occurred in the APAC commercial vehicle sector between 2019 and 2024. The forecast for 2025-2033 suggests a further xx deals, primarily driven by the consolidation of smaller players and the expansion of electric vehicle technologies.
- Innovation Drivers: HEV technology, autonomous driving capabilities, and connected vehicle solutions are key innovation drivers.
- Regulatory Framework: Stringent emission norms and safety standards are influencing vehicle design and manufacturing.
- Product Substitutes: The rise of alternative transportation methods like rail and improved road infrastructure presents some level of substitution.
- End-User Trends: The growing e-commerce sector drives demand for delivery vehicles, while infrastructure development projects influence demand for heavy-duty vehicles.
APAC Commercial Vehicle Market Industry Trends & Analysis
The APAC commercial vehicle market exhibits robust growth, propelled by factors including expanding infrastructure, rising e-commerce activity, and supportive government policies. However, challenges such as fluctuating fuel prices, supply chain disruptions, and the evolving regulatory landscape necessitate a careful evaluation of market dynamics. The shift towards HEVs is accelerating, albeit gradually, and is expected to significantly impact the market's trajectory in the coming years. The CAGR for the overall market is projected to be xx% during the forecast period (2025-2033), with penetration of HEVs expected to reach xx% by 2033. Competitive intensity is high, with established players and new entrants vying for market share through technological advancements, strategic partnerships, and aggressive pricing strategies. Consumer preferences increasingly favor fuel efficiency, safety features, and advanced technologies.
Leading Markets & Segments in APAC Commercial Vehicle Market
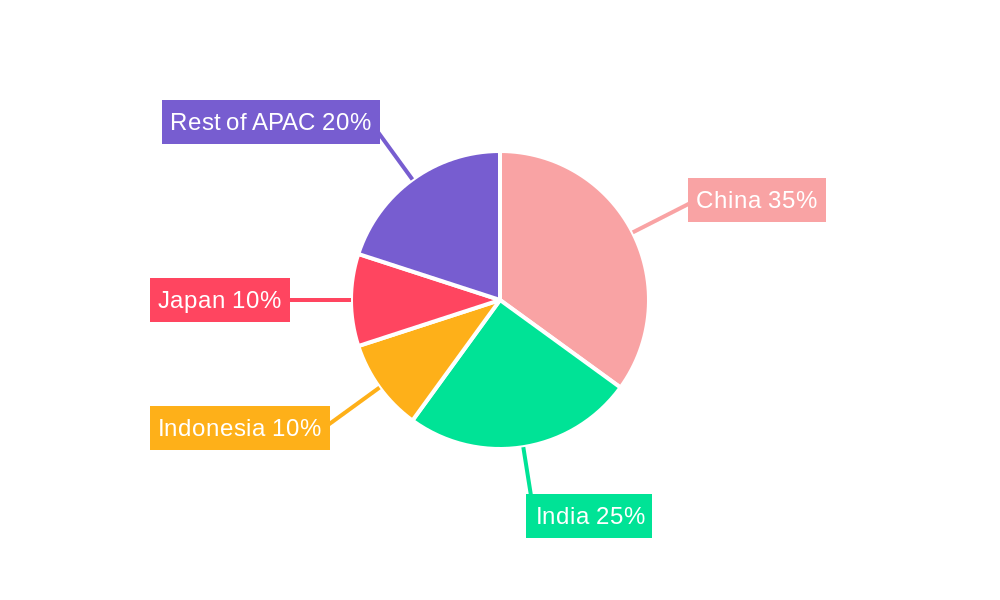
China remains the dominant market in APAC for commercial vehicles, driven by its robust infrastructure development, large industrial base, and expanding e-commerce sector. India's growing economy and expanding logistics industry are key contributors to its significant market share. Other notable markets include Japan, South Korea, and Thailand.
- Dominant Region: China
- Dominant Country: China
- Dominant Segment (Vehicle Type): Light Commercial Vehicles (LCVs)
- Dominant Segment (Propulsion Type): Internal Combustion Engine (ICE) vehicles currently dominate, but Hybrid and Electric vehicles (HEVs) are experiencing rapid growth.
- Dominant Segment (Fuel Type): Diesel remains dominant, with LPG showing steady but slower growth.
Key Drivers by Country:
- China: Extensive infrastructure projects, booming e-commerce, and government support for commercial vehicle manufacturing.
- India: Rapid economic growth, expanding logistics sector, and rising demand for transportation services.
- Japan: High technological advancement in vehicle manufacturing, focus on fuel efficiency and advanced safety features.
- South Korea: Strong domestic demand, technological innovation, and exports to other Asian markets.
- Thailand: Automotive manufacturing hub, regional export focus, and growing logistics industry.
APAC Commercial Vehicle Market Product Developments
Recent product developments focus on enhancing fuel efficiency, incorporating advanced driver-assistance systems (ADAS), and integrating connected vehicle technologies. The adoption of HEVs and battery electric vehicles (BEVs) is steadily increasing, driven by stricter emission regulations and growing environmental awareness. Manufacturers are also focusing on improving payload capacity and durability to meet the demands of diverse applications. The market is witnessing a trend toward modular vehicle platforms to improve cost-effectiveness and customization options.
Key Drivers of APAC Commercial Vehicle Market Growth
Several factors fuel the growth of the APAC commercial vehicle market. These include:
- Infrastructure Development: Extensive investments in road and rail infrastructure across the region.
- E-commerce Boom: The surge in online retail necessitates efficient last-mile delivery solutions.
- Government Initiatives: Supportive policies aimed at promoting transportation infrastructure and sustainable transportation.
- Technological Advancements: Innovations in engine technology, safety features, and connected vehicle technologies.
Challenges in the APAC Commercial Vehicle Market
Challenges facing the market include:
- Supply Chain Disruptions: Global supply chain volatility impacts component availability and manufacturing costs. The estimated impact on 2025 production is xx Million units.
- Stringent Emission Regulations: Meeting stringent environmental regulations increases manufacturing costs and requires technological upgrades.
- Competitive Pressure: Intense competition among established players and new entrants. Price wars can impact profitability.
Emerging Opportunities in APAP Commercial Vehicle Market
Significant opportunities exist in the APAC commercial vehicle market:
- Growth of HEVs and BEVs: This sector presents enormous potential, driven by governmental incentives and increasing environmental awareness.
- Autonomous Driving Technology: The integration of autonomous driving features will drive innovation and improve efficiency.
- Digitalization and Connected Vehicles: The increasing connectivity of commercial vehicles improves fleet management and maintenance.
Leading Players in the APAC Commercial Vehicle Market Sector
- Mazda Motor Corporation
- Subaru Corporation
- Wuling Motors Holdings Limite
- Nissan Motor Co Ltd
- Isuzu Motors Limited
- General Motors Company
- Anhui Ankai Automobile Co Ltd
- Dongfeng Motor Corporation
- Daihatsu Motor Co Ltd
- Tata Motors Limited
- Renault-Nissan-Mitsubishi Alliance
- Hyundai Motor Company
- Kia Corporation
- Toyota Motor Corporation
- Honda Motor Co Ltd
- Great Wall Motor Company Ltd (GWM)
- Mitsubishi Motors Corporation
- Suzuki Motor Corporation
- Ford Motor Company
Key Milestones in APAC Commercial Vehicle Market Industry
- August 2023: General Motors announces the launch of an all-electric Cadillac Escalade in late 2024. This signals a significant commitment to the electric vehicle market in APAC.
- August 2023: General Motors reinforces its dedication to electric vehicles in the Middle East, indicating potential expansion in the APAC region.
- August 2023: Toyota Kirloskar Motor launches the all-new MPV Vellfire strong hybrid electric vehicle (SHEV), priced between INR 11.99 Million and INR 12.99 Million. This signifies growing consumer demand for hybrid vehicles in the Indian market and potentially the wider APAC region.
Strategic Outlook for APAC Commercial Vehicle Market
The APAC commercial vehicle market presents substantial growth potential, driven by continued infrastructure development, the rise of e-commerce, and the increasing adoption of HEVs and BEVs. Strategic partnerships, technological innovations, and effective supply chain management will be crucial for success in this dynamic market. Companies that can adapt to evolving consumer preferences and regulatory landscapes will be best positioned to capitalize on future opportunities.
APAC Commercial Vehicle Market Segmentation
-
1. Vehicle Type
-
1.1. Commercial Vehicles
- 1.1.1. Buses
- 1.1.2. Heavy-duty Commercial Trucks
- 1.1.3. Light Commercial Pick-up Trucks
- 1.1.4. Light Commercial Vans
- 1.1.5. Medium-duty Commercial Trucks
-
1.1. Commercial Vehicles
-
2. Propulsion Type
-
2.1. Hybrid and Electric Vehicles
-
2.1.1. By Fuel Category
- 2.1.1.1. BEV
- 2.1.1.2. FCEV
- 2.1.1.3. HEV
- 2.1.1.4. PHEV
-
2.1.1. By Fuel Category
-
2.2. ICE
- 2.2.1. CNG
- 2.2.2. Diesel
- 2.2.3. Gasoline
- 2.2.4. LPG
-
2.1. Hybrid and Electric Vehicles
APAC Commercial Vehicle Market Segmentation By Geography
-
1. North America
- 1.1. United States
- 1.2. Canada
- 1.3. Mexico
-
2. South America
- 2.1. Brazil
- 2.2. Argentina
- 2.3. Rest of South America
-
3. Europe
- 3.1. United Kingdom
- 3.2. Germany
- 3.3. France
- 3.4. Italy
- 3.5. Spain
- 3.6. Russia
- 3.7. Benelux
- 3.8. Nordics
- 3.9. Rest of Europe
-
4. Middle East & Africa
- 4.1. Turkey
- 4.2. Israel
- 4.3. GCC
- 4.4. North Africa
- 4.5. South Africa
- 4.6. Rest of Middle East & Africa
-
5. Asia Pacific
- 5.1. China
- 5.2. India
- 5.3. Japan
- 5.4. South Korea
- 5.5. ASEAN
- 5.6. Oceania
- 5.7. Rest of Asia Pacific
APAC Commercial Vehicle Market REPORT HIGHLIGHTS
| Aspects | Details |
|---|---|
| Study Period | 2019-2033 |
| Base Year | 2024 |
| Estimated Year | 2025 |
| Forecast Period | 2025-2033 |
| Historical Period | 2019-2024 |
| Growth Rate | CAGR of > 4.00% from 2019-2033 |
| Segmentation |
|
Table of Contents
- 1. Introduction
- 1.1. Research Scope
- 1.2. Market Segmentation
- 1.3. Research Methodology
- 1.4. Definitions and Assumptions
- 2. Executive Summary
- 2.1. Introduction
- 3. Market Dynamics
- 3.1. Introduction
- 3.2. Market Drivers
- 3.2.1. Surge in Trend of Yacht Tourism
- 3.3. Market Restrains
- 3.3.1. Higher Rentals During Peak Season
- 3.4. Market Trends
- 3.4.1. OTHER KEY INDUSTRY TRENDS COVERED IN THE REPORT
- 4. Market Factor Analysis
- 4.1. Porters Five Forces
- 4.2. Supply/Value Chain
- 4.3. PESTEL analysis
- 4.4. Market Entropy
- 4.5. Patent/Trademark Analysis
- 5. Global APAC Commercial Vehicle Market Analysis, Insights and Forecast, 2019-2031
- 5.1. Market Analysis, Insights and Forecast - by Vehicle Type
- 5.1.1. Commercial Vehicles
- 5.1.1.1. Buses
- 5.1.1.2. Heavy-duty Commercial Trucks
- 5.1.1.3. Light Commercial Pick-up Trucks
- 5.1.1.4. Light Commercial Vans
- 5.1.1.5. Medium-duty Commercial Trucks
- 5.1.1. Commercial Vehicles
- 5.2. Market Analysis, Insights and Forecast - by Propulsion Type
- 5.2.1. Hybrid and Electric Vehicles
- 5.2.1.1. By Fuel Category
- 5.2.1.1.1. BEV
- 5.2.1.1.2. FCEV
- 5.2.1.1.3. HEV
- 5.2.1.1.4. PHEV
- 5.2.1.1. By Fuel Category
- 5.2.2. ICE
- 5.2.2.1. CNG
- 5.2.2.2. Diesel
- 5.2.2.3. Gasoline
- 5.2.2.4. LPG
- 5.2.1. Hybrid and Electric Vehicles
- 5.3. Market Analysis, Insights and Forecast - by Region
- 5.3.1. North America
- 5.3.2. South America
- 5.3.3. Europe
- 5.3.4. Middle East & Africa
- 5.3.5. Asia Pacific
- 5.1. Market Analysis, Insights and Forecast - by Vehicle Type
- 6. North America APAC Commercial Vehicle Market Analysis, Insights and Forecast, 2019-2031
- 6.1. Market Analysis, Insights and Forecast - by Vehicle Type
- 6.1.1. Commercial Vehicles
- 6.1.1.1. Buses
- 6.1.1.2. Heavy-duty Commercial Trucks
- 6.1.1.3. Light Commercial Pick-up Trucks
- 6.1.1.4. Light Commercial Vans
- 6.1.1.5. Medium-duty Commercial Trucks
- 6.1.1. Commercial Vehicles
- 6.2. Market Analysis, Insights and Forecast - by Propulsion Type
- 6.2.1. Hybrid and Electric Vehicles
- 6.2.1.1. By Fuel Category
- 6.2.1.1.1. BEV
- 6.2.1.1.2. FCEV
- 6.2.1.1.3. HEV
- 6.2.1.1.4. PHEV
- 6.2.1.1. By Fuel Category
- 6.2.2. ICE
- 6.2.2.1. CNG
- 6.2.2.2. Diesel
- 6.2.2.3. Gasoline
- 6.2.2.4. LPG
- 6.2.1. Hybrid and Electric Vehicles
- 6.1. Market Analysis, Insights and Forecast - by Vehicle Type
- 7. South America APAC Commercial Vehicle Market Analysis, Insights and Forecast, 2019-2031
- 7.1. Market Analysis, Insights and Forecast - by Vehicle Type
- 7.1.1. Commercial Vehicles
- 7.1.1.1. Buses
- 7.1.1.2. Heavy-duty Commercial Trucks
- 7.1.1.3. Light Commercial Pick-up Trucks
- 7.1.1.4. Light Commercial Vans
- 7.1.1.5. Medium-duty Commercial Trucks
- 7.1.1. Commercial Vehicles
- 7.2. Market Analysis, Insights and Forecast - by Propulsion Type
- 7.2.1. Hybrid and Electric Vehicles
- 7.2.1.1. By Fuel Category
- 7.2.1.1.1. BEV
- 7.2.1.1.2. FCEV
- 7.2.1.1.3. HEV
- 7.2.1.1.4. PHEV
- 7.2.1.1. By Fuel Category
- 7.2.2. ICE
- 7.2.2.1. CNG
- 7.2.2.2. Diesel
- 7.2.2.3. Gasoline
- 7.2.2.4. LPG
- 7.2.1. Hybrid and Electric Vehicles
- 7.1. Market Analysis, Insights and Forecast - by Vehicle Type
- 8. Europe APAC Commercial Vehicle Market Analysis, Insights and Forecast, 2019-2031
- 8.1. Market Analysis, Insights and Forecast - by Vehicle Type
- 8.1.1. Commercial Vehicles
- 8.1.1.1. Buses
- 8.1.1.2. Heavy-duty Commercial Trucks
- 8.1.1.3. Light Commercial Pick-up Trucks
- 8.1.1.4. Light Commercial Vans
- 8.1.1.5. Medium-duty Commercial Trucks
- 8.1.1. Commercial Vehicles
- 8.2. Market Analysis, Insights and Forecast - by Propulsion Type
- 8.2.1. Hybrid and Electric Vehicles
- 8.2.1.1. By Fuel Category
- 8.2.1.1.1. BEV
- 8.2.1.1.2. FCEV
- 8.2.1.1.3. HEV
- 8.2.1.1.4. PHEV
- 8.2.1.1. By Fuel Category
- 8.2.2. ICE
- 8.2.2.1. CNG
- 8.2.2.2. Diesel
- 8.2.2.3. Gasoline
- 8.2.2.4. LPG
- 8.2.1. Hybrid and Electric Vehicles
- 8.1. Market Analysis, Insights and Forecast - by Vehicle Type
- 9. Middle East & Africa APAC Commercial Vehicle Market Analysis, Insights and Forecast, 2019-2031
- 9.1. Market Analysis, Insights and Forecast - by Vehicle Type
- 9.1.1. Commercial Vehicles
- 9.1.1.1. Buses
- 9.1.1.2. Heavy-duty Commercial Trucks
- 9.1.1.3. Light Commercial Pick-up Trucks
- 9.1.1.4. Light Commercial Vans
- 9.1.1.5. Medium-duty Commercial Trucks
- 9.1.1. Commercial Vehicles
- 9.2. Market Analysis, Insights and Forecast - by Propulsion Type
- 9.2.1. Hybrid and Electric Vehicles
- 9.2.1.1. By Fuel Category
- 9.2.1.1.1. BEV
- 9.2.1.1.2. FCEV
- 9.2.1.1.3. HEV
- 9.2.1.1.4. PHEV
- 9.2.1.1. By Fuel Category
- 9.2.2. ICE
- 9.2.2.1. CNG
- 9.2.2.2. Diesel
- 9.2.2.3. Gasoline
- 9.2.2.4. LPG
- 9.2.1. Hybrid and Electric Vehicles
- 9.1. Market Analysis, Insights and Forecast - by Vehicle Type
- 10. Asia Pacific APAC Commercial Vehicle Market Analysis, Insights and Forecast, 2019-2031
- 10.1. Market Analysis, Insights and Forecast - by Vehicle Type
- 10.1.1. Commercial Vehicles
- 10.1.1.1. Buses
- 10.1.1.2. Heavy-duty Commercial Trucks
- 10.1.1.3. Light Commercial Pick-up Trucks
- 10.1.1.4. Light Commercial Vans
- 10.1.1.5. Medium-duty Commercial Trucks
- 10.1.1. Commercial Vehicles
- 10.2. Market Analysis, Insights and Forecast - by Propulsion Type
- 10.2.1. Hybrid and Electric Vehicles
- 10.2.1.1. By Fuel Category
- 10.2.1.1.1. BEV
- 10.2.1.1.2. FCEV
- 10.2.1.1.3. HEV
- 10.2.1.1.4. PHEV
- 10.2.1.1. By Fuel Category
- 10.2.2. ICE
- 10.2.2.1. CNG
- 10.2.2.2. Diesel
- 10.2.2.3. Gasoline
- 10.2.2.4. LPG
- 10.2.1. Hybrid and Electric Vehicles
- 10.1. Market Analysis, Insights and Forecast - by Vehicle Type
- 11. Competitive Analysis
- 11.1. Global Market Share Analysis 2024
- 11.2. Company Profiles
- 11.2.1 Mazda Motor Corporation
- 11.2.1.1. Overview
- 11.2.1.2. Products
- 11.2.1.3. SWOT Analysis
- 11.2.1.4. Recent Developments
- 11.2.1.5. Financials (Based on Availability)
- 11.2.2 Subaru Corporation
- 11.2.2.1. Overview
- 11.2.2.2. Products
- 11.2.2.3. SWOT Analysis
- 11.2.2.4. Recent Developments
- 11.2.2.5. Financials (Based on Availability)
- 11.2.3 Wuling Motors Holdings Limite
- 11.2.3.1. Overview
- 11.2.3.2. Products
- 11.2.3.3. SWOT Analysis
- 11.2.3.4. Recent Developments
- 11.2.3.5. Financials (Based on Availability)
- 11.2.4 Nissan Motor Co Ltd
- 11.2.4.1. Overview
- 11.2.4.2. Products
- 11.2.4.3. SWOT Analysis
- 11.2.4.4. Recent Developments
- 11.2.4.5. Financials (Based on Availability)
- 11.2.5 Isuzu Motors Limited
- 11.2.5.1. Overview
- 11.2.5.2. Products
- 11.2.5.3. SWOT Analysis
- 11.2.5.4. Recent Developments
- 11.2.5.5. Financials (Based on Availability)
- 11.2.6 General Motors Company
- 11.2.6.1. Overview
- 11.2.6.2. Products
- 11.2.6.3. SWOT Analysis
- 11.2.6.4. Recent Developments
- 11.2.6.5. Financials (Based on Availability)
- 11.2.7 Anhui Ankai Automobile Co Ltd
- 11.2.7.1. Overview
- 11.2.7.2. Products
- 11.2.7.3. SWOT Analysis
- 11.2.7.4. Recent Developments
- 11.2.7.5. Financials (Based on Availability)
- 11.2.8 Dongfeng Motor Corporation
- 11.2.8.1. Overview
- 11.2.8.2. Products
- 11.2.8.3. SWOT Analysis
- 11.2.8.4. Recent Developments
- 11.2.8.5. Financials (Based on Availability)
- 11.2.9 Daihatsu Motor Co Ltd
- 11.2.9.1. Overview
- 11.2.9.2. Products
- 11.2.9.3. SWOT Analysis
- 11.2.9.4. Recent Developments
- 11.2.9.5. Financials (Based on Availability)
- 11.2.10 Tata Motors Limited
- 11.2.10.1. Overview
- 11.2.10.2. Products
- 11.2.10.3. SWOT Analysis
- 11.2.10.4. Recent Developments
- 11.2.10.5. Financials (Based on Availability)
- 11.2.11 Renault-Nissan-Mitsubishi Alliance
- 11.2.11.1. Overview
- 11.2.11.2. Products
- 11.2.11.3. SWOT Analysis
- 11.2.11.4. Recent Developments
- 11.2.11.5. Financials (Based on Availability)
- 11.2.12 Hyundai Motor Company
- 11.2.12.1. Overview
- 11.2.12.2. Products
- 11.2.12.3. SWOT Analysis
- 11.2.12.4. Recent Developments
- 11.2.12.5. Financials (Based on Availability)
- 11.2.13 Kia Corporation
- 11.2.13.1. Overview
- 11.2.13.2. Products
- 11.2.13.3. SWOT Analysis
- 11.2.13.4. Recent Developments
- 11.2.13.5. Financials (Based on Availability)
- 11.2.14 Toyota Motor Corporation
- 11.2.14.1. Overview
- 11.2.14.2. Products
- 11.2.14.3. SWOT Analysis
- 11.2.14.4. Recent Developments
- 11.2.14.5. Financials (Based on Availability)
- 11.2.15 Honda Motor Co Ltd
- 11.2.15.1. Overview
- 11.2.15.2. Products
- 11.2.15.3. SWOT Analysis
- 11.2.15.4. Recent Developments
- 11.2.15.5. Financials (Based on Availability)
- 11.2.16 Great Wall Motor Company Ltd (GWM)
- 11.2.16.1. Overview
- 11.2.16.2. Products
- 11.2.16.3. SWOT Analysis
- 11.2.16.4. Recent Developments
- 11.2.16.5. Financials (Based on Availability)
- 11.2.17 Mitsubishi Motors Corporation
- 11.2.17.1. Overview
- 11.2.17.2. Products
- 11.2.17.3. SWOT Analysis
- 11.2.17.4. Recent Developments
- 11.2.17.5. Financials (Based on Availability)
- 11.2.18 Suzuki Motor Corporation
- 11.2.18.1. Overview
- 11.2.18.2. Products
- 11.2.18.3. SWOT Analysis
- 11.2.18.4. Recent Developments
- 11.2.18.5. Financials (Based on Availability)
- 11.2.19 Ford Motor Company
- 11.2.19.1. Overview
- 11.2.19.2. Products
- 11.2.19.3. SWOT Analysis
- 11.2.19.4. Recent Developments
- 11.2.19.5. Financials (Based on Availability)
- 11.2.1 Mazda Motor Corporation
List of Figures
- Figure 1: Global APAC Commercial Vehicle Market Revenue Breakdown (Million, %) by Region 2024 & 2032
- Figure 2: North America APAC Commercial Vehicle Market Revenue (Million), by Vehicle Type 2024 & 2032
- Figure 3: North America APAC Commercial Vehicle Market Revenue Share (%), by Vehicle Type 2024 & 2032
- Figure 4: North America APAC Commercial Vehicle Market Revenue (Million), by Propulsion Type 2024 & 2032
- Figure 5: North America APAC Commercial Vehicle Market Revenue Share (%), by Propulsion Type 2024 & 2032
- Figure 6: North America APAC Commercial Vehicle Market Revenue (Million), by Country 2024 & 2032
- Figure 7: North America APAC Commercial Vehicle Market Revenue Share (%), by Country 2024 & 2032
- Figure 8: South America APAC Commercial Vehicle Market Revenue (Million), by Vehicle Type 2024 & 2032
- Figure 9: South America APAC Commercial Vehicle Market Revenue Share (%), by Vehicle Type 2024 & 2032
- Figure 10: South America APAC Commercial Vehicle Market Revenue (Million), by Propulsion Type 2024 & 2032
- Figure 11: South America APAC Commercial Vehicle Market Revenue Share (%), by Propulsion Type 2024 & 2032
- Figure 12: South America APAC Commercial Vehicle Market Revenue (Million), by Country 2024 & 2032
- Figure 13: South America APAC Commercial Vehicle Market Revenue Share (%), by Country 2024 & 2032
- Figure 14: Europe APAC Commercial Vehicle Market Revenue (Million), by Vehicle Type 2024 & 2032
- Figure 15: Europe APAC Commercial Vehicle Market Revenue Share (%), by Vehicle Type 2024 & 2032
- Figure 16: Europe APAC Commercial Vehicle Market Revenue (Million), by Propulsion Type 2024 & 2032
- Figure 17: Europe APAC Commercial Vehicle Market Revenue Share (%), by Propulsion Type 2024 & 2032
- Figure 18: Europe APAC Commercial Vehicle Market Revenue (Million), by Country 2024 & 2032
- Figure 19: Europe APAC Commercial Vehicle Market Revenue Share (%), by Country 2024 & 2032
- Figure 20: Middle East & Africa APAC Commercial Vehicle Market Revenue (Million), by Vehicle Type 2024 & 2032
- Figure 21: Middle East & Africa APAC Commercial Vehicle Market Revenue Share (%), by Vehicle Type 2024 & 2032
- Figure 22: Middle East & Africa APAC Commercial Vehicle Market Revenue (Million), by Propulsion Type 2024 & 2032
- Figure 23: Middle East & Africa APAC Commercial Vehicle Market Revenue Share (%), by Propulsion Type 2024 & 2032
- Figure 24: Middle East & Africa APAC Commercial Vehicle Market Revenue (Million), by Country 2024 & 2032
- Figure 25: Middle East & Africa APAC Commercial Vehicle Market Revenue Share (%), by Country 2024 & 2032
- Figure 26: Asia Pacific APAC Commercial Vehicle Market Revenue (Million), by Vehicle Type 2024 & 2032
- Figure 27: Asia Pacific APAC Commercial Vehicle Market Revenue Share (%), by Vehicle Type 2024 & 2032
- Figure 28: Asia Pacific APAC Commercial Vehicle Market Revenue (Million), by Propulsion Type 2024 & 2032
- Figure 29: Asia Pacific APAC Commercial Vehicle Market Revenue Share (%), by Propulsion Type 2024 & 2032
- Figure 30: Asia Pacific APAC Commercial Vehicle Market Revenue (Million), by Country 2024 & 2032
- Figure 31: Asia Pacific APAC Commercial Vehicle Market Revenue Share (%), by Country 2024 & 2032
List of Tables
- Table 1: Global APAC Commercial Vehicle Market Revenue Million Forecast, by Region 2019 & 2032
- Table 2: Global APAC Commercial Vehicle Market Revenue Million Forecast, by Vehicle Type 2019 & 2032
- Table 3: Global APAC Commercial Vehicle Market Revenue Million Forecast, by Propulsion Type 2019 & 2032
- Table 4: Global APAC Commercial Vehicle Market Revenue Million Forecast, by Region 2019 & 2032
- Table 5: Global APAC Commercial Vehicle Market Revenue Million Forecast, by Vehicle Type 2019 & 2032
- Table 6: Global APAC Commercial Vehicle Market Revenue Million Forecast, by Propulsion Type 2019 & 2032
- Table 7: Global APAC Commercial Vehicle Market Revenue Million Forecast, by Country 2019 & 2032
- Table 8: United States APAC Commercial Vehicle Market Revenue (Million) Forecast, by Application 2019 & 2032
- Table 9: Canada APAC Commercial Vehicle Market Revenue (Million) Forecast, by Application 2019 & 2032
- Table 10: Mexico APAC Commercial Vehicle Market Revenue (Million) Forecast, by Application 2019 & 2032
- Table 11: Global APAC Commercial Vehicle Market Revenue Million Forecast, by Vehicle Type 2019 & 2032
- Table 12: Global APAC Commercial Vehicle Market Revenue Million Forecast, by Propulsion Type 2019 & 2032
- Table 13: Global APAC Commercial Vehicle Market Revenue Million Forecast, by Country 2019 & 2032
- Table 14: Brazil APAC Commercial Vehicle Market Revenue (Million) Forecast, by Application 2019 & 2032
- Table 15: Argentina APAC Commercial Vehicle Market Revenue (Million) Forecast, by Application 2019 & 2032
- Table 16: Rest of South America APAC Commercial Vehicle Market Revenue (Million) Forecast, by Application 2019 & 2032
- Table 17: Global APAC Commercial Vehicle Market Revenue Million Forecast, by Vehicle Type 2019 & 2032
- Table 18: Global APAC Commercial Vehicle Market Revenue Million Forecast, by Propulsion Type 2019 & 2032
- Table 19: Global APAC Commercial Vehicle Market Revenue Million Forecast, by Country 2019 & 2032
- Table 20: United Kingdom APAC Commercial Vehicle Market Revenue (Million) Forecast, by Application 2019 & 2032
- Table 21: Germany APAC Commercial Vehicle Market Revenue (Million) Forecast, by Application 2019 & 2032
- Table 22: France APAC Commercial Vehicle Market Revenue (Million) Forecast, by Application 2019 & 2032
- Table 23: Italy APAC Commercial Vehicle Market Revenue (Million) Forecast, by Application 2019 & 2032
- Table 24: Spain APAC Commercial Vehicle Market Revenue (Million) Forecast, by Application 2019 & 2032
- Table 25: Russia APAC Commercial Vehicle Market Revenue (Million) Forecast, by Application 2019 & 2032
- Table 26: Benelux APAC Commercial Vehicle Market Revenue (Million) Forecast, by Application 2019 & 2032
- Table 27: Nordics APAC Commercial Vehicle Market Revenue (Million) Forecast, by Application 2019 & 2032
- Table 28: Rest of Europe APAC Commercial Vehicle Market Revenue (Million) Forecast, by Application 2019 & 2032
- Table 29: Global APAC Commercial Vehicle Market Revenue Million Forecast, by Vehicle Type 2019 & 2032
- Table 30: Global APAC Commercial Vehicle Market Revenue Million Forecast, by Propulsion Type 2019 & 2032
- Table 31: Global APAC Commercial Vehicle Market Revenue Million Forecast, by Country 2019 & 2032
- Table 32: Turkey APAC Commercial Vehicle Market Revenue (Million) Forecast, by Application 2019 & 2032
- Table 33: Israel APAC Commercial Vehicle Market Revenue (Million) Forecast, by Application 2019 & 2032
- Table 34: GCC APAC Commercial Vehicle Market Revenue (Million) Forecast, by Application 2019 & 2032
- Table 35: North Africa APAC Commercial Vehicle Market Revenue (Million) Forecast, by Application 2019 & 2032
- Table 36: South Africa APAC Commercial Vehicle Market Revenue (Million) Forecast, by Application 2019 & 2032
- Table 37: Rest of Middle East & Africa APAC Commercial Vehicle Market Revenue (Million) Forecast, by Application 2019 & 2032
- Table 38: Global APAC Commercial Vehicle Market Revenue Million Forecast, by Vehicle Type 2019 & 2032
- Table 39: Global APAC Commercial Vehicle Market Revenue Million Forecast, by Propulsion Type 2019 & 2032
- Table 40: Global APAC Commercial Vehicle Market Revenue Million Forecast, by Country 2019 & 2032
- Table 41: China APAC Commercial Vehicle Market Revenue (Million) Forecast, by Application 2019 & 2032
- Table 42: India APAC Commercial Vehicle Market Revenue (Million) Forecast, by Application 2019 & 2032
- Table 43: Japan APAC Commercial Vehicle Market Revenue (Million) Forecast, by Application 2019 & 2032
- Table 44: South Korea APAC Commercial Vehicle Market Revenue (Million) Forecast, by Application 2019 & 2032
- Table 45: ASEAN APAC Commercial Vehicle Market Revenue (Million) Forecast, by Application 2019 & 2032
- Table 46: Oceania APAC Commercial Vehicle Market Revenue (Million) Forecast, by Application 2019 & 2032
- Table 47: Rest of Asia Pacific APAC Commercial Vehicle Market Revenue (Million) Forecast, by Application 2019 & 2032
Frequently Asked Questions
1. What is the projected Compound Annual Growth Rate (CAGR) of the APAC Commercial Vehicle Market?
The projected CAGR is approximately > 4.00%.
2. Which companies are prominent players in the APAC Commercial Vehicle Market?
Key companies in the market include Mazda Motor Corporation, Subaru Corporation, Wuling Motors Holdings Limite, Nissan Motor Co Ltd, Isuzu Motors Limited, General Motors Company, Anhui Ankai Automobile Co Ltd, Dongfeng Motor Corporation, Daihatsu Motor Co Ltd, Tata Motors Limited, Renault-Nissan-Mitsubishi Alliance, Hyundai Motor Company, Kia Corporation, Toyota Motor Corporation, Honda Motor Co Ltd, Great Wall Motor Company Ltd (GWM), Mitsubishi Motors Corporation, Suzuki Motor Corporation, Ford Motor Company.
3. What are the main segments of the APAC Commercial Vehicle Market?
The market segments include Vehicle Type, Propulsion Type.
4. Can you provide details about the market size?
The market size is estimated to be USD XX Million as of 2022.
5. What are some drivers contributing to market growth?
Surge in Trend of Yacht Tourism.
6. What are the notable trends driving market growth?
OTHER KEY INDUSTRY TRENDS COVERED IN THE REPORT.
7. Are there any restraints impacting market growth?
Higher Rentals During Peak Season.
8. Can you provide examples of recent developments in the market?
August 2023: General Motors will launch an all-electric Cadillac Escalade in late 2024August 2023: General Motors doubles down on plans for an electric future in the Middle East.August 2023: Toyota Kirloskar Motor launched the all-new MPV Vellfire strong hybrid electric vehicle (SHEV) for a starting price of INR 11.99 million and going to INR 12.99 million.
9. What pricing options are available for accessing the report?
Pricing options include single-user, multi-user, and enterprise licenses priced at USD 3800, USD 4500, and USD 5800 respectively.
10. Is the market size provided in terms of value or volume?
The market size is provided in terms of value, measured in Million.
11. Are there any specific market keywords associated with the report?
Yes, the market keyword associated with the report is "APAC Commercial Vehicle Market," which aids in identifying and referencing the specific market segment covered.
12. How do I determine which pricing option suits my needs best?
The pricing options vary based on user requirements and access needs. Individual users may opt for single-user licenses, while businesses requiring broader access may choose multi-user or enterprise licenses for cost-effective access to the report.
13. Are there any additional resources or data provided in the APAC Commercial Vehicle Market report?
While the report offers comprehensive insights, it's advisable to review the specific contents or supplementary materials provided to ascertain if additional resources or data are available.
14. How can I stay updated on further developments or reports in the APAC Commercial Vehicle Market?
To stay informed about further developments, trends, and reports in the APAC Commercial Vehicle Market, consider subscribing to industry newsletters, following relevant companies and organizations, or regularly checking reputable industry news sources and publications.
Methodology
Step 1 - Identification of Relevant Samples Size from Population Database


Step 2 - Approaches for Defining Global Market Size (Value, Volume* & Price*)

Note*: In applicable scenarios
Step 3 - Data Sources
Primary Research
- Web Analytics
- Survey Reports
- Research Institute
- Latest Research Reports
- Opinion Leaders
Secondary Research
- Annual Reports
- White Paper
- Latest Press Release
- Industry Association
- Paid Database
- Investor Presentations

Step 4 - Data Triangulation
Involves using different sources of information in order to increase the validity of a study
These sources are likely to be stakeholders in a program - participants, other researchers, program staff, other community members, and so on.
Then we put all data in single framework & apply various statistical tools to find out the dynamic on the market.
During the analysis stage, feedback from the stakeholder groups would be compared to determine areas of agreement as well as areas of divergence
