

Key Insights
The Asia-Pacific (APAC) carbon fiber building materials market is experiencing robust growth, driven by the region's burgeoning construction and infrastructure sectors, increasing demand for lightweight and high-strength materials, and a rising focus on sustainable construction practices. The market's Compound Annual Growth Rate (CAGR) exceeding 13% from 2019 to 2024 suggests a significant expansion trajectory, projected to continue throughout the forecast period (2025-2033). Key drivers include government initiatives promoting sustainable infrastructure development, rapid urbanization in countries like China, India, and Southeast Asia, and the increasing adoption of carbon fiber reinforced polymers (CFRP) in building applications such as bridges, skyscrapers, and prefabricated structures. The growth is further fueled by technological advancements leading to cost reductions in carbon fiber production and improved processing techniques, making it a more competitive alternative to traditional building materials. While raw material costs and supply chain complexities remain potential restraints, the overall market outlook remains positive, with significant opportunities for manufacturers and investors.
Within APAC, China is expected to dominate the market, followed by Japan, India, and South Korea. These countries are characterized by substantial infrastructure investments, a growing middle class demanding better housing, and proactive government support for innovative construction technologies. However, other Southeast Asian nations are also exhibiting strong growth potential due to rising urbanization and industrialization. The market segmentation reveals a preference for virgin carbon fiber (VCF) over recycled carbon fiber (RCF) currently, due to perceived performance advantages and lower initial costs, though RCF adoption is predicted to increase in the coming years driven by environmental concerns and cost-efficiency improvements. The major application areas include composite materials for structural components and textile applications for reinforcing concrete and other materials. Significant opportunities exist in exploring new applications such as microelectrodes and catalysis within the building sector, but adoption in these niche areas is expected to be gradual.

APAC Carbon Fiber Building Materials Industry: A Comprehensive Market Report (2019-2033)
This in-depth report provides a comprehensive analysis of the Asia-Pacific (APAC) carbon fiber building materials industry, offering invaluable insights for stakeholders, investors, and industry professionals. Covering the period from 2019 to 2033, with a focus on 2025, this report unveils market dynamics, growth drivers, challenges, and future opportunities within this rapidly evolving sector. The study encompasses key segments, including raw materials (Polyacrylonitrile (PAN), Petroleum Pitch, and Rayon), fiber types (Virgin Fiber (VCF) and Recycled Fiber (RCF)), applications (composite materials, textiles, microelectrodes, and catalysis), and end-user industries (aerospace & defense, alternative energy, automotive, construction & infrastructure, sporting goods, and others). Market sizing is provided in Millions USD.
APAC Carbon Fiber Building Materials Industry Market Dynamics & Concentration
The APAC carbon fiber building materials market exhibits a moderately concentrated landscape, with several multinational and regional players dominating. Market share analysis reveals that the top 5 players hold approximately xx% of the market (2024), while the remaining share is distributed among numerous smaller companies. Innovation is a key driver, with continuous advancements in fiber production techniques and composite material formulations. Stringent environmental regulations, promoting sustainable construction materials, are significantly influencing market growth. Product substitutes, such as fiberglass and other advanced composites, present competition, though carbon fiber's superior strength-to-weight ratio remains a significant advantage.
End-user trends, particularly in the booming construction and infrastructure sectors across APAC, are driving demand. The increasing adoption of carbon fiber reinforced polymers (CFRP) in infrastructure projects like bridges and high-rise buildings is a major growth factor. Mergers and acquisitions (M&A) activity has been moderate, with xx M&A deals recorded between 2019 and 2024, primarily focused on expanding market reach and technological capabilities. Key factors influencing market concentration include:
- Technological advancements: Continuous improvements in fiber quality and processing techniques.
- Government regulations: Increasing emphasis on sustainable and high-performance building materials.
- Economic growth: Rapid infrastructure development across several APAC nations.
- Competitive intensity: Presence of both established multinational players and ambitious regional companies.
APAC Carbon Fiber Building Materials Industry Industry Trends & Analysis
The APAC carbon fiber building materials industry is experiencing robust growth, driven by several factors. The market is projected to witness a Compound Annual Growth Rate (CAGR) of xx% during the forecast period (2025-2033). This growth is fueled by several trends:
- Rising infrastructure spending: Governments across the APAC region are investing heavily in infrastructure projects, boosting demand for high-performance building materials like carbon fiber.
- Growing adoption of lightweight construction: The increasing focus on energy efficiency is driving the demand for lightweight and durable materials.
- Technological advancements: Ongoing research and development in carbon fiber production and composite materials are leading to improvements in performance and cost-effectiveness.
- Expanding application areas: Carbon fiber is finding wider applications in diverse sectors, beyond traditional construction, such as renewable energy and automotive.
- Increased consumer awareness: Growing consumer awareness of sustainable and high-quality building materials is also stimulating market growth.
Market penetration of carbon fiber in the building materials sector remains relatively low compared to traditional materials; however, the rate of penetration is accelerating, with projections suggesting a significant increase by 2033.

Leading Markets & Segments in APAC Carbon Fiber Building Materials Industry
China dominates the APAC carbon fiber building materials market, driven by substantial infrastructure investments and a burgeoning manufacturing sector. Other key markets include Japan, South Korea, and India.
Dominant Segments:
- Raw Material: Polyacrylonitrile (PAN) accounts for the largest share of the raw material market due to its superior properties and cost-effectiveness.
- Fiber Type: Virgin Carbon Fiber (VCF) holds a larger market share than Recycled Carbon Fiber (RCF) owing to higher performance characteristics.
- Application: Composite materials dominate the application segment, driven by its versatility and high strength.
- End-user Industry: The construction and infrastructure sector is the leading end-user, followed by the automotive and aerospace sectors.
Key Drivers for Dominant Regions/Segments:
- China: Massive infrastructure projects, government support for advanced materials, and a large manufacturing base.
- Japan & South Korea: Strong technological capabilities, advanced manufacturing processes, and a focus on high-performance materials.
- India: Rapid economic growth, rising construction activity, and a growing middle class.
The dominance of these regions and segments is primarily due to robust economic growth, supportive government policies, and the presence of established manufacturers and robust supply chains.
APAP Carbon Fiber Building Materials Industry Product Developments
Recent product innovations focus on enhancing the strength, durability, and cost-effectiveness of carbon fiber materials. New manufacturing processes are reducing production costs, making carbon fiber more competitive with traditional building materials. The development of high-performance composites tailored for specific applications in construction (e.g., earthquake-resistant structures) is a prominent trend. These innovations improve the market fit of carbon fiber by addressing specific challenges in construction and increasing its overall competitiveness.
Key Drivers of APAC Carbon Fiber Building Materials Industry Growth
Several key factors are driving the growth of the APAC carbon fiber building materials industry:
- Technological advancements: Continuous improvements in carbon fiber production and composite material technology are resulting in higher performance and lower costs.
- Economic growth: Rapid economic expansion in many APAC countries is fueling infrastructure development and investment in construction projects.
- Government support: Numerous governments are actively promoting the use of sustainable and high-performance building materials through policies and subsidies.
Challenges in the APAC Carbon Fiber Building Materials Industry Market
Despite significant growth potential, the APAC carbon fiber building materials industry faces several challenges:
- High production costs: The relatively high cost of carbon fiber compared to traditional materials limits its widespread adoption. This results in a xx Million USD impact on market growth in 2024.
- Supply chain complexities: Establishing reliable and efficient supply chains for raw materials and finished products can be challenging, especially in geographically diverse markets.
- Competition from substitutes: Alternative materials, such as fiberglass and other advanced composites, compete with carbon fiber. This competition is estimated to reduce market growth by xx Million USD in 2024.
Emerging Opportunities in APAC Carbon Fiber Building Materials Industry
Several emerging opportunities are poised to drive long-term growth in the APAC carbon fiber building materials market. These include:
- Technological breakthroughs: Advancements in materials science and manufacturing technologies will continue to reduce costs and improve the performance of carbon fiber materials.
- Strategic partnerships: Collaborations between carbon fiber producers, composite material manufacturers, and construction companies will accelerate market penetration.
- Market expansion: Further expansion into new application areas, such as renewable energy infrastructure and advanced transportation systems, will create additional growth opportunities.
Leading Players in the APAC Carbon Fiber Building Materials Industry Sector
- SGL Carbon
- Solvay
- Anshan Sinocarb Carbon Fibers Co Ltd
- HYOSUNG ADVANCED MATERIALS
- Nippon Graphite Fiber Co Ltd
- TORAY INDUSTRIES INC
- Mitsubishi Chemical Carbon Fiber and Composites Inc
- Hexcel Corporation
- Formosa Plastics Corporation
- TEIJIN LIMITED
- Zhongfu Shenying Carbon Fiber Co Ltd
- *List Not Exhaustive
Key Milestones in APAC Carbon Fiber Building Materials Industry Industry
- April 2021: Hyosung Advanced Materials signs a USD 144 Million contract with Hanwha Solutions to supply carbon fiber for hydrogen vehicle fuel tanks. This highlights the growing application of carbon fiber in the alternative energy sector.
Strategic Outlook for APAC Carbon Fiber Building Materials Industry Market
The APAC carbon fiber building materials market presents significant growth potential. Continued investment in infrastructure, technological advancements, and supportive government policies will drive market expansion. Strategic partnerships and the exploration of new applications will further enhance market growth, leading to substantial revenue generation throughout the forecast period. The long-term outlook is highly positive, with carbon fiber poised to play an increasingly important role in the construction and infrastructure sectors across the region.
APAC Carbon Fiber Building Materials Industry Segmentation
-
1. Raw Material
- 1.1. Polyacrtlonitrile (PAN)
- 1.2. Petroleum Pitch and Rayon
-
2. Type
- 2.1. Virgin Fiber (VCF)
- 2.2. Recycled Fiber (RCF)
-
3. Application
- 3.1. Composite Materials
- 3.2. Textiles
- 3.3. Microelectrodes
- 3.4. Catalysis
-
4. End-user Industry
- 4.1. Aerospace and Defense
- 4.2. Alternative Energy
- 4.3. Automotive
- 4.4. Construction and Infrastructure
- 4.5. Sporting Goods
- 4.6. Other En
-
5. Geography
- 5.1. China
- 5.2. India
- 5.3. Japan
- 5.4. South Korea
- 5.5. ASEAN Countries
- 5.6. Rest of Asia-Pacific
APAC Carbon Fiber Building Materials Industry Segmentation By Geography
- 1. China
- 2. India
- 3. Japan
- 4. South Korea
- 5. ASEAN Countries
- 6. Rest of Asia Pacific
APAC Carbon Fiber Building Materials Industry REPORT HIGHLIGHTS
| Aspects | Details |
|---|---|
| Study Period | 2019-2033 |
| Base Year | 2024 |
| Estimated Year | 2025 |
| Forecast Period | 2025-2033 |
| Historical Period | 2019-2024 |
| Growth Rate | CAGR of > 13.00% from 2019-2033 |
| Segmentation |
|
Table of Contents
- 1. Introduction
- 1.1. Research Scope
- 1.2. Market Segmentation
- 1.3. Research Methodology
- 1.4. Definitions and Assumptions
- 2. Executive Summary
- 2.1. Introduction
- 3. Market Dynamics
- 3.1. Introduction
- 3.2. Market Drivers
- 3.2.1. Increasing Demand for Fuel-efficient and Lightweight Vehicles
- 3.3. Market Restrains
- 3.3.1. Concerns Related to Raw Materials
- 3.4. Market Trends
- 3.4.1. Aerospace and Defense Segment to Dominate the Market
- 4. Market Factor Analysis
- 4.1. Porters Five Forces
- 4.2. Supply/Value Chain
- 4.3. PESTEL analysis
- 4.4. Market Entropy
- 4.5. Patent/Trademark Analysis
- 5. Global APAC Carbon Fiber Building Materials Industry Analysis, Insights and Forecast, 2019-2031
- 5.1. Market Analysis, Insights and Forecast - by Raw Material
- 5.1.1. Polyacrtlonitrile (PAN)
- 5.1.2. Petroleum Pitch and Rayon
- 5.2. Market Analysis, Insights and Forecast - by Type
- 5.2.1. Virgin Fiber (VCF)
- 5.2.2. Recycled Fiber (RCF)
- 5.3. Market Analysis, Insights and Forecast - by Application
- 5.3.1. Composite Materials
- 5.3.2. Textiles
- 5.3.3. Microelectrodes
- 5.3.4. Catalysis
- 5.4. Market Analysis, Insights and Forecast - by End-user Industry
- 5.4.1. Aerospace and Defense
- 5.4.2. Alternative Energy
- 5.4.3. Automotive
- 5.4.4. Construction and Infrastructure
- 5.4.5. Sporting Goods
- 5.4.6. Other En
- 5.5. Market Analysis, Insights and Forecast - by Geography
- 5.5.1. China
- 5.5.2. India
- 5.5.3. Japan
- 5.5.4. South Korea
- 5.5.5. ASEAN Countries
- 5.5.6. Rest of Asia-Pacific
- 5.6. Market Analysis, Insights and Forecast - by Region
- 5.6.1. China
- 5.6.2. India
- 5.6.3. Japan
- 5.6.4. South Korea
- 5.6.5. ASEAN Countries
- 5.6.6. Rest of Asia Pacific
- 5.1. Market Analysis, Insights and Forecast - by Raw Material
- 6. China APAC Carbon Fiber Building Materials Industry Analysis, Insights and Forecast, 2019-2031
- 6.1. Market Analysis, Insights and Forecast - by Raw Material
- 6.1.1. Polyacrtlonitrile (PAN)
- 6.1.2. Petroleum Pitch and Rayon
- 6.2. Market Analysis, Insights and Forecast - by Type
- 6.2.1. Virgin Fiber (VCF)
- 6.2.2. Recycled Fiber (RCF)
- 6.3. Market Analysis, Insights and Forecast - by Application
- 6.3.1. Composite Materials
- 6.3.2. Textiles
- 6.3.3. Microelectrodes
- 6.3.4. Catalysis
- 6.4. Market Analysis, Insights and Forecast - by End-user Industry
- 6.4.1. Aerospace and Defense
- 6.4.2. Alternative Energy
- 6.4.3. Automotive
- 6.4.4. Construction and Infrastructure
- 6.4.5. Sporting Goods
- 6.4.6. Other En
- 6.5. Market Analysis, Insights and Forecast - by Geography
- 6.5.1. China
- 6.5.2. India
- 6.5.3. Japan
- 6.5.4. South Korea
- 6.5.5. ASEAN Countries
- 6.5.6. Rest of Asia-Pacific
- 6.1. Market Analysis, Insights and Forecast - by Raw Material
- 7. India APAC Carbon Fiber Building Materials Industry Analysis, Insights and Forecast, 2019-2031
- 7.1. Market Analysis, Insights and Forecast - by Raw Material
- 7.1.1. Polyacrtlonitrile (PAN)
- 7.1.2. Petroleum Pitch and Rayon
- 7.2. Market Analysis, Insights and Forecast - by Type
- 7.2.1. Virgin Fiber (VCF)
- 7.2.2. Recycled Fiber (RCF)
- 7.3. Market Analysis, Insights and Forecast - by Application
- 7.3.1. Composite Materials
- 7.3.2. Textiles
- 7.3.3. Microelectrodes
- 7.3.4. Catalysis
- 7.4. Market Analysis, Insights and Forecast - by End-user Industry
- 7.4.1. Aerospace and Defense
- 7.4.2. Alternative Energy
- 7.4.3. Automotive
- 7.4.4. Construction and Infrastructure
- 7.4.5. Sporting Goods
- 7.4.6. Other En
- 7.5. Market Analysis, Insights and Forecast - by Geography
- 7.5.1. China
- 7.5.2. India
- 7.5.3. Japan
- 7.5.4. South Korea
- 7.5.5. ASEAN Countries
- 7.5.6. Rest of Asia-Pacific
- 7.1. Market Analysis, Insights and Forecast - by Raw Material
- 8. Japan APAC Carbon Fiber Building Materials Industry Analysis, Insights and Forecast, 2019-2031
- 8.1. Market Analysis, Insights and Forecast - by Raw Material
- 8.1.1. Polyacrtlonitrile (PAN)
- 8.1.2. Petroleum Pitch and Rayon
- 8.2. Market Analysis, Insights and Forecast - by Type
- 8.2.1. Virgin Fiber (VCF)
- 8.2.2. Recycled Fiber (RCF)
- 8.3. Market Analysis, Insights and Forecast - by Application
- 8.3.1. Composite Materials
- 8.3.2. Textiles
- 8.3.3. Microelectrodes
- 8.3.4. Catalysis
- 8.4. Market Analysis, Insights and Forecast - by End-user Industry
- 8.4.1. Aerospace and Defense
- 8.4.2. Alternative Energy
- 8.4.3. Automotive
- 8.4.4. Construction and Infrastructure
- 8.4.5. Sporting Goods
- 8.4.6. Other En
- 8.5. Market Analysis, Insights and Forecast - by Geography
- 8.5.1. China
- 8.5.2. India
- 8.5.3. Japan
- 8.5.4. South Korea
- 8.5.5. ASEAN Countries
- 8.5.6. Rest of Asia-Pacific
- 8.1. Market Analysis, Insights and Forecast - by Raw Material
- 9. South Korea APAC Carbon Fiber Building Materials Industry Analysis, Insights and Forecast, 2019-2031
- 9.1. Market Analysis, Insights and Forecast - by Raw Material
- 9.1.1. Polyacrtlonitrile (PAN)
- 9.1.2. Petroleum Pitch and Rayon
- 9.2. Market Analysis, Insights and Forecast - by Type
- 9.2.1. Virgin Fiber (VCF)
- 9.2.2. Recycled Fiber (RCF)
- 9.3. Market Analysis, Insights and Forecast - by Application
- 9.3.1. Composite Materials
- 9.3.2. Textiles
- 9.3.3. Microelectrodes
- 9.3.4. Catalysis
- 9.4. Market Analysis, Insights and Forecast - by End-user Industry
- 9.4.1. Aerospace and Defense
- 9.4.2. Alternative Energy
- 9.4.3. Automotive
- 9.4.4. Construction and Infrastructure
- 9.4.5. Sporting Goods
- 9.4.6. Other En
- 9.5. Market Analysis, Insights and Forecast - by Geography
- 9.5.1. China
- 9.5.2. India
- 9.5.3. Japan
- 9.5.4. South Korea
- 9.5.5. ASEAN Countries
- 9.5.6. Rest of Asia-Pacific
- 9.1. Market Analysis, Insights and Forecast - by Raw Material
- 10. ASEAN Countries APAC Carbon Fiber Building Materials Industry Analysis, Insights and Forecast, 2019-2031
- 10.1. Market Analysis, Insights and Forecast - by Raw Material
- 10.1.1. Polyacrtlonitrile (PAN)
- 10.1.2. Petroleum Pitch and Rayon
- 10.2. Market Analysis, Insights and Forecast - by Type
- 10.2.1. Virgin Fiber (VCF)
- 10.2.2. Recycled Fiber (RCF)
- 10.3. Market Analysis, Insights and Forecast - by Application
- 10.3.1. Composite Materials
- 10.3.2. Textiles
- 10.3.3. Microelectrodes
- 10.3.4. Catalysis
- 10.4. Market Analysis, Insights and Forecast - by End-user Industry
- 10.4.1. Aerospace and Defense
- 10.4.2. Alternative Energy
- 10.4.3. Automotive
- 10.4.4. Construction and Infrastructure
- 10.4.5. Sporting Goods
- 10.4.6. Other En
- 10.5. Market Analysis, Insights and Forecast - by Geography
- 10.5.1. China
- 10.5.2. India
- 10.5.3. Japan
- 10.5.4. South Korea
- 10.5.5. ASEAN Countries
- 10.5.6. Rest of Asia-Pacific
- 10.1. Market Analysis, Insights and Forecast - by Raw Material
- 11. Rest of Asia Pacific APAC Carbon Fiber Building Materials Industry Analysis, Insights and Forecast, 2019-2031
- 11.1. Market Analysis, Insights and Forecast - by Raw Material
- 11.1.1. Polyacrtlonitrile (PAN)
- 11.1.2. Petroleum Pitch and Rayon
- 11.2. Market Analysis, Insights and Forecast - by Type
- 11.2.1. Virgin Fiber (VCF)
- 11.2.2. Recycled Fiber (RCF)
- 11.3. Market Analysis, Insights and Forecast - by Application
- 11.3.1. Composite Materials
- 11.3.2. Textiles
- 11.3.3. Microelectrodes
- 11.3.4. Catalysis
- 11.4. Market Analysis, Insights and Forecast - by End-user Industry
- 11.4.1. Aerospace and Defense
- 11.4.2. Alternative Energy
- 11.4.3. Automotive
- 11.4.4. Construction and Infrastructure
- 11.4.5. Sporting Goods
- 11.4.6. Other En
- 11.5. Market Analysis, Insights and Forecast - by Geography
- 11.5.1. China
- 11.5.2. India
- 11.5.3. Japan
- 11.5.4. South Korea
- 11.5.5. ASEAN Countries
- 11.5.6. Rest of Asia-Pacific
- 11.1. Market Analysis, Insights and Forecast - by Raw Material
- 12. North America APAC Carbon Fiber Building Materials Industry Analysis, Insights and Forecast, 2019-2031
- 12.1. Market Analysis, Insights and Forecast - By Country/Sub-region
- 12.1.1 United States
- 12.1.2 Canada
- 12.1.3 Mexico
- 13. Europe APAC Carbon Fiber Building Materials Industry Analysis, Insights and Forecast, 2019-2031
- 13.1. Market Analysis, Insights and Forecast - By Country/Sub-region
- 13.1.1 Germany
- 13.1.2 United Kingdom
- 13.1.3 France
- 13.1.4 Spain
- 13.1.5 Italy
- 13.1.6 Spain
- 13.1.7 Belgium
- 13.1.8 Netherland
- 13.1.9 Nordics
- 13.1.10 Rest of Europe
- 14. Asia Pacific APAC Carbon Fiber Building Materials Industry Analysis, Insights and Forecast, 2019-2031
- 14.1. Market Analysis, Insights and Forecast - By Country/Sub-region
- 14.1.1 China
- 14.1.2 Japan
- 14.1.3 India
- 14.1.4 South Korea
- 14.1.5 Southeast Asia
- 14.1.6 Australia
- 14.1.7 Indonesia
- 14.1.8 Phillipes
- 14.1.9 Singapore
- 14.1.10 Thailandc
- 14.1.11 Rest of Asia Pacific
- 15. South America APAC Carbon Fiber Building Materials Industry Analysis, Insights and Forecast, 2019-2031
- 15.1. Market Analysis, Insights and Forecast - By Country/Sub-region
- 15.1.1 Brazil
- 15.1.2 Argentina
- 15.1.3 Peru
- 15.1.4 Chile
- 15.1.5 Colombia
- 15.1.6 Ecuador
- 15.1.7 Venezuela
- 15.1.8 Rest of South America
- 16. North America APAC Carbon Fiber Building Materials Industry Analysis, Insights and Forecast, 2019-2031
- 16.1. Market Analysis, Insights and Forecast - By Country/Sub-region
- 16.1.1 United States
- 16.1.2 Canada
- 16.1.3 Mexico
- 17. MEA APAC Carbon Fiber Building Materials Industry Analysis, Insights and Forecast, 2019-2031
- 17.1. Market Analysis, Insights and Forecast - By Country/Sub-region
- 17.1.1 United Arab Emirates
- 17.1.2 Saudi Arabia
- 17.1.3 South Africa
- 17.1.4 Rest of Middle East and Africa
- 18. Competitive Analysis
- 18.1. Global Market Share Analysis 2024
- 18.2. Company Profiles
- 18.2.1 SGL Carbon
- 18.2.1.1. Overview
- 18.2.1.2. Products
- 18.2.1.3. SWOT Analysis
- 18.2.1.4. Recent Developments
- 18.2.1.5. Financials (Based on Availability)
- 18.2.2 Solvay
- 18.2.2.1. Overview
- 18.2.2.2. Products
- 18.2.2.3. SWOT Analysis
- 18.2.2.4. Recent Developments
- 18.2.2.5. Financials (Based on Availability)
- 18.2.3 Anshan Sinocarb Carbon Fibers Co Ltd
- 18.2.3.1. Overview
- 18.2.3.2. Products
- 18.2.3.3. SWOT Analysis
- 18.2.3.4. Recent Developments
- 18.2.3.5. Financials (Based on Availability)
- 18.2.4 HYOSUNG ADVANCED MATERIALS
- 18.2.4.1. Overview
- 18.2.4.2. Products
- 18.2.4.3. SWOT Analysis
- 18.2.4.4. Recent Developments
- 18.2.4.5. Financials (Based on Availability)
- 18.2.5 Nippon Graphite Fiber Co Ltd
- 18.2.5.1. Overview
- 18.2.5.2. Products
- 18.2.5.3. SWOT Analysis
- 18.2.5.4. Recent Developments
- 18.2.5.5. Financials (Based on Availability)
- 18.2.6 TORAY INDUSTRIES INC
- 18.2.6.1. Overview
- 18.2.6.2. Products
- 18.2.6.3. SWOT Analysis
- 18.2.6.4. Recent Developments
- 18.2.6.5. Financials (Based on Availability)
- 18.2.7 Mitsubishi Chemical Carbon Fiber and Composites Inc
- 18.2.7.1. Overview
- 18.2.7.2. Products
- 18.2.7.3. SWOT Analysis
- 18.2.7.4. Recent Developments
- 18.2.7.5. Financials (Based on Availability)
- 18.2.8 Hexcel Corporation
- 18.2.8.1. Overview
- 18.2.8.2. Products
- 18.2.8.3. SWOT Analysis
- 18.2.8.4. Recent Developments
- 18.2.8.5. Financials (Based on Availability)
- 18.2.9 Formosa Plastics Corporation
- 18.2.9.1. Overview
- 18.2.9.2. Products
- 18.2.9.3. SWOT Analysis
- 18.2.9.4. Recent Developments
- 18.2.9.5. Financials (Based on Availability)
- 18.2.10 TEIJIN LIMITED
- 18.2.10.1. Overview
- 18.2.10.2. Products
- 18.2.10.3. SWOT Analysis
- 18.2.10.4. Recent Developments
- 18.2.10.5. Financials (Based on Availability)
- 18.2.11 Zhongfu Shenying Carbon Fiber Co Ltd*List Not Exhaustive
- 18.2.11.1. Overview
- 18.2.11.2. Products
- 18.2.11.3. SWOT Analysis
- 18.2.11.4. Recent Developments
- 18.2.11.5. Financials (Based on Availability)
- 18.2.1 SGL Carbon
List of Figures
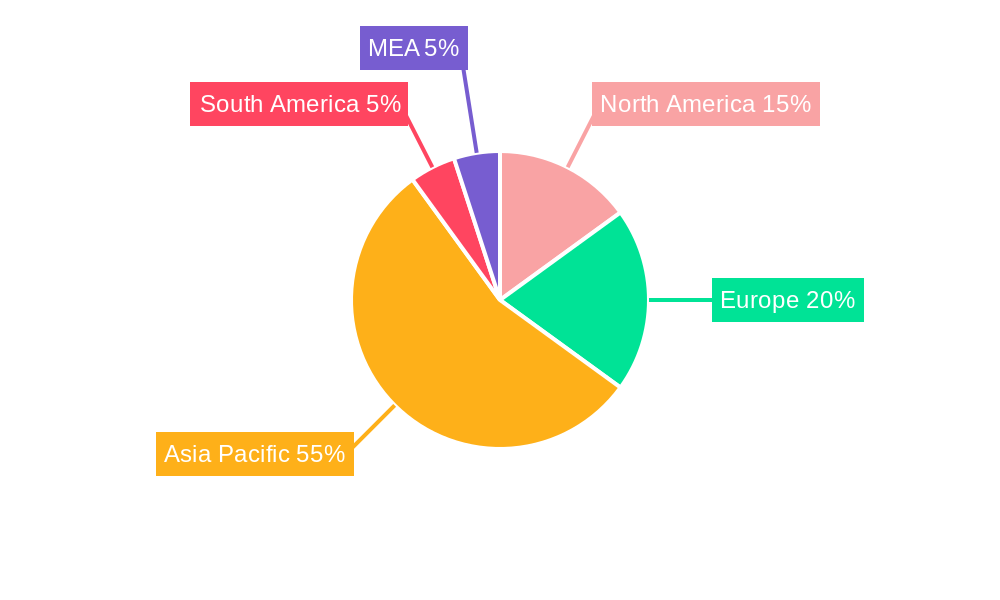
- Figure 1: Global APAC Carbon Fiber Building Materials Industry Revenue Breakdown (Million, %) by Region 2024 & 2032
- Figure 2: North America APAC Carbon Fiber Building Materials Industry Revenue (Million), by Country 2024 & 2032
- Figure 3: North America APAC Carbon Fiber Building Materials Industry Revenue Share (%), by Country 2024 & 2032
- Figure 4: Europe APAC Carbon Fiber Building Materials Industry Revenue (Million), by Country 2024 & 2032
- Figure 5: Europe APAC Carbon Fiber Building Materials Industry Revenue Share (%), by Country 2024 & 2032
- Figure 6: Asia Pacific APAC Carbon Fiber Building Materials Industry Revenue (Million), by Country 2024 & 2032
- Figure 7: Asia Pacific APAC Carbon Fiber Building Materials Industry Revenue Share (%), by Country 2024 & 2032
- Figure 8: South America APAC Carbon Fiber Building Materials Industry Revenue (Million), by Country 2024 & 2032
- Figure 9: South America APAC Carbon Fiber Building Materials Industry Revenue Share (%), by Country 2024 & 2032
- Figure 10: North America APAC Carbon Fiber Building Materials Industry Revenue (Million), by Country 2024 & 2032
- Figure 11: North America APAC Carbon Fiber Building Materials Industry Revenue Share (%), by Country 2024 & 2032
- Figure 12: MEA APAC Carbon Fiber Building Materials Industry Revenue (Million), by Country 2024 & 2032
- Figure 13: MEA APAC Carbon Fiber Building Materials Industry Revenue Share (%), by Country 2024 & 2032
- Figure 14: China APAC Carbon Fiber Building Materials Industry Revenue (Million), by Raw Material 2024 & 2032
- Figure 15: China APAC Carbon Fiber Building Materials Industry Revenue Share (%), by Raw Material 2024 & 2032
- Figure 16: China APAC Carbon Fiber Building Materials Industry Revenue (Million), by Type 2024 & 2032
- Figure 17: China APAC Carbon Fiber Building Materials Industry Revenue Share (%), by Type 2024 & 2032
- Figure 18: China APAC Carbon Fiber Building Materials Industry Revenue (Million), by Application 2024 & 2032
- Figure 19: China APAC Carbon Fiber Building Materials Industry Revenue Share (%), by Application 2024 & 2032
- Figure 20: China APAC Carbon Fiber Building Materials Industry Revenue (Million), by End-user Industry 2024 & 2032
- Figure 21: China APAC Carbon Fiber Building Materials Industry Revenue Share (%), by End-user Industry 2024 & 2032
- Figure 22: China APAC Carbon Fiber Building Materials Industry Revenue (Million), by Geography 2024 & 2032
- Figure 23: China APAC Carbon Fiber Building Materials Industry Revenue Share (%), by Geography 2024 & 2032
- Figure 24: China APAC Carbon Fiber Building Materials Industry Revenue (Million), by Country 2024 & 2032
- Figure 25: China APAC Carbon Fiber Building Materials Industry Revenue Share (%), by Country 2024 & 2032
- Figure 26: India APAC Carbon Fiber Building Materials Industry Revenue (Million), by Raw Material 2024 & 2032
- Figure 27: India APAC Carbon Fiber Building Materials Industry Revenue Share (%), by Raw Material 2024 & 2032
- Figure 28: India APAC Carbon Fiber Building Materials Industry Revenue (Million), by Type 2024 & 2032
- Figure 29: India APAC Carbon Fiber Building Materials Industry Revenue Share (%), by Type 2024 & 2032
- Figure 30: India APAC Carbon Fiber Building Materials Industry Revenue (Million), by Application 2024 & 2032
- Figure 31: India APAC Carbon Fiber Building Materials Industry Revenue Share (%), by Application 2024 & 2032
- Figure 32: India APAC Carbon Fiber Building Materials Industry Revenue (Million), by End-user Industry 2024 & 2032
- Figure 33: India APAC Carbon Fiber Building Materials Industry Revenue Share (%), by End-user Industry 2024 & 2032
- Figure 34: India APAC Carbon Fiber Building Materials Industry Revenue (Million), by Geography 2024 & 2032
- Figure 35: India APAC Carbon Fiber Building Materials Industry Revenue Share (%), by Geography 2024 & 2032
- Figure 36: India APAC Carbon Fiber Building Materials Industry Revenue (Million), by Country 2024 & 2032
- Figure 37: India APAC Carbon Fiber Building Materials Industry Revenue Share (%), by Country 2024 & 2032
- Figure 38: Japan APAC Carbon Fiber Building Materials Industry Revenue (Million), by Raw Material 2024 & 2032
- Figure 39: Japan APAC Carbon Fiber Building Materials Industry Revenue Share (%), by Raw Material 2024 & 2032
- Figure 40: Japan APAC Carbon Fiber Building Materials Industry Revenue (Million), by Type 2024 & 2032
- Figure 41: Japan APAC Carbon Fiber Building Materials Industry Revenue Share (%), by Type 2024 & 2032
- Figure 42: Japan APAC Carbon Fiber Building Materials Industry Revenue (Million), by Application 2024 & 2032
- Figure 43: Japan APAC Carbon Fiber Building Materials Industry Revenue Share (%), by Application 2024 & 2032
- Figure 44: Japan APAC Carbon Fiber Building Materials Industry Revenue (Million), by End-user Industry 2024 & 2032
- Figure 45: Japan APAC Carbon Fiber Building Materials Industry Revenue Share (%), by End-user Industry 2024 & 2032
- Figure 46: Japan APAC Carbon Fiber Building Materials Industry Revenue (Million), by Geography 2024 & 2032
- Figure 47: Japan APAC Carbon Fiber Building Materials Industry Revenue Share (%), by Geography 2024 & 2032
- Figure 48: Japan APAC Carbon Fiber Building Materials Industry Revenue (Million), by Country 2024 & 2032
- Figure 49: Japan APAC Carbon Fiber Building Materials Industry Revenue Share (%), by Country 2024 & 2032
- Figure 50: South Korea APAC Carbon Fiber Building Materials Industry Revenue (Million), by Raw Material 2024 & 2032
- Figure 51: South Korea APAC Carbon Fiber Building Materials Industry Revenue Share (%), by Raw Material 2024 & 2032
- Figure 52: South Korea APAC Carbon Fiber Building Materials Industry Revenue (Million), by Type 2024 & 2032
- Figure 53: South Korea APAC Carbon Fiber Building Materials Industry Revenue Share (%), by Type 2024 & 2032
- Figure 54: South Korea APAC Carbon Fiber Building Materials Industry Revenue (Million), by Application 2024 & 2032
- Figure 55: South Korea APAC Carbon Fiber Building Materials Industry Revenue Share (%), by Application 2024 & 2032
- Figure 56: South Korea APAC Carbon Fiber Building Materials Industry Revenue (Million), by End-user Industry 2024 & 2032
- Figure 57: South Korea APAC Carbon Fiber Building Materials Industry Revenue Share (%), by End-user Industry 2024 & 2032
- Figure 58: South Korea APAC Carbon Fiber Building Materials Industry Revenue (Million), by Geography 2024 & 2032
- Figure 59: South Korea APAC Carbon Fiber Building Materials Industry Revenue Share (%), by Geography 2024 & 2032
- Figure 60: South Korea APAC Carbon Fiber Building Materials Industry Revenue (Million), by Country 2024 & 2032
- Figure 61: South Korea APAC Carbon Fiber Building Materials Industry Revenue Share (%), by Country 2024 & 2032
- Figure 62: ASEAN Countries APAC Carbon Fiber Building Materials Industry Revenue (Million), by Raw Material 2024 & 2032
- Figure 63: ASEAN Countries APAC Carbon Fiber Building Materials Industry Revenue Share (%), by Raw Material 2024 & 2032
- Figure 64: ASEAN Countries APAC Carbon Fiber Building Materials Industry Revenue (Million), by Type 2024 & 2032
- Figure 65: ASEAN Countries APAC Carbon Fiber Building Materials Industry Revenue Share (%), by Type 2024 & 2032
- Figure 66: ASEAN Countries APAC Carbon Fiber Building Materials Industry Revenue (Million), by Application 2024 & 2032
- Figure 67: ASEAN Countries APAC Carbon Fiber Building Materials Industry Revenue Share (%), by Application 2024 & 2032
- Figure 68: ASEAN Countries APAC Carbon Fiber Building Materials Industry Revenue (Million), by End-user Industry 2024 & 2032
- Figure 69: ASEAN Countries APAC Carbon Fiber Building Materials Industry Revenue Share (%), by End-user Industry 2024 & 2032
- Figure 70: ASEAN Countries APAC Carbon Fiber Building Materials Industry Revenue (Million), by Geography 2024 & 2032
- Figure 71: ASEAN Countries APAC Carbon Fiber Building Materials Industry Revenue Share (%), by Geography 2024 & 2032
- Figure 72: ASEAN Countries APAC Carbon Fiber Building Materials Industry Revenue (Million), by Country 2024 & 2032
- Figure 73: ASEAN Countries APAC Carbon Fiber Building Materials Industry Revenue Share (%), by Country 2024 & 2032
- Figure 74: Rest of Asia Pacific APAC Carbon Fiber Building Materials Industry Revenue (Million), by Raw Material 2024 & 2032
- Figure 75: Rest of Asia Pacific APAC Carbon Fiber Building Materials Industry Revenue Share (%), by Raw Material 2024 & 2032
- Figure 76: Rest of Asia Pacific APAC Carbon Fiber Building Materials Industry Revenue (Million), by Type 2024 & 2032
- Figure 77: Rest of Asia Pacific APAC Carbon Fiber Building Materials Industry Revenue Share (%), by Type 2024 & 2032
- Figure 78: Rest of Asia Pacific APAC Carbon Fiber Building Materials Industry Revenue (Million), by Application 2024 & 2032
- Figure 79: Rest of Asia Pacific APAC Carbon Fiber Building Materials Industry Revenue Share (%), by Application 2024 & 2032
- Figure 80: Rest of Asia Pacific APAC Carbon Fiber Building Materials Industry Revenue (Million), by End-user Industry 2024 & 2032
- Figure 81: Rest of Asia Pacific APAC Carbon Fiber Building Materials Industry Revenue Share (%), by End-user Industry 2024 & 2032
- Figure 82: Rest of Asia Pacific APAC Carbon Fiber Building Materials Industry Revenue (Million), by Geography 2024 & 2032
- Figure 83: Rest of Asia Pacific APAC Carbon Fiber Building Materials Industry Revenue Share (%), by Geography 2024 & 2032
- Figure 84: Rest of Asia Pacific APAC Carbon Fiber Building Materials Industry Revenue (Million), by Country 2024 & 2032
- Figure 85: Rest of Asia Pacific APAC Carbon Fiber Building Materials Industry Revenue Share (%), by Country 2024 & 2032
List of Tables
- Table 1: Global APAC Carbon Fiber Building Materials Industry Revenue Million Forecast, by Region 2019 & 2032
- Table 2: Global APAC Carbon Fiber Building Materials Industry Revenue Million Forecast, by Raw Material 2019 & 2032
- Table 3: Global APAC Carbon Fiber Building Materials Industry Revenue Million Forecast, by Type 2019 & 2032
- Table 4: Global APAC Carbon Fiber Building Materials Industry Revenue Million Forecast, by Application 2019 & 2032
- Table 5: Global APAC Carbon Fiber Building Materials Industry Revenue Million Forecast, by End-user Industry 2019 & 2032
- Table 6: Global APAC Carbon Fiber Building Materials Industry Revenue Million Forecast, by Geography 2019 & 2032
- Table 7: Global APAC Carbon Fiber Building Materials Industry Revenue Million Forecast, by Region 2019 & 2032
- Table 8: Global APAC Carbon Fiber Building Materials Industry Revenue Million Forecast, by Country 2019 & 2032
- Table 9: United States APAC Carbon Fiber Building Materials Industry Revenue (Million) Forecast, by Application 2019 & 2032
- Table 10: Canada APAC Carbon Fiber Building Materials Industry Revenue (Million) Forecast, by Application 2019 & 2032
- Table 11: Mexico APAC Carbon Fiber Building Materials Industry Revenue (Million) Forecast, by Application 2019 & 2032
- Table 12: Global APAC Carbon Fiber Building Materials Industry Revenue Million Forecast, by Country 2019 & 2032
- Table 13: Germany APAC Carbon Fiber Building Materials Industry Revenue (Million) Forecast, by Application 2019 & 2032
- Table 14: United Kingdom APAC Carbon Fiber Building Materials Industry Revenue (Million) Forecast, by Application 2019 & 2032
- Table 15: France APAC Carbon Fiber Building Materials Industry Revenue (Million) Forecast, by Application 2019 & 2032
- Table 16: Spain APAC Carbon Fiber Building Materials Industry Revenue (Million) Forecast, by Application 2019 & 2032
- Table 17: Italy APAC Carbon Fiber Building Materials Industry Revenue (Million) Forecast, by Application 2019 & 2032
- Table 18: Spain APAC Carbon Fiber Building Materials Industry Revenue (Million) Forecast, by Application 2019 & 2032
- Table 19: Belgium APAC Carbon Fiber Building Materials Industry Revenue (Million) Forecast, by Application 2019 & 2032
- Table 20: Netherland APAC Carbon Fiber Building Materials Industry Revenue (Million) Forecast, by Application 2019 & 2032
- Table 21: Nordics APAC Carbon Fiber Building Materials Industry Revenue (Million) Forecast, by Application 2019 & 2032
- Table 22: Rest of Europe APAC Carbon Fiber Building Materials Industry Revenue (Million) Forecast, by Application 2019 & 2032
- Table 23: Global APAC Carbon Fiber Building Materials Industry Revenue Million Forecast, by Country 2019 & 2032
- Table 24: China APAC Carbon Fiber Building Materials Industry Revenue (Million) Forecast, by Application 2019 & 2032
- Table 25: Japan APAC Carbon Fiber Building Materials Industry Revenue (Million) Forecast, by Application 2019 & 2032
- Table 26: India APAC Carbon Fiber Building Materials Industry Revenue (Million) Forecast, by Application 2019 & 2032
- Table 27: South Korea APAC Carbon Fiber Building Materials Industry Revenue (Million) Forecast, by Application 2019 & 2032
- Table 28: Southeast Asia APAC Carbon Fiber Building Materials Industry Revenue (Million) Forecast, by Application 2019 & 2032
- Table 29: Australia APAC Carbon Fiber Building Materials Industry Revenue (Million) Forecast, by Application 2019 & 2032
- Table 30: Indonesia APAC Carbon Fiber Building Materials Industry Revenue (Million) Forecast, by Application 2019 & 2032
- Table 31: Phillipes APAC Carbon Fiber Building Materials Industry Revenue (Million) Forecast, by Application 2019 & 2032
- Table 32: Singapore APAC Carbon Fiber Building Materials Industry Revenue (Million) Forecast, by Application 2019 & 2032
- Table 33: Thailandc APAC Carbon Fiber Building Materials Industry Revenue (Million) Forecast, by Application 2019 & 2032
- Table 34: Rest of Asia Pacific APAC Carbon Fiber Building Materials Industry Revenue (Million) Forecast, by Application 2019 & 2032
- Table 35: Global APAC Carbon Fiber Building Materials Industry Revenue Million Forecast, by Country 2019 & 2032
- Table 36: Brazil APAC Carbon Fiber Building Materials Industry Revenue (Million) Forecast, by Application 2019 & 2032
- Table 37: Argentina APAC Carbon Fiber Building Materials Industry Revenue (Million) Forecast, by Application 2019 & 2032
- Table 38: Peru APAC Carbon Fiber Building Materials Industry Revenue (Million) Forecast, by Application 2019 & 2032
- Table 39: Chile APAC Carbon Fiber Building Materials Industry Revenue (Million) Forecast, by Application 2019 & 2032
- Table 40: Colombia APAC Carbon Fiber Building Materials Industry Revenue (Million) Forecast, by Application 2019 & 2032
- Table 41: Ecuador APAC Carbon Fiber Building Materials Industry Revenue (Million) Forecast, by Application 2019 & 2032
- Table 42: Venezuela APAC Carbon Fiber Building Materials Industry Revenue (Million) Forecast, by Application 2019 & 2032
- Table 43: Rest of South America APAC Carbon Fiber Building Materials Industry Revenue (Million) Forecast, by Application 2019 & 2032
- Table 44: Global APAC Carbon Fiber Building Materials Industry Revenue Million Forecast, by Country 2019 & 2032
- Table 45: United States APAC Carbon Fiber Building Materials Industry Revenue (Million) Forecast, by Application 2019 & 2032
- Table 46: Canada APAC Carbon Fiber Building Materials Industry Revenue (Million) Forecast, by Application 2019 & 2032
- Table 47: Mexico APAC Carbon Fiber Building Materials Industry Revenue (Million) Forecast, by Application 2019 & 2032
- Table 48: Global APAC Carbon Fiber Building Materials Industry Revenue Million Forecast, by Country 2019 & 2032
- Table 49: United Arab Emirates APAC Carbon Fiber Building Materials Industry Revenue (Million) Forecast, by Application 2019 & 2032
- Table 50: Saudi Arabia APAC Carbon Fiber Building Materials Industry Revenue (Million) Forecast, by Application 2019 & 2032
- Table 51: South Africa APAC Carbon Fiber Building Materials Industry Revenue (Million) Forecast, by Application 2019 & 2032
- Table 52: Rest of Middle East and Africa APAC Carbon Fiber Building Materials Industry Revenue (Million) Forecast, by Application 2019 & 2032
- Table 53: Global APAC Carbon Fiber Building Materials Industry Revenue Million Forecast, by Raw Material 2019 & 2032
- Table 54: Global APAC Carbon Fiber Building Materials Industry Revenue Million Forecast, by Type 2019 & 2032
- Table 55: Global APAC Carbon Fiber Building Materials Industry Revenue Million Forecast, by Application 2019 & 2032
- Table 56: Global APAC Carbon Fiber Building Materials Industry Revenue Million Forecast, by End-user Industry 2019 & 2032
- Table 57: Global APAC Carbon Fiber Building Materials Industry Revenue Million Forecast, by Geography 2019 & 2032
- Table 58: Global APAC Carbon Fiber Building Materials Industry Revenue Million Forecast, by Country 2019 & 2032
- Table 59: Global APAC Carbon Fiber Building Materials Industry Revenue Million Forecast, by Raw Material 2019 & 2032
- Table 60: Global APAC Carbon Fiber Building Materials Industry Revenue Million Forecast, by Type 2019 & 2032
- Table 61: Global APAC Carbon Fiber Building Materials Industry Revenue Million Forecast, by Application 2019 & 2032
- Table 62: Global APAC Carbon Fiber Building Materials Industry Revenue Million Forecast, by End-user Industry 2019 & 2032
- Table 63: Global APAC Carbon Fiber Building Materials Industry Revenue Million Forecast, by Geography 2019 & 2032
- Table 64: Global APAC Carbon Fiber Building Materials Industry Revenue Million Forecast, by Country 2019 & 2032
- Table 65: Global APAC Carbon Fiber Building Materials Industry Revenue Million Forecast, by Raw Material 2019 & 2032
- Table 66: Global APAC Carbon Fiber Building Materials Industry Revenue Million Forecast, by Type 2019 & 2032
- Table 67: Global APAC Carbon Fiber Building Materials Industry Revenue Million Forecast, by Application 2019 & 2032
- Table 68: Global APAC Carbon Fiber Building Materials Industry Revenue Million Forecast, by End-user Industry 2019 & 2032
- Table 69: Global APAC Carbon Fiber Building Materials Industry Revenue Million Forecast, by Geography 2019 & 2032
- Table 70: Global APAC Carbon Fiber Building Materials Industry Revenue Million Forecast, by Country 2019 & 2032
- Table 71: Global APAC Carbon Fiber Building Materials Industry Revenue Million Forecast, by Raw Material 2019 & 2032
- Table 72: Global APAC Carbon Fiber Building Materials Industry Revenue Million Forecast, by Type 2019 & 2032
- Table 73: Global APAC Carbon Fiber Building Materials Industry Revenue Million Forecast, by Application 2019 & 2032
- Table 74: Global APAC Carbon Fiber Building Materials Industry Revenue Million Forecast, by End-user Industry 2019 & 2032
- Table 75: Global APAC Carbon Fiber Building Materials Industry Revenue Million Forecast, by Geography 2019 & 2032
- Table 76: Global APAC Carbon Fiber Building Materials Industry Revenue Million Forecast, by Country 2019 & 2032
- Table 77: Global APAC Carbon Fiber Building Materials Industry Revenue Million Forecast, by Raw Material 2019 & 2032
- Table 78: Global APAC Carbon Fiber Building Materials Industry Revenue Million Forecast, by Type 2019 & 2032
- Table 79: Global APAC Carbon Fiber Building Materials Industry Revenue Million Forecast, by Application 2019 & 2032
- Table 80: Global APAC Carbon Fiber Building Materials Industry Revenue Million Forecast, by End-user Industry 2019 & 2032
- Table 81: Global APAC Carbon Fiber Building Materials Industry Revenue Million Forecast, by Geography 2019 & 2032
- Table 82: Global APAC Carbon Fiber Building Materials Industry Revenue Million Forecast, by Country 2019 & 2032
- Table 83: Global APAC Carbon Fiber Building Materials Industry Revenue Million Forecast, by Raw Material 2019 & 2032
- Table 84: Global APAC Carbon Fiber Building Materials Industry Revenue Million Forecast, by Type 2019 & 2032
- Table 85: Global APAC Carbon Fiber Building Materials Industry Revenue Million Forecast, by Application 2019 & 2032
- Table 86: Global APAC Carbon Fiber Building Materials Industry Revenue Million Forecast, by End-user Industry 2019 & 2032
- Table 87: Global APAC Carbon Fiber Building Materials Industry Revenue Million Forecast, by Geography 2019 & 2032
- Table 88: Global APAC Carbon Fiber Building Materials Industry Revenue Million Forecast, by Country 2019 & 2032
Frequently Asked Questions
1. What is the projected Compound Annual Growth Rate (CAGR) of the APAC Carbon Fiber Building Materials Industry?
The projected CAGR is approximately > 13.00%.
2. Which companies are prominent players in the APAC Carbon Fiber Building Materials Industry?
Key companies in the market include SGL Carbon, Solvay, Anshan Sinocarb Carbon Fibers Co Ltd, HYOSUNG ADVANCED MATERIALS, Nippon Graphite Fiber Co Ltd, TORAY INDUSTRIES INC, Mitsubishi Chemical Carbon Fiber and Composites Inc, Hexcel Corporation, Formosa Plastics Corporation, TEIJIN LIMITED, Zhongfu Shenying Carbon Fiber Co Ltd*List Not Exhaustive.
3. What are the main segments of the APAC Carbon Fiber Building Materials Industry?
The market segments include Raw Material, Type, Application, End-user Industry, Geography.
4. Can you provide details about the market size?
The market size is estimated to be USD XX Million as of 2022.
5. What are some drivers contributing to market growth?
Increasing Demand for Fuel-efficient and Lightweight Vehicles.
6. What are the notable trends driving market growth?
Aerospace and Defense Segment to Dominate the Market.
7. Are there any restraints impacting market growth?
Concerns Related to Raw Materials.
8. Can you provide examples of recent developments in the market?
In April 2021, Hyosung Advanced Materials announced that it had signed a long-term contract to supply Hanwha Solutions with high-strength carbon fiber to be used to reinforce fuel tanks for hydrogen vehicles for six years from 2021. The supply is worth about 160 billion won (USD 144 million).
9. What pricing options are available for accessing the report?
Pricing options include single-user, multi-user, and enterprise licenses priced at USD 4750, USD 5250, and USD 8750 respectively.
10. Is the market size provided in terms of value or volume?
The market size is provided in terms of value, measured in Million.
11. Are there any specific market keywords associated with the report?
Yes, the market keyword associated with the report is "APAC Carbon Fiber Building Materials Industry," which aids in identifying and referencing the specific market segment covered.
12. How do I determine which pricing option suits my needs best?
The pricing options vary based on user requirements and access needs. Individual users may opt for single-user licenses, while businesses requiring broader access may choose multi-user or enterprise licenses for cost-effective access to the report.
13. Are there any additional resources or data provided in the APAC Carbon Fiber Building Materials Industry report?
While the report offers comprehensive insights, it's advisable to review the specific contents or supplementary materials provided to ascertain if additional resources or data are available.
14. How can I stay updated on further developments or reports in the APAC Carbon Fiber Building Materials Industry?
To stay informed about further developments, trends, and reports in the APAC Carbon Fiber Building Materials Industry, consider subscribing to industry newsletters, following relevant companies and organizations, or regularly checking reputable industry news sources and publications.
Methodology
Step 1 - Identification of Relevant Samples Size from Population Database


Step 2 - Approaches for Defining Global Market Size (Value, Volume* & Price*)

Note*: In applicable scenarios
Step 3 - Data Sources
Primary Research
- Web Analytics
- Survey Reports
- Research Institute
- Latest Research Reports
- Opinion Leaders
Secondary Research
- Annual Reports
- White Paper
- Latest Press Release
- Industry Association
- Paid Database
- Investor Presentations

Step 4 - Data Triangulation
Involves using different sources of information in order to increase the validity of a study
These sources are likely to be stakeholders in a program - participants, other researchers, program staff, other community members, and so on.
Then we put all data in single framework & apply various statistical tools to find out the dynamic on the market.
During the analysis stage, feedback from the stakeholder groups would be compared to determine areas of agreement as well as areas of divergence
