

Key Insights
The Asia-Pacific (APAC) cane sugar market exhibits robust growth, driven by increasing population, rising disposable incomes, and shifting dietary habits favoring sugar-sweetened beverages and processed foods. The region's diverse economies, ranging from rapidly developing nations like India and China to more established markets like Japan and South Korea, contribute to significant demand variations. India, with its large population and expanding food processing sector, is a major growth engine. China's substantial demand, particularly in the food and beverage industry, also fuels market expansion. However, fluctuating sugarcane yields due to climatic changes and government policies concerning sugar production and import/export tariffs pose challenges. Further growth is expected from the increasing demand for organic cane sugar, catering to health-conscious consumers. The market segmentation by form (crystallized sugar and liquid syrup) reflects consumer preferences and industrial applications. Crystallized sugar maintains a larger market share due to its widespread use in households and food processing. Liquid syrup, though smaller, is gaining traction in the beverage industry. Key players in the APAC region leverage their established supply chains and distribution networks to cater to this growing demand. Competition is intense, focusing on product differentiation, pricing strategies, and efficient supply chain management. Sustainable sourcing practices and environmentally friendly production methods are becoming increasingly crucial for companies aiming to attract ethically conscious consumers.
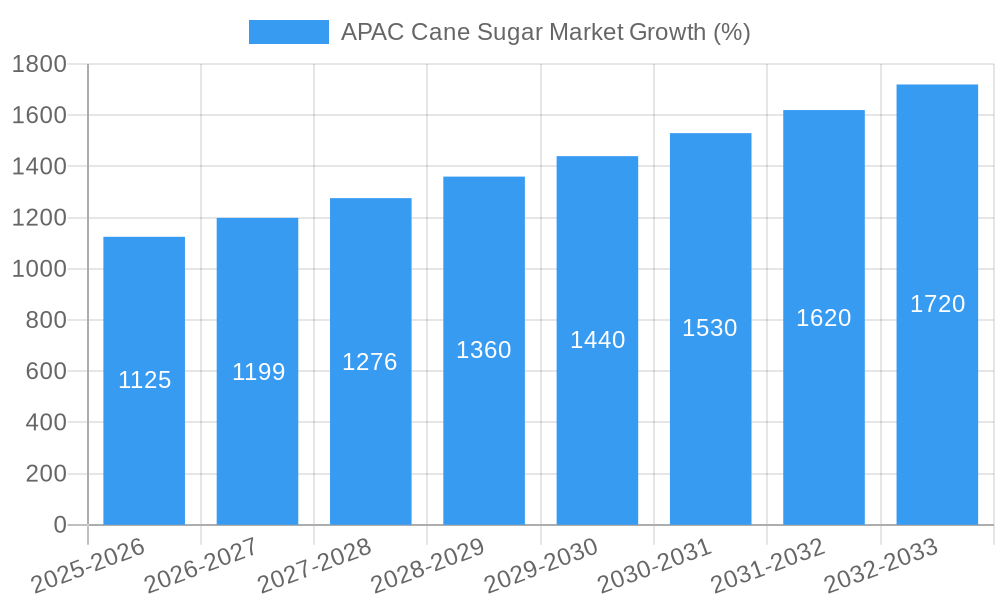
The forecast period of 2025-2033 anticipates continued growth at a rate slightly below the historical CAGR of 8.60%, estimated at approximately 7.5% due to anticipated market maturation and potential regulatory shifts. This moderated growth is not indicative of a decline but rather a natural progression as the market expands and reaches a larger, more established stage. The segment analysis reveals that the bakery and confectionery sector continues to be the largest consumer of cane sugar, followed by the beverage and dairy industries. Continued expansion in these sectors and the rising popularity of processed foods will likely drive future growth. However, potential health concerns related to high sugar consumption and the increasing popularity of sugar substitutes may exert some pressure on the market’s growth trajectory in the latter half of the forecast period. Understanding regional nuances within APAC, such as differences in consumer preferences and regulatory frameworks, will be crucial for players seeking a larger market share.
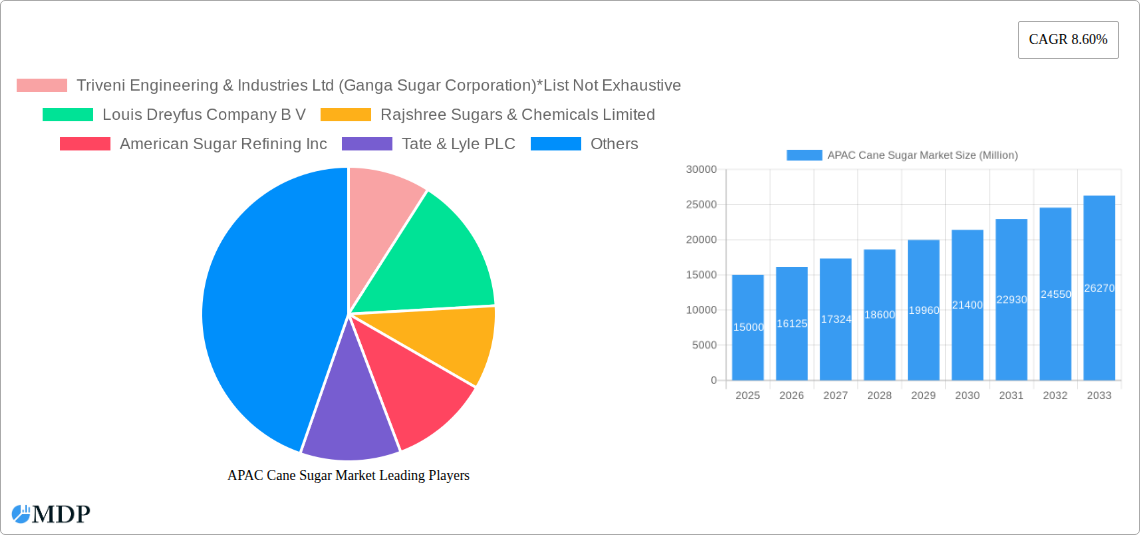
This in-depth report provides a comprehensive analysis of the Asia-Pacific cane sugar market, offering invaluable insights for industry stakeholders, investors, and strategic decision-makers. The study period covers 2019-2033, with 2025 as the base and estimated year. The report forecasts market trends from 2025-2033, building upon historical data from 2019-2024. Expect detailed segmentation by category (organic, conventional), form (crystallized sugar, liquid syrup), and application (bakery & confectionery, dairy, beverages, other). Leading players like Triveni Engineering & Industries Ltd (Ganga Sugar Corporation), Louis Dreyfus Company B V, and others are analyzed for their market positioning and strategic moves.
APAC Cane Sugar Market Market Dynamics & Concentration
The APAC cane sugar market exhibits a moderately concentrated structure, with a few major players holding significant market share. However, the presence of numerous smaller regional players contributes to a dynamic competitive landscape. Market share data for 2024 shows xx% held by the top 5 players, while the remaining xx% is distributed among smaller participants. Innovation in sugar production processes, particularly focusing on sustainability and efficiency, is a key driver. Stringent regulatory frameworks concerning food safety and environmental standards also shape market dynamics. Substitute sweeteners, such as high-fructose corn syrup and artificial sweeteners, present ongoing competitive pressure. Consumer trends favor healthier options, leading to increased demand for organic sugar and reduced-sugar products. The market has witnessed several M&A activities in recent years, with xx mergers and acquisitions recorded in the past 5 years, primarily aimed at expanding market reach and enhancing supply chain integration.
- Market Concentration: Moderately concentrated, with top 5 players holding xx% of market share in 2024.
- Innovation Drivers: Sustainability initiatives, process efficiency improvements.
- Regulatory Frameworks: Food safety and environmental regulations.
- Product Substitutes: High-fructose corn syrup, artificial sweeteners.
- End-User Trends: Growing demand for organic and reduced-sugar products.
- M&A Activity: xx M&A deals in the past 5 years.
APAC Cane Sugar Market Industry Trends & Analysis
The APAC cane sugar market is projected to experience a CAGR of xx% during the forecast period (2025-2033). Several factors contribute to this growth, including rising disposable incomes, population growth, and increasing urbanization across the region, driving demand for processed foods and beverages that utilize sugar. Technological advancements in sugar refining and production are enhancing efficiency and reducing costs. However, fluctuating sugarcane prices and climate change pose significant challenges. Consumer preference shifts towards healthier options, including organic and low-sugar products, are influencing product development and marketing strategies. Competitive dynamics are marked by price competition, product differentiation, and strategic partnerships. Market penetration of organic sugar is steadily increasing, reaching xx% in 2024 and expected to further grow to xx% by 2033.
Leading Markets & Segments in APAC Cane Sugar Market
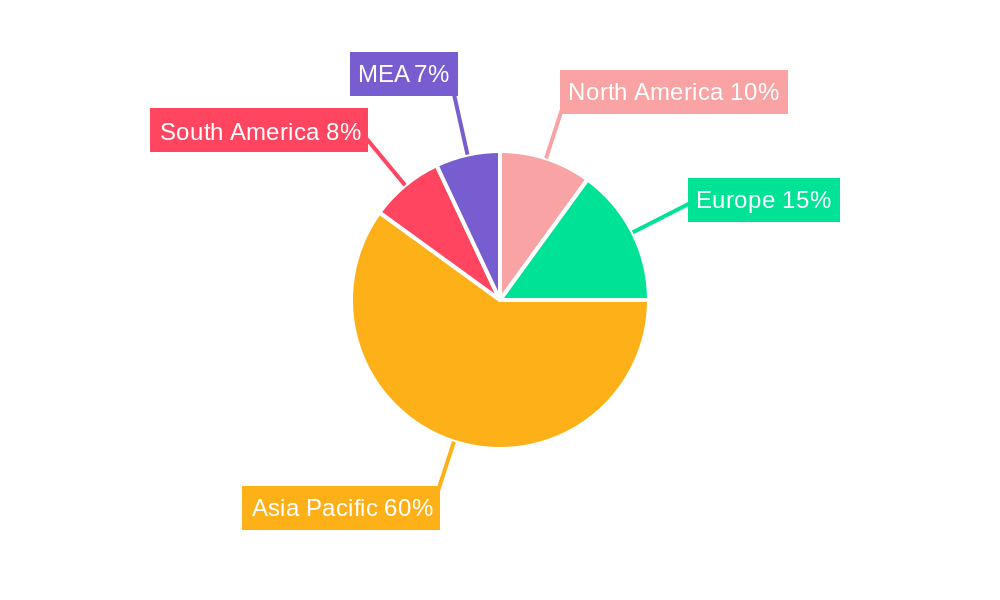
The largest segment within the APAC cane sugar market is the conventional crystallized sugar, followed by the conventional liquid syrup segment. This dominance is fueled by the widespread use of these products across various applications. Within the geographical landscape, India and China represent the most significant markets, contributing to xx% of the total market volume in 2024, due to factors like large populations, robust food processing industries, and significant sugarcane production capacity.
Key Drivers in India and China:
- Large and growing populations.
- Developed food processing industries.
- Extensive sugarcane cultivation.
- Government support for the agricultural sector.
Dominance Analysis: Conventional crystallized sugar dominates due to its affordability and widespread use, while India and China lead geographically due to the factors mentioned above. The organic segment's growth is driven by increasing health consciousness.
APAP Cane Sugar Market Product Developments
Recent product developments focus on improving sugar quality, enhancing sustainability, and creating value-added products. Innovations include the development of new cane varieties with higher sugar content and improved yield, alongside advancements in sugar refining technologies for enhanced purity and efficiency. The industry is also responding to consumer demand for healthier options by introducing organic and low-sugar products and exploring novel applications in functional foods.
Key Drivers of APAC Cane Sugar Market Growth
The growth of the APAC cane sugar market is driven by a multitude of factors. Rising disposable incomes and a growing population fuel increased demand for sugar-containing foods and beverages. Government support for the agricultural sector, particularly in major sugarcane-producing countries, stimulates production. Technological advancements are streamlining production processes and improving efficiency. Furthermore, the expanding food processing industry in the APAC region increases the overall demand for sugar.
Challenges in the APAC Cane Sugar Market Market
The APAC cane sugar market faces several challenges. Fluctuations in sugarcane prices significantly impact production costs and profitability. Climate change and unpredictable weather patterns pose a threat to sugarcane yields. Intense competition from substitute sweeteners, like high-fructose corn syrup, puts downward pressure on prices. Moreover, stringent environmental regulations and evolving consumer preferences for healthier options necessitate continuous adaptation within the industry. These factors together could result in a xx% reduction in profit margins by 2030 if not addressed proactively.
Emerging Opportunities in APAC Cane Sugar Market
The APAC cane sugar market presents substantial growth opportunities. The increasing demand for organic and functional sugars will drive innovation in product development. Strategic partnerships between sugar producers and food manufacturers can create synergies and access to new markets. Furthermore, expansion into newer APAC markets with growing consumption patterns will offer significant potential. The development of sustainable and eco-friendly sugarcane cultivation practices is poised to create additional market space for environmentally conscious consumers.
Leading Players in the APAC Cane Sugar Market Sector
- Triveni Engineering & Industries Ltd (Ganga Sugar Corporation)
- Louis Dreyfus Company B V
- Rajshree Sugars & Chemicals Limited
- American Sugar Refining Inc
- Tate & Lyle PLC
- Wilmar Sugar Australia Holdings Pty Ltd
- DCM Shriram Consolidated Limited
- Global Organics Ltd
- Rana Sugars Limited
- Nanning Sugar Industry Co Ltd
Key Milestones in APAC Cane Sugar Market Industry
- November 2021: DCM Shriram Ltd invested over USD 4.22 Million to expand sugar mill capacity, enhancing refined sugar production and feedstock flexibility. This reflects increasing consumer demand for refined sugar.
- November 2021: The Sugar Research Institute of Fiji released a new high-sugar-content cane variety, boosting yields and grower income, impacting overall sugar production positively.
- December 2021: MSM Malaysia Holdings Bhd and Wilmar Sugar Pty Ltd collaborated to build a sustainable sugar supply chain, focusing on traceability and sustainability performance. This highlights a growing emphasis on ethical and sustainable sourcing.
Strategic Outlook for APAC Cane Sugar Market Market
The APAC cane sugar market is poised for continued growth driven by population growth, rising disposable incomes, and increasing demand for processed foods and beverages. Strategic investments in sustainable practices, technological advancements, and product diversification will be crucial for success. Focus on developing value-added products, catering to health-conscious consumers, and securing efficient supply chains will be key to capturing market share and driving long-term profitability. The market is expected to reach a value of xx Million by 2033, demonstrating significant growth potential.
APAC Cane Sugar Market Segmentation
-
1. Category
- 1.1. Organic
- 1.2. Conventional
-
2. Form
- 2.1. Crystallized Sugar
- 2.2. Liquid Syrup
-
3. Application
- 3.1. Bakery and Confectionery
- 3.2. Dairy
- 3.3. Beverages
- 3.4. Other Applications
-
4. Geography
- 4.1. China
- 4.2. Japan
- 4.3. India
- 4.4. Australia
- 4.5. Rest of Asia-Pacific
APAC Cane Sugar Market Segmentation By Geography
- 1. China
- 2. Japan
- 3. India
- 4. Australia
- 5. Rest of Asia Pacific
APAC Cane Sugar Market REPORT HIGHLIGHTS
| Aspects | Details |
|---|---|
| Study Period | 2019-2033 |
| Base Year | 2024 |
| Estimated Year | 2025 |
| Forecast Period | 2025-2033 |
| Historical Period | 2019-2024 |
| Growth Rate | CAGR of 8.60% from 2019-2033 |
| Segmentation |
|
Table of Contents
- 1. Introduction
- 1.1. Research Scope
- 1.2. Market Segmentation
- 1.3. Research Methodology
- 1.4. Definitions and Assumptions
- 2. Executive Summary
- 2.1. Introduction
- 3. Market Dynamics
- 3.1. Introduction
- 3.2. Market Drivers
- 3.2.1. Growing Awareness About Insect & Other Alternative Proteins; Increasing Applications Surge Demand for Insect Protein
- 3.3. Market Restrains
- 3.3.1. Augmenting Market Penetration of Other Proteins
- 3.4. Market Trends
- 3.4.1. Increased Trade of Organic Cane Sugar
- 4. Market Factor Analysis
- 4.1. Porters Five Forces
- 4.2. Supply/Value Chain
- 4.3. PESTEL analysis
- 4.4. Market Entropy
- 4.5. Patent/Trademark Analysis
- 5. Global APAC Cane Sugar Market Analysis, Insights and Forecast, 2019-2031
- 5.1. Market Analysis, Insights and Forecast - by Category
- 5.1.1. Organic
- 5.1.2. Conventional
- 5.2. Market Analysis, Insights and Forecast - by Form
- 5.2.1. Crystallized Sugar
- 5.2.2. Liquid Syrup
- 5.3. Market Analysis, Insights and Forecast - by Application
- 5.3.1. Bakery and Confectionery
- 5.3.2. Dairy
- 5.3.3. Beverages
- 5.3.4. Other Applications
- 5.4. Market Analysis, Insights and Forecast - by Geography
- 5.4.1. China
- 5.4.2. Japan
- 5.4.3. India
- 5.4.4. Australia
- 5.4.5. Rest of Asia-Pacific
- 5.5. Market Analysis, Insights and Forecast - by Region
- 5.5.1. China
- 5.5.2. Japan
- 5.5.3. India
- 5.5.4. Australia
- 5.5.5. Rest of Asia Pacific
- 5.1. Market Analysis, Insights and Forecast - by Category
- 6. China APAC Cane Sugar Market Analysis, Insights and Forecast, 2019-2031
- 6.1. Market Analysis, Insights and Forecast - by Category
- 6.1.1. Organic
- 6.1.2. Conventional
- 6.2. Market Analysis, Insights and Forecast - by Form
- 6.2.1. Crystallized Sugar
- 6.2.2. Liquid Syrup
- 6.3. Market Analysis, Insights and Forecast - by Application
- 6.3.1. Bakery and Confectionery
- 6.3.2. Dairy
- 6.3.3. Beverages
- 6.3.4. Other Applications
- 6.4. Market Analysis, Insights and Forecast - by Geography
- 6.4.1. China
- 6.4.2. Japan
- 6.4.3. India
- 6.4.4. Australia
- 6.4.5. Rest of Asia-Pacific
- 6.1. Market Analysis, Insights and Forecast - by Category
- 7. Japan APAC Cane Sugar Market Analysis, Insights and Forecast, 2019-2031
- 7.1. Market Analysis, Insights and Forecast - by Category
- 7.1.1. Organic
- 7.1.2. Conventional
- 7.2. Market Analysis, Insights and Forecast - by Form
- 7.2.1. Crystallized Sugar
- 7.2.2. Liquid Syrup
- 7.3. Market Analysis, Insights and Forecast - by Application
- 7.3.1. Bakery and Confectionery
- 7.3.2. Dairy
- 7.3.3. Beverages
- 7.3.4. Other Applications
- 7.4. Market Analysis, Insights and Forecast - by Geography
- 7.4.1. China
- 7.4.2. Japan
- 7.4.3. India
- 7.4.4. Australia
- 7.4.5. Rest of Asia-Pacific
- 7.1. Market Analysis, Insights and Forecast - by Category
- 8. India APAC Cane Sugar Market Analysis, Insights and Forecast, 2019-2031
- 8.1. Market Analysis, Insights and Forecast - by Category
- 8.1.1. Organic
- 8.1.2. Conventional
- 8.2. Market Analysis, Insights and Forecast - by Form
- 8.2.1. Crystallized Sugar
- 8.2.2. Liquid Syrup
- 8.3. Market Analysis, Insights and Forecast - by Application
- 8.3.1. Bakery and Confectionery
- 8.3.2. Dairy
- 8.3.3. Beverages
- 8.3.4. Other Applications
- 8.4. Market Analysis, Insights and Forecast - by Geography
- 8.4.1. China
- 8.4.2. Japan
- 8.4.3. India
- 8.4.4. Australia
- 8.4.5. Rest of Asia-Pacific
- 8.1. Market Analysis, Insights and Forecast - by Category
- 9. Australia APAC Cane Sugar Market Analysis, Insights and Forecast, 2019-2031
- 9.1. Market Analysis, Insights and Forecast - by Category
- 9.1.1. Organic
- 9.1.2. Conventional
- 9.2. Market Analysis, Insights and Forecast - by Form
- 9.2.1. Crystallized Sugar
- 9.2.2. Liquid Syrup
- 9.3. Market Analysis, Insights and Forecast - by Application
- 9.3.1. Bakery and Confectionery
- 9.3.2. Dairy
- 9.3.3. Beverages
- 9.3.4. Other Applications
- 9.4. Market Analysis, Insights and Forecast - by Geography
- 9.4.1. China
- 9.4.2. Japan
- 9.4.3. India
- 9.4.4. Australia
- 9.4.5. Rest of Asia-Pacific
- 9.1. Market Analysis, Insights and Forecast - by Category
- 10. Rest of Asia Pacific APAC Cane Sugar Market Analysis, Insights and Forecast, 2019-2031
- 10.1. Market Analysis, Insights and Forecast - by Category
- 10.1.1. Organic
- 10.1.2. Conventional
- 10.2. Market Analysis, Insights and Forecast - by Form
- 10.2.1. Crystallized Sugar
- 10.2.2. Liquid Syrup
- 10.3. Market Analysis, Insights and Forecast - by Application
- 10.3.1. Bakery and Confectionery
- 10.3.2. Dairy
- 10.3.3. Beverages
- 10.3.4. Other Applications
- 10.4. Market Analysis, Insights and Forecast - by Geography
- 10.4.1. China
- 10.4.2. Japan
- 10.4.3. India
- 10.4.4. Australia
- 10.4.5. Rest of Asia-Pacific
- 10.1. Market Analysis, Insights and Forecast - by Category
- 11. North America APAC Cane Sugar Market Analysis, Insights and Forecast, 2019-2031
- 11.1. Market Analysis, Insights and Forecast - By Country/Sub-region
- 11.1.1 United States
- 11.1.2 Canada
- 11.1.3 Mexico
- 12. Europe APAC Cane Sugar Market Analysis, Insights and Forecast, 2019-2031
- 12.1. Market Analysis, Insights and Forecast - By Country/Sub-region
- 12.1.1 Germany
- 12.1.2 United Kingdom
- 12.1.3 France
- 12.1.4 Spain
- 12.1.5 Italy
- 12.1.6 Spain
- 12.1.7 Belgium
- 12.1.8 Netherland
- 12.1.9 Nordics
- 12.1.10 Rest of Europe
- 13. Asia Pacific APAC Cane Sugar Market Analysis, Insights and Forecast, 2019-2031
- 13.1. Market Analysis, Insights and Forecast - By Country/Sub-region
- 13.1.1 China
- 13.1.2 Japan
- 13.1.3 India
- 13.1.4 South Korea
- 13.1.5 Southeast Asia
- 13.1.6 Australia
- 13.1.7 Indonesia
- 13.1.8 Phillipes
- 13.1.9 Singapore
- 13.1.10 Thailandc
- 13.1.11 Rest of Asia Pacific
- 14. South America APAC Cane Sugar Market Analysis, Insights and Forecast, 2019-2031
- 14.1. Market Analysis, Insights and Forecast - By Country/Sub-region
- 14.1.1 Brazil
- 14.1.2 Argentina
- 14.1.3 Peru
- 14.1.4 Chile
- 14.1.5 Colombia
- 14.1.6 Ecuador
- 14.1.7 Venezuela
- 14.1.8 Rest of South America
- 15. MEA APAC Cane Sugar Market Analysis, Insights and Forecast, 2019-2031
- 15.1. Market Analysis, Insights and Forecast - By Country/Sub-region
- 15.1.1 United Arab Emirates
- 15.1.2 Saudi Arabia
- 15.1.3 South Africa
- 15.1.4 Rest of Middle East and Africa
- 16. Competitive Analysis
- 16.1. Global Market Share Analysis 2024
- 16.2. Company Profiles
- 16.2.1 Triveni Engineering & Industries Ltd (Ganga Sugar Corporation)*List Not Exhaustive
- 16.2.1.1. Overview
- 16.2.1.2. Products
- 16.2.1.3. SWOT Analysis
- 16.2.1.4. Recent Developments
- 16.2.1.5. Financials (Based on Availability)
- 16.2.2 Louis Dreyfus Company B V
- 16.2.2.1. Overview
- 16.2.2.2. Products
- 16.2.2.3. SWOT Analysis
- 16.2.2.4. Recent Developments
- 16.2.2.5. Financials (Based on Availability)
- 16.2.3 Rajshree Sugars & Chemicals Limited
- 16.2.3.1. Overview
- 16.2.3.2. Products
- 16.2.3.3. SWOT Analysis
- 16.2.3.4. Recent Developments
- 16.2.3.5. Financials (Based on Availability)
- 16.2.4 American Sugar Refining Inc
- 16.2.4.1. Overview
- 16.2.4.2. Products
- 16.2.4.3. SWOT Analysis
- 16.2.4.4. Recent Developments
- 16.2.4.5. Financials (Based on Availability)
- 16.2.5 Tate & Lyle PLC
- 16.2.5.1. Overview
- 16.2.5.2. Products
- 16.2.5.3. SWOT Analysis
- 16.2.5.4. Recent Developments
- 16.2.5.5. Financials (Based on Availability)
- 16.2.6 Wilmar Sugar Australia Holdings Pty Ltd
- 16.2.6.1. Overview
- 16.2.6.2. Products
- 16.2.6.3. SWOT Analysis
- 16.2.6.4. Recent Developments
- 16.2.6.5. Financials (Based on Availability)
- 16.2.7 DCM Shriram Consolidated Limited
- 16.2.7.1. Overview
- 16.2.7.2. Products
- 16.2.7.3. SWOT Analysis
- 16.2.7.4. Recent Developments
- 16.2.7.5. Financials (Based on Availability)
- 16.2.8 Global Organics Ltd
- 16.2.8.1. Overview
- 16.2.8.2. Products
- 16.2.8.3. SWOT Analysis
- 16.2.8.4. Recent Developments
- 16.2.8.5. Financials (Based on Availability)
- 16.2.9 Rana Sugars Limited
- 16.2.9.1. Overview
- 16.2.9.2. Products
- 16.2.9.3. SWOT Analysis
- 16.2.9.4. Recent Developments
- 16.2.9.5. Financials (Based on Availability)
- 16.2.10 Nanning Sugar Industry Co Ltd
- 16.2.10.1. Overview
- 16.2.10.2. Products
- 16.2.10.3. SWOT Analysis
- 16.2.10.4. Recent Developments
- 16.2.10.5. Financials (Based on Availability)
- 16.2.1 Triveni Engineering & Industries Ltd (Ganga Sugar Corporation)*List Not Exhaustive
List of Figures
- Figure 1: Global APAC Cane Sugar Market Revenue Breakdown (Million, %) by Region 2024 & 2032
- Figure 2: Global APAC Cane Sugar Market Volume Breakdown (k tons, %) by Region 2024 & 2032
- Figure 3: North America APAC Cane Sugar Market Revenue (Million), by Country 2024 & 2032
- Figure 4: North America APAC Cane Sugar Market Volume (k tons), by Country 2024 & 2032
- Figure 5: North America APAC Cane Sugar Market Revenue Share (%), by Country 2024 & 2032
- Figure 6: North America APAC Cane Sugar Market Volume Share (%), by Country 2024 & 2032
- Figure 7: Europe APAC Cane Sugar Market Revenue (Million), by Country 2024 & 2032
- Figure 8: Europe APAC Cane Sugar Market Volume (k tons), by Country 2024 & 2032
- Figure 9: Europe APAC Cane Sugar Market Revenue Share (%), by Country 2024 & 2032
- Figure 10: Europe APAC Cane Sugar Market Volume Share (%), by Country 2024 & 2032
- Figure 11: Asia Pacific APAC Cane Sugar Market Revenue (Million), by Country 2024 & 2032
- Figure 12: Asia Pacific APAC Cane Sugar Market Volume (k tons), by Country 2024 & 2032
- Figure 13: Asia Pacific APAC Cane Sugar Market Revenue Share (%), by Country 2024 & 2032
- Figure 14: Asia Pacific APAC Cane Sugar Market Volume Share (%), by Country 2024 & 2032
- Figure 15: South America APAC Cane Sugar Market Revenue (Million), by Country 2024 & 2032
- Figure 16: South America APAC Cane Sugar Market Volume (k tons), by Country 2024 & 2032
- Figure 17: South America APAC Cane Sugar Market Revenue Share (%), by Country 2024 & 2032
- Figure 18: South America APAC Cane Sugar Market Volume Share (%), by Country 2024 & 2032
- Figure 19: MEA APAC Cane Sugar Market Revenue (Million), by Country 2024 & 2032
- Figure 20: MEA APAC Cane Sugar Market Volume (k tons), by Country 2024 & 2032
- Figure 21: MEA APAC Cane Sugar Market Revenue Share (%), by Country 2024 & 2032
- Figure 22: MEA APAC Cane Sugar Market Volume Share (%), by Country 2024 & 2032
- Figure 23: China APAC Cane Sugar Market Revenue (Million), by Category 2024 & 2032
- Figure 24: China APAC Cane Sugar Market Volume (k tons), by Category 2024 & 2032
- Figure 25: China APAC Cane Sugar Market Revenue Share (%), by Category 2024 & 2032
- Figure 26: China APAC Cane Sugar Market Volume Share (%), by Category 2024 & 2032
- Figure 27: China APAC Cane Sugar Market Revenue (Million), by Form 2024 & 2032
- Figure 28: China APAC Cane Sugar Market Volume (k tons), by Form 2024 & 2032
- Figure 29: China APAC Cane Sugar Market Revenue Share (%), by Form 2024 & 2032
- Figure 30: China APAC Cane Sugar Market Volume Share (%), by Form 2024 & 2032
- Figure 31: China APAC Cane Sugar Market Revenue (Million), by Application 2024 & 2032
- Figure 32: China APAC Cane Sugar Market Volume (k tons), by Application 2024 & 2032
- Figure 33: China APAC Cane Sugar Market Revenue Share (%), by Application 2024 & 2032
- Figure 34: China APAC Cane Sugar Market Volume Share (%), by Application 2024 & 2032
- Figure 35: China APAC Cane Sugar Market Revenue (Million), by Geography 2024 & 2032
- Figure 36: China APAC Cane Sugar Market Volume (k tons), by Geography 2024 & 2032
- Figure 37: China APAC Cane Sugar Market Revenue Share (%), by Geography 2024 & 2032
- Figure 38: China APAC Cane Sugar Market Volume Share (%), by Geography 2024 & 2032
- Figure 39: China APAC Cane Sugar Market Revenue (Million), by Country 2024 & 2032
- Figure 40: China APAC Cane Sugar Market Volume (k tons), by Country 2024 & 2032
- Figure 41: China APAC Cane Sugar Market Revenue Share (%), by Country 2024 & 2032
- Figure 42: China APAC Cane Sugar Market Volume Share (%), by Country 2024 & 2032
- Figure 43: Japan APAC Cane Sugar Market Revenue (Million), by Category 2024 & 2032
- Figure 44: Japan APAC Cane Sugar Market Volume (k tons), by Category 2024 & 2032
- Figure 45: Japan APAC Cane Sugar Market Revenue Share (%), by Category 2024 & 2032
- Figure 46: Japan APAC Cane Sugar Market Volume Share (%), by Category 2024 & 2032
- Figure 47: Japan APAC Cane Sugar Market Revenue (Million), by Form 2024 & 2032
- Figure 48: Japan APAC Cane Sugar Market Volume (k tons), by Form 2024 & 2032
- Figure 49: Japan APAC Cane Sugar Market Revenue Share (%), by Form 2024 & 2032
- Figure 50: Japan APAC Cane Sugar Market Volume Share (%), by Form 2024 & 2032
- Figure 51: Japan APAC Cane Sugar Market Revenue (Million), by Application 2024 & 2032
- Figure 52: Japan APAC Cane Sugar Market Volume (k tons), by Application 2024 & 2032
- Figure 53: Japan APAC Cane Sugar Market Revenue Share (%), by Application 2024 & 2032
- Figure 54: Japan APAC Cane Sugar Market Volume Share (%), by Application 2024 & 2032
- Figure 55: Japan APAC Cane Sugar Market Revenue (Million), by Geography 2024 & 2032
- Figure 56: Japan APAC Cane Sugar Market Volume (k tons), by Geography 2024 & 2032
- Figure 57: Japan APAC Cane Sugar Market Revenue Share (%), by Geography 2024 & 2032
- Figure 58: Japan APAC Cane Sugar Market Volume Share (%), by Geography 2024 & 2032
- Figure 59: Japan APAC Cane Sugar Market Revenue (Million), by Country 2024 & 2032
- Figure 60: Japan APAC Cane Sugar Market Volume (k tons), by Country 2024 & 2032
- Figure 61: Japan APAC Cane Sugar Market Revenue Share (%), by Country 2024 & 2032
- Figure 62: Japan APAC Cane Sugar Market Volume Share (%), by Country 2024 & 2032
- Figure 63: India APAC Cane Sugar Market Revenue (Million), by Category 2024 & 2032
- Figure 64: India APAC Cane Sugar Market Volume (k tons), by Category 2024 & 2032
- Figure 65: India APAC Cane Sugar Market Revenue Share (%), by Category 2024 & 2032
- Figure 66: India APAC Cane Sugar Market Volume Share (%), by Category 2024 & 2032
- Figure 67: India APAC Cane Sugar Market Revenue (Million), by Form 2024 & 2032
- Figure 68: India APAC Cane Sugar Market Volume (k tons), by Form 2024 & 2032
- Figure 69: India APAC Cane Sugar Market Revenue Share (%), by Form 2024 & 2032
- Figure 70: India APAC Cane Sugar Market Volume Share (%), by Form 2024 & 2032
- Figure 71: India APAC Cane Sugar Market Revenue (Million), by Application 2024 & 2032
- Figure 72: India APAC Cane Sugar Market Volume (k tons), by Application 2024 & 2032
- Figure 73: India APAC Cane Sugar Market Revenue Share (%), by Application 2024 & 2032
- Figure 74: India APAC Cane Sugar Market Volume Share (%), by Application 2024 & 2032
- Figure 75: India APAC Cane Sugar Market Revenue (Million), by Geography 2024 & 2032
- Figure 76: India APAC Cane Sugar Market Volume (k tons), by Geography 2024 & 2032
- Figure 77: India APAC Cane Sugar Market Revenue Share (%), by Geography 2024 & 2032
- Figure 78: India APAC Cane Sugar Market Volume Share (%), by Geography 2024 & 2032
- Figure 79: India APAC Cane Sugar Market Revenue (Million), by Country 2024 & 2032
- Figure 80: India APAC Cane Sugar Market Volume (k tons), by Country 2024 & 2032
- Figure 81: India APAC Cane Sugar Market Revenue Share (%), by Country 2024 & 2032
- Figure 82: India APAC Cane Sugar Market Volume Share (%), by Country 2024 & 2032
- Figure 83: Australia APAC Cane Sugar Market Revenue (Million), by Category 2024 & 2032
- Figure 84: Australia APAC Cane Sugar Market Volume (k tons), by Category 2024 & 2032
- Figure 85: Australia APAC Cane Sugar Market Revenue Share (%), by Category 2024 & 2032
- Figure 86: Australia APAC Cane Sugar Market Volume Share (%), by Category 2024 & 2032
- Figure 87: Australia APAC Cane Sugar Market Revenue (Million), by Form 2024 & 2032
- Figure 88: Australia APAC Cane Sugar Market Volume (k tons), by Form 2024 & 2032
- Figure 89: Australia APAC Cane Sugar Market Revenue Share (%), by Form 2024 & 2032
- Figure 90: Australia APAC Cane Sugar Market Volume Share (%), by Form 2024 & 2032
- Figure 91: Australia APAC Cane Sugar Market Revenue (Million), by Application 2024 & 2032
- Figure 92: Australia APAC Cane Sugar Market Volume (k tons), by Application 2024 & 2032
- Figure 93: Australia APAC Cane Sugar Market Revenue Share (%), by Application 2024 & 2032
- Figure 94: Australia APAC Cane Sugar Market Volume Share (%), by Application 2024 & 2032
- Figure 95: Australia APAC Cane Sugar Market Revenue (Million), by Geography 2024 & 2032
- Figure 96: Australia APAC Cane Sugar Market Volume (k tons), by Geography 2024 & 2032
- Figure 97: Australia APAC Cane Sugar Market Revenue Share (%), by Geography 2024 & 2032
- Figure 98: Australia APAC Cane Sugar Market Volume Share (%), by Geography 2024 & 2032
- Figure 99: Australia APAC Cane Sugar Market Revenue (Million), by Country 2024 & 2032
- Figure 100: Australia APAC Cane Sugar Market Volume (k tons), by Country 2024 & 2032
- Figure 101: Australia APAC Cane Sugar Market Revenue Share (%), by Country 2024 & 2032
- Figure 102: Australia APAC Cane Sugar Market Volume Share (%), by Country 2024 & 2032
- Figure 103: Rest of Asia Pacific APAC Cane Sugar Market Revenue (Million), by Category 2024 & 2032
- Figure 104: Rest of Asia Pacific APAC Cane Sugar Market Volume (k tons), by Category 2024 & 2032
- Figure 105: Rest of Asia Pacific APAC Cane Sugar Market Revenue Share (%), by Category 2024 & 2032
- Figure 106: Rest of Asia Pacific APAC Cane Sugar Market Volume Share (%), by Category 2024 & 2032
- Figure 107: Rest of Asia Pacific APAC Cane Sugar Market Revenue (Million), by Form 2024 & 2032
- Figure 108: Rest of Asia Pacific APAC Cane Sugar Market Volume (k tons), by Form 2024 & 2032
- Figure 109: Rest of Asia Pacific APAC Cane Sugar Market Revenue Share (%), by Form 2024 & 2032
- Figure 110: Rest of Asia Pacific APAC Cane Sugar Market Volume Share (%), by Form 2024 & 2032
- Figure 111: Rest of Asia Pacific APAC Cane Sugar Market Revenue (Million), by Application 2024 & 2032
- Figure 112: Rest of Asia Pacific APAC Cane Sugar Market Volume (k tons), by Application 2024 & 2032
- Figure 113: Rest of Asia Pacific APAC Cane Sugar Market Revenue Share (%), by Application 2024 & 2032
- Figure 114: Rest of Asia Pacific APAC Cane Sugar Market Volume Share (%), by Application 2024 & 2032
- Figure 115: Rest of Asia Pacific APAC Cane Sugar Market Revenue (Million), by Geography 2024 & 2032
- Figure 116: Rest of Asia Pacific APAC Cane Sugar Market Volume (k tons), by Geography 2024 & 2032
- Figure 117: Rest of Asia Pacific APAC Cane Sugar Market Revenue Share (%), by Geography 2024 & 2032
- Figure 118: Rest of Asia Pacific APAC Cane Sugar Market Volume Share (%), by Geography 2024 & 2032
- Figure 119: Rest of Asia Pacific APAC Cane Sugar Market Revenue (Million), by Country 2024 & 2032
- Figure 120: Rest of Asia Pacific APAC Cane Sugar Market Volume (k tons), by Country 2024 & 2032
- Figure 121: Rest of Asia Pacific APAC Cane Sugar Market Revenue Share (%), by Country 2024 & 2032
- Figure 122: Rest of Asia Pacific APAC Cane Sugar Market Volume Share (%), by Country 2024 & 2032
List of Tables
- Table 1: Global APAC Cane Sugar Market Revenue Million Forecast, by Region 2019 & 2032
- Table 2: Global APAC Cane Sugar Market Volume k tons Forecast, by Region 2019 & 2032
- Table 3: Global APAC Cane Sugar Market Revenue Million Forecast, by Category 2019 & 2032
- Table 4: Global APAC Cane Sugar Market Volume k tons Forecast, by Category 2019 & 2032
- Table 5: Global APAC Cane Sugar Market Revenue Million Forecast, by Form 2019 & 2032
- Table 6: Global APAC Cane Sugar Market Volume k tons Forecast, by Form 2019 & 2032
- Table 7: Global APAC Cane Sugar Market Revenue Million Forecast, by Application 2019 & 2032
- Table 8: Global APAC Cane Sugar Market Volume k tons Forecast, by Application 2019 & 2032
- Table 9: Global APAC Cane Sugar Market Revenue Million Forecast, by Geography 2019 & 2032
- Table 10: Global APAC Cane Sugar Market Volume k tons Forecast, by Geography 2019 & 2032
- Table 11: Global APAC Cane Sugar Market Revenue Million Forecast, by Region 2019 & 2032
- Table 12: Global APAC Cane Sugar Market Volume k tons Forecast, by Region 2019 & 2032
- Table 13: Global APAC Cane Sugar Market Revenue Million Forecast, by Country 2019 & 2032
- Table 14: Global APAC Cane Sugar Market Volume k tons Forecast, by Country 2019 & 2032
- Table 15: United States APAC Cane Sugar Market Revenue (Million) Forecast, by Application 2019 & 2032
- Table 16: United States APAC Cane Sugar Market Volume (k tons) Forecast, by Application 2019 & 2032
- Table 17: Canada APAC Cane Sugar Market Revenue (Million) Forecast, by Application 2019 & 2032
- Table 18: Canada APAC Cane Sugar Market Volume (k tons) Forecast, by Application 2019 & 2032
- Table 19: Mexico APAC Cane Sugar Market Revenue (Million) Forecast, by Application 2019 & 2032
- Table 20: Mexico APAC Cane Sugar Market Volume (k tons) Forecast, by Application 2019 & 2032
- Table 21: Global APAC Cane Sugar Market Revenue Million Forecast, by Country 2019 & 2032
- Table 22: Global APAC Cane Sugar Market Volume k tons Forecast, by Country 2019 & 2032
- Table 23: Germany APAC Cane Sugar Market Revenue (Million) Forecast, by Application 2019 & 2032
- Table 24: Germany APAC Cane Sugar Market Volume (k tons) Forecast, by Application 2019 & 2032
- Table 25: United Kingdom APAC Cane Sugar Market Revenue (Million) Forecast, by Application 2019 & 2032
- Table 26: United Kingdom APAC Cane Sugar Market Volume (k tons) Forecast, by Application 2019 & 2032
- Table 27: France APAC Cane Sugar Market Revenue (Million) Forecast, by Application 2019 & 2032
- Table 28: France APAC Cane Sugar Market Volume (k tons) Forecast, by Application 2019 & 2032
- Table 29: Spain APAC Cane Sugar Market Revenue (Million) Forecast, by Application 2019 & 2032
- Table 30: Spain APAC Cane Sugar Market Volume (k tons) Forecast, by Application 2019 & 2032
- Table 31: Italy APAC Cane Sugar Market Revenue (Million) Forecast, by Application 2019 & 2032
- Table 32: Italy APAC Cane Sugar Market Volume (k tons) Forecast, by Application 2019 & 2032
- Table 33: Spain APAC Cane Sugar Market Revenue (Million) Forecast, by Application 2019 & 2032
- Table 34: Spain APAC Cane Sugar Market Volume (k tons) Forecast, by Application 2019 & 2032
- Table 35: Belgium APAC Cane Sugar Market Revenue (Million) Forecast, by Application 2019 & 2032
- Table 36: Belgium APAC Cane Sugar Market Volume (k tons) Forecast, by Application 2019 & 2032
- Table 37: Netherland APAC Cane Sugar Market Revenue (Million) Forecast, by Application 2019 & 2032
- Table 38: Netherland APAC Cane Sugar Market Volume (k tons) Forecast, by Application 2019 & 2032
- Table 39: Nordics APAC Cane Sugar Market Revenue (Million) Forecast, by Application 2019 & 2032
- Table 40: Nordics APAC Cane Sugar Market Volume (k tons) Forecast, by Application 2019 & 2032
- Table 41: Rest of Europe APAC Cane Sugar Market Revenue (Million) Forecast, by Application 2019 & 2032
- Table 42: Rest of Europe APAC Cane Sugar Market Volume (k tons) Forecast, by Application 2019 & 2032
- Table 43: Global APAC Cane Sugar Market Revenue Million Forecast, by Country 2019 & 2032
- Table 44: Global APAC Cane Sugar Market Volume k tons Forecast, by Country 2019 & 2032
- Table 45: China APAC Cane Sugar Market Revenue (Million) Forecast, by Application 2019 & 2032
- Table 46: China APAC Cane Sugar Market Volume (k tons) Forecast, by Application 2019 & 2032
- Table 47: Japan APAC Cane Sugar Market Revenue (Million) Forecast, by Application 2019 & 2032
- Table 48: Japan APAC Cane Sugar Market Volume (k tons) Forecast, by Application 2019 & 2032
- Table 49: India APAC Cane Sugar Market Revenue (Million) Forecast, by Application 2019 & 2032
- Table 50: India APAC Cane Sugar Market Volume (k tons) Forecast, by Application 2019 & 2032
- Table 51: South Korea APAC Cane Sugar Market Revenue (Million) Forecast, by Application 2019 & 2032
- Table 52: South Korea APAC Cane Sugar Market Volume (k tons) Forecast, by Application 2019 & 2032
- Table 53: Southeast Asia APAC Cane Sugar Market Revenue (Million) Forecast, by Application 2019 & 2032
- Table 54: Southeast Asia APAC Cane Sugar Market Volume (k tons) Forecast, by Application 2019 & 2032
- Table 55: Australia APAC Cane Sugar Market Revenue (Million) Forecast, by Application 2019 & 2032
- Table 56: Australia APAC Cane Sugar Market Volume (k tons) Forecast, by Application 2019 & 2032
- Table 57: Indonesia APAC Cane Sugar Market Revenue (Million) Forecast, by Application 2019 & 2032
- Table 58: Indonesia APAC Cane Sugar Market Volume (k tons) Forecast, by Application 2019 & 2032
- Table 59: Phillipes APAC Cane Sugar Market Revenue (Million) Forecast, by Application 2019 & 2032
- Table 60: Phillipes APAC Cane Sugar Market Volume (k tons) Forecast, by Application 2019 & 2032
- Table 61: Singapore APAC Cane Sugar Market Revenue (Million) Forecast, by Application 2019 & 2032
- Table 62: Singapore APAC Cane Sugar Market Volume (k tons) Forecast, by Application 2019 & 2032
- Table 63: Thailandc APAC Cane Sugar Market Revenue (Million) Forecast, by Application 2019 & 2032
- Table 64: Thailandc APAC Cane Sugar Market Volume (k tons) Forecast, by Application 2019 & 2032
- Table 65: Rest of Asia Pacific APAC Cane Sugar Market Revenue (Million) Forecast, by Application 2019 & 2032
- Table 66: Rest of Asia Pacific APAC Cane Sugar Market Volume (k tons) Forecast, by Application 2019 & 2032
- Table 67: Global APAC Cane Sugar Market Revenue Million Forecast, by Country 2019 & 2032
- Table 68: Global APAC Cane Sugar Market Volume k tons Forecast, by Country 2019 & 2032
- Table 69: Brazil APAC Cane Sugar Market Revenue (Million) Forecast, by Application 2019 & 2032
- Table 70: Brazil APAC Cane Sugar Market Volume (k tons) Forecast, by Application 2019 & 2032
- Table 71: Argentina APAC Cane Sugar Market Revenue (Million) Forecast, by Application 2019 & 2032
- Table 72: Argentina APAC Cane Sugar Market Volume (k tons) Forecast, by Application 2019 & 2032
- Table 73: Peru APAC Cane Sugar Market Revenue (Million) Forecast, by Application 2019 & 2032
- Table 74: Peru APAC Cane Sugar Market Volume (k tons) Forecast, by Application 2019 & 2032
- Table 75: Chile APAC Cane Sugar Market Revenue (Million) Forecast, by Application 2019 & 2032
- Table 76: Chile APAC Cane Sugar Market Volume (k tons) Forecast, by Application 2019 & 2032
- Table 77: Colombia APAC Cane Sugar Market Revenue (Million) Forecast, by Application 2019 & 2032
- Table 78: Colombia APAC Cane Sugar Market Volume (k tons) Forecast, by Application 2019 & 2032
- Table 79: Ecuador APAC Cane Sugar Market Revenue (Million) Forecast, by Application 2019 & 2032
- Table 80: Ecuador APAC Cane Sugar Market Volume (k tons) Forecast, by Application 2019 & 2032
- Table 81: Venezuela APAC Cane Sugar Market Revenue (Million) Forecast, by Application 2019 & 2032
- Table 82: Venezuela APAC Cane Sugar Market Volume (k tons) Forecast, by Application 2019 & 2032
- Table 83: Rest of South America APAC Cane Sugar Market Revenue (Million) Forecast, by Application 2019 & 2032
- Table 84: Rest of South America APAC Cane Sugar Market Volume (k tons) Forecast, by Application 2019 & 2032
- Table 85: Global APAC Cane Sugar Market Revenue Million Forecast, by Country 2019 & 2032
- Table 86: Global APAC Cane Sugar Market Volume k tons Forecast, by Country 2019 & 2032
- Table 87: United Arab Emirates APAC Cane Sugar Market Revenue (Million) Forecast, by Application 2019 & 2032
- Table 88: United Arab Emirates APAC Cane Sugar Market Volume (k tons) Forecast, by Application 2019 & 2032
- Table 89: Saudi Arabia APAC Cane Sugar Market Revenue (Million) Forecast, by Application 2019 & 2032
- Table 90: Saudi Arabia APAC Cane Sugar Market Volume (k tons) Forecast, by Application 2019 & 2032
- Table 91: South Africa APAC Cane Sugar Market Revenue (Million) Forecast, by Application 2019 & 2032
- Table 92: South Africa APAC Cane Sugar Market Volume (k tons) Forecast, by Application 2019 & 2032
- Table 93: Rest of Middle East and Africa APAC Cane Sugar Market Revenue (Million) Forecast, by Application 2019 & 2032
- Table 94: Rest of Middle East and Africa APAC Cane Sugar Market Volume (k tons) Forecast, by Application 2019 & 2032
- Table 95: Global APAC Cane Sugar Market Revenue Million Forecast, by Category 2019 & 2032
- Table 96: Global APAC Cane Sugar Market Volume k tons Forecast, by Category 2019 & 2032
- Table 97: Global APAC Cane Sugar Market Revenue Million Forecast, by Form 2019 & 2032
- Table 98: Global APAC Cane Sugar Market Volume k tons Forecast, by Form 2019 & 2032
- Table 99: Global APAC Cane Sugar Market Revenue Million Forecast, by Application 2019 & 2032
- Table 100: Global APAC Cane Sugar Market Volume k tons Forecast, by Application 2019 & 2032
- Table 101: Global APAC Cane Sugar Market Revenue Million Forecast, by Geography 2019 & 2032
- Table 102: Global APAC Cane Sugar Market Volume k tons Forecast, by Geography 2019 & 2032
- Table 103: Global APAC Cane Sugar Market Revenue Million Forecast, by Country 2019 & 2032
- Table 104: Global APAC Cane Sugar Market Volume k tons Forecast, by Country 2019 & 2032
- Table 105: Global APAC Cane Sugar Market Revenue Million Forecast, by Category 2019 & 2032
- Table 106: Global APAC Cane Sugar Market Volume k tons Forecast, by Category 2019 & 2032
- Table 107: Global APAC Cane Sugar Market Revenue Million Forecast, by Form 2019 & 2032
- Table 108: Global APAC Cane Sugar Market Volume k tons Forecast, by Form 2019 & 2032
- Table 109: Global APAC Cane Sugar Market Revenue Million Forecast, by Application 2019 & 2032
- Table 110: Global APAC Cane Sugar Market Volume k tons Forecast, by Application 2019 & 2032
- Table 111: Global APAC Cane Sugar Market Revenue Million Forecast, by Geography 2019 & 2032
- Table 112: Global APAC Cane Sugar Market Volume k tons Forecast, by Geography 2019 & 2032
- Table 113: Global APAC Cane Sugar Market Revenue Million Forecast, by Country 2019 & 2032
- Table 114: Global APAC Cane Sugar Market Volume k tons Forecast, by Country 2019 & 2032
- Table 115: Global APAC Cane Sugar Market Revenue Million Forecast, by Category 2019 & 2032
- Table 116: Global APAC Cane Sugar Market Volume k tons Forecast, by Category 2019 & 2032
- Table 117: Global APAC Cane Sugar Market Revenue Million Forecast, by Form 2019 & 2032
- Table 118: Global APAC Cane Sugar Market Volume k tons Forecast, by Form 2019 & 2032
- Table 119: Global APAC Cane Sugar Market Revenue Million Forecast, by Application 2019 & 2032
- Table 120: Global APAC Cane Sugar Market Volume k tons Forecast, by Application 2019 & 2032
- Table 121: Global APAC Cane Sugar Market Revenue Million Forecast, by Geography 2019 & 2032
- Table 122: Global APAC Cane Sugar Market Volume k tons Forecast, by Geography 2019 & 2032
- Table 123: Global APAC Cane Sugar Market Revenue Million Forecast, by Country 2019 & 2032
- Table 124: Global APAC Cane Sugar Market Volume k tons Forecast, by Country 2019 & 2032
- Table 125: Global APAC Cane Sugar Market Revenue Million Forecast, by Category 2019 & 2032
- Table 126: Global APAC Cane Sugar Market Volume k tons Forecast, by Category 2019 & 2032
- Table 127: Global APAC Cane Sugar Market Revenue Million Forecast, by Form 2019 & 2032
- Table 128: Global APAC Cane Sugar Market Volume k tons Forecast, by Form 2019 & 2032
- Table 129: Global APAC Cane Sugar Market Revenue Million Forecast, by Application 2019 & 2032
- Table 130: Global APAC Cane Sugar Market Volume k tons Forecast, by Application 2019 & 2032
- Table 131: Global APAC Cane Sugar Market Revenue Million Forecast, by Geography 2019 & 2032
- Table 132: Global APAC Cane Sugar Market Volume k tons Forecast, by Geography 2019 & 2032
- Table 133: Global APAC Cane Sugar Market Revenue Million Forecast, by Country 2019 & 2032
- Table 134: Global APAC Cane Sugar Market Volume k tons Forecast, by Country 2019 & 2032
- Table 135: Global APAC Cane Sugar Market Revenue Million Forecast, by Category 2019 & 2032
- Table 136: Global APAC Cane Sugar Market Volume k tons Forecast, by Category 2019 & 2032
- Table 137: Global APAC Cane Sugar Market Revenue Million Forecast, by Form 2019 & 2032
- Table 138: Global APAC Cane Sugar Market Volume k tons Forecast, by Form 2019 & 2032
- Table 139: Global APAC Cane Sugar Market Revenue Million Forecast, by Application 2019 & 2032
- Table 140: Global APAC Cane Sugar Market Volume k tons Forecast, by Application 2019 & 2032
- Table 141: Global APAC Cane Sugar Market Revenue Million Forecast, by Geography 2019 & 2032
- Table 142: Global APAC Cane Sugar Market Volume k tons Forecast, by Geography 2019 & 2032
- Table 143: Global APAC Cane Sugar Market Revenue Million Forecast, by Country 2019 & 2032
- Table 144: Global APAC Cane Sugar Market Volume k tons Forecast, by Country 2019 & 2032
Frequently Asked Questions
1. What is the projected Compound Annual Growth Rate (CAGR) of the APAC Cane Sugar Market?
The projected CAGR is approximately 8.60%.
2. Which companies are prominent players in the APAC Cane Sugar Market?
Key companies in the market include Triveni Engineering & Industries Ltd (Ganga Sugar Corporation)*List Not Exhaustive, Louis Dreyfus Company B V, Rajshree Sugars & Chemicals Limited, American Sugar Refining Inc, Tate & Lyle PLC, Wilmar Sugar Australia Holdings Pty Ltd, DCM Shriram Consolidated Limited, Global Organics Ltd, Rana Sugars Limited, Nanning Sugar Industry Co Ltd.
3. What are the main segments of the APAC Cane Sugar Market?
The market segments include Category, Form, Application, Geography.
4. Can you provide details about the market size?
The market size is estimated to be USD XX Million as of 2022.
5. What are some drivers contributing to market growth?
Growing Awareness About Insect & Other Alternative Proteins; Increasing Applications Surge Demand for Insect Protein.
6. What are the notable trends driving market growth?
Increased Trade of Organic Cane Sugar.
7. Are there any restraints impacting market growth?
Augmenting Market Penetration of Other Proteins.
8. Can you provide examples of recent developments in the market?
December 2021: MSM Malaysia Holdings Bhd (MSM Malaysia) and Wilmar Sugar Pty Ltd (Wilmar Sugar) inked a collaboration agreement to build a sustainable sugar supply chain. MSM Malaysia and Wilmar Sugar will embark on joint efforts to assist and support each other to pilot an approach to enable sustainable raw sugar sourcing within both companies' joint supply chains by focusing on traceability reporting of sugar supplies and monitoring sustainability performance based on the NDPE Sugar Policy.
9. What pricing options are available for accessing the report?
Pricing options include single-user, multi-user, and enterprise licenses priced at USD 4750, USD 5250, and USD 8750 respectively.
10. Is the market size provided in terms of value or volume?
The market size is provided in terms of value, measured in Million and volume, measured in k tons.
11. Are there any specific market keywords associated with the report?
Yes, the market keyword associated with the report is "APAC Cane Sugar Market," which aids in identifying and referencing the specific market segment covered.
12. How do I determine which pricing option suits my needs best?
The pricing options vary based on user requirements and access needs. Individual users may opt for single-user licenses, while businesses requiring broader access may choose multi-user or enterprise licenses for cost-effective access to the report.
13. Are there any additional resources or data provided in the APAC Cane Sugar Market report?
While the report offers comprehensive insights, it's advisable to review the specific contents or supplementary materials provided to ascertain if additional resources or data are available.
14. How can I stay updated on further developments or reports in the APAC Cane Sugar Market?
To stay informed about further developments, trends, and reports in the APAC Cane Sugar Market, consider subscribing to industry newsletters, following relevant companies and organizations, or regularly checking reputable industry news sources and publications.
Methodology
Step 1 - Identification of Relevant Samples Size from Population Database


Step 2 - Approaches for Defining Global Market Size (Value, Volume* & Price*)

Note*: In applicable scenarios
Step 3 - Data Sources
Primary Research
- Web Analytics
- Survey Reports
- Research Institute
- Latest Research Reports
- Opinion Leaders
Secondary Research
- Annual Reports
- White Paper
- Latest Press Release
- Industry Association
- Paid Database
- Investor Presentations

Step 4 - Data Triangulation
Involves using different sources of information in order to increase the validity of a study
These sources are likely to be stakeholders in a program - participants, other researchers, program staff, other community members, and so on.
Then we put all data in single framework & apply various statistical tools to find out the dynamic on the market.
During the analysis stage, feedback from the stakeholder groups would be compared to determine areas of agreement as well as areas of divergence
