

Key Insights
The Asia-Pacific (APAC) Building Energy Management Systems (BEMS) market is experiencing robust growth, driven by increasing urbanization, stringent government regulations promoting energy efficiency, and a rising awareness of sustainability among building owners and operators. The region's diverse landscape, encompassing rapidly developing economies like China and India alongside established markets like Japan, presents significant opportunities for BEMS providers. The market's expansion is fueled by the adoption of smart building technologies, including Internet of Things (IoT) devices, advanced analytics, and cloud-based platforms. These technologies enable real-time monitoring and control of energy consumption, leading to significant cost savings and improved operational efficiency. Furthermore, the rising demand for enhanced building security and safety features further contributes to the BEMS market's growth. Hardware solutions, such as controllers and gateways, form a substantial segment, while the software and services components are experiencing faster growth due to increasing demand for sophisticated data analysis and remote management capabilities. China, with its massive construction activities and government initiatives focused on energy efficiency, represents the largest national market within APAC. However, other countries in Southeast Asia are also witnessing significant growth, driven by expanding infrastructure projects and rising energy costs. Challenges remain, including the high initial investment costs associated with BEMS implementation and the need for skilled professionals to manage and maintain these complex systems. Despite these challenges, the long-term outlook for the APAC BEMS market remains positive, with a projected continued strong growth trajectory fueled by technological advancements and increasing governmental support for green building initiatives.
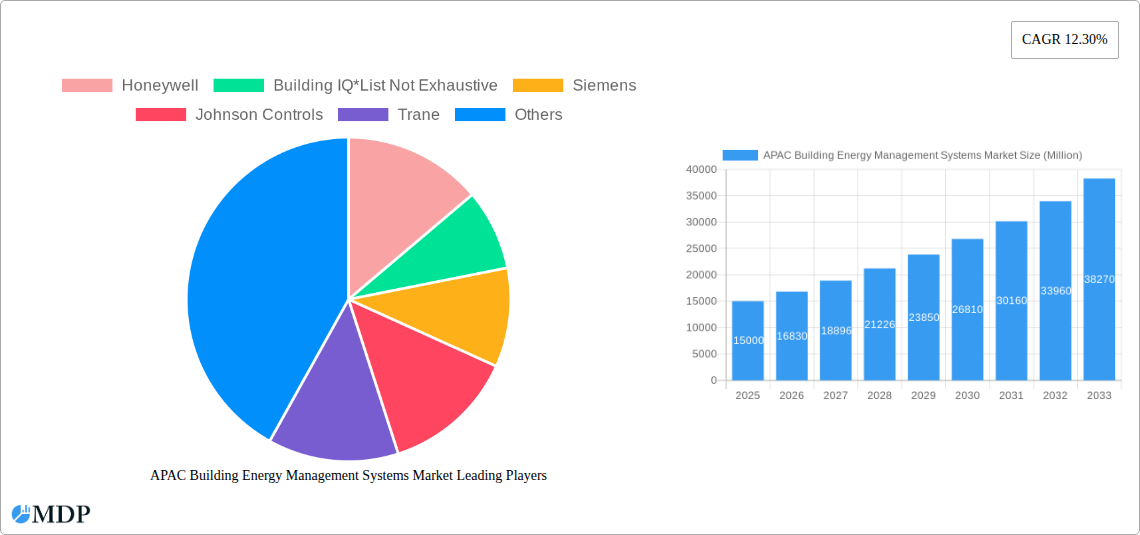
The competitive landscape is highly fragmented, with both global giants and regional players vying for market share. Major international vendors like Honeywell, Siemens, Johnson Controls, and Schneider Electric are leveraging their extensive experience and global reach to capture significant market share. However, local players are also emerging, offering customized solutions tailored to the specific needs of the APAC region. These companies are focused on providing innovative solutions, including energy-efficient building designs, advanced analytics, and cloud-based platforms, to cater to the specific needs of various building types, including commercial, educational, and industrial facilities. The strategic partnerships between BEMS providers and system integrators play a crucial role in accelerating the market's growth by facilitating seamless integration of BEMS into new and existing buildings. The market is further segmented by distribution channels, with direct sales, partner sales, and value-added resellers playing crucial roles in reaching end-users. The continued focus on sustainable building practices, combined with technological advancements and increasing government support, is expected to drive the APAC BEMS market toward even greater heights in the coming years.
APAC Building Energy Management Systems Market: A Comprehensive Report (2019-2033)
This comprehensive report provides an in-depth analysis of the Asia-Pacific (APAC) Building Energy Management Systems (BEMS) market, offering invaluable insights for stakeholders across the value chain. From market dynamics and leading players to emerging opportunities and future trends, this report serves as a crucial resource for strategic decision-making. The study period spans from 2019 to 2033, with 2025 as the base and estimated year, and a forecast period covering 2025-2033. The historical period analyzed is 2019-2024. The market is segmented by end-user application (commercial, educational, industrial, others), country (China, Japan, Southeast Asia, Rest of Asia-Pacific), type of solution (hardware, software, services), and distribution channel (direct/partner sales, value-added resellers, utilities). Key players analyzed include Honeywell, Building IQ, Siemens, Johnson Controls, Trane, Schneider Electric, and ABB.
APAC Building Energy Management Systems Market Market Dynamics & Concentration
The APAC BEMS market exhibits a dynamic interplay of factors driving its growth and shaping its competitive landscape. Market concentration is moderate, with a few major players holding significant shares, but a considerable number of smaller, specialized firms also contributing. Innovation is a key driver, fueled by advancements in IoT, AI, and cloud computing, leading to more efficient and intelligent BEMS solutions. Stringent government regulations promoting energy efficiency and sustainability are further accelerating market expansion. The rising adoption of smart buildings and the increasing need for optimized energy consumption are creating significant demand.
- Market Concentration: The top five players hold an estimated xx% market share in 2025.
- Innovation Drivers: Advancements in AI, IoT, and cloud technologies are creating opportunities for sophisticated BEMS solutions.
- Regulatory Frameworks: Government initiatives promoting energy efficiency in buildings are creating a favorable regulatory environment.
- Product Substitutes: Limited direct substitutes exist, with competition primarily from traditional building management systems.
- End-User Trends: The shift towards smart and sustainable buildings is driving demand across all segments.
- M&A Activities: The number of M&A deals in the APAC BEMS market has been steadily increasing, reaching approximately xx deals in 2024.
APAC Building Energy Management Systems Market Industry Trends & Analysis
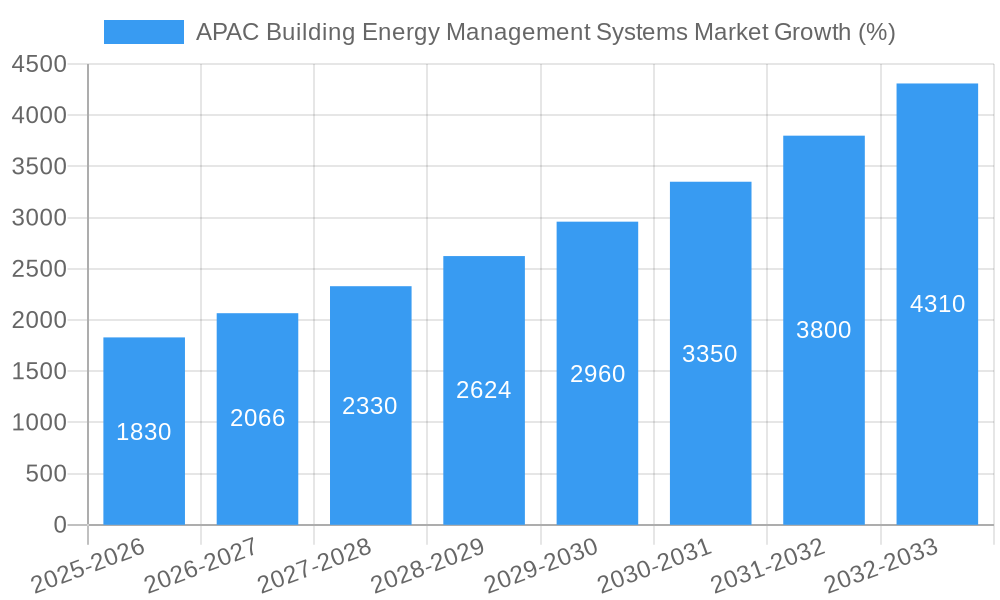
The APAC BEMS market is experiencing robust growth, driven by several factors. The increasing awareness of energy efficiency and sustainability among building owners and operators is a primary driver. Rapid urbanization and infrastructure development across the region are creating a significant demand for BEMS solutions. Technological advancements, including the integration of AI and machine learning, are enhancing the capabilities of BEMS, leading to improved energy savings and operational efficiencies. The growing adoption of smart building technologies and the increasing focus on building automation are also contributing to the market's expansion. The market is projected to witness a Compound Annual Growth Rate (CAGR) of xx% during the forecast period (2025-2033). Market penetration is expected to reach xx% by 2033. Competitive dynamics are characterized by intense competition among established players and emerging technology providers.
Leading Markets & Segments in APAC Building Energy Management Systems Market
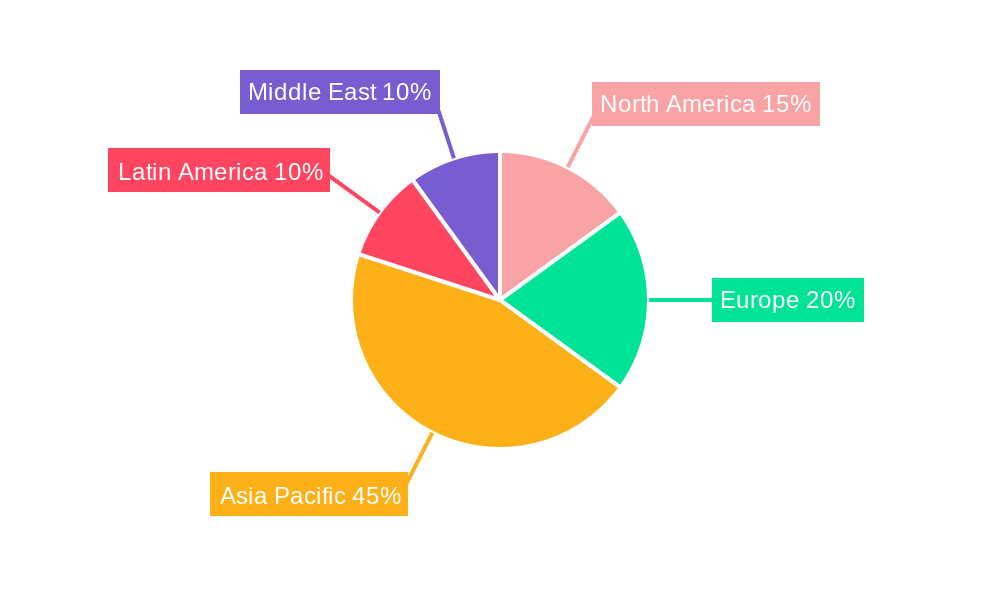
China dominates the APAC BEMS market, driven by rapid economic growth, extensive infrastructure development, and supportive government policies. The commercial segment holds the largest share of the end-user application market, followed by the industrial segment. Hardware solutions (controllers and gateways) constitute the largest share of the type of solution segment. Direct/partner sales are the most prevalent distribution channel.
- Key Drivers in China: Strong economic growth, government support for energy efficiency, and large-scale construction projects.
- Key Drivers in Japan: High energy costs, advanced technological infrastructure, and stringent environmental regulations.
- Key Drivers in Southeast Asia: Rapid urbanization, increasing industrialization, and a rising focus on sustainable building practices.
- Dominance Analysis: China's significant share is attributed to its large building stock and rapid infrastructure development. The commercial segment's leading position reflects the growing emphasis on energy efficiency in commercial buildings.
APAP Building Energy Management Systems Market Product Developments
Recent product innovations in the APAC BEMS market focus on enhancing energy efficiency, integrating advanced technologies like AI and IoT, and improving user experience. New offerings are characterized by cloud-based platforms, enhanced analytics capabilities, and seamless integration with other building systems. These advancements provide competitive advantages through improved energy savings, cost reductions, and enhanced operational efficiency, aligning with the market’s increasing demand for sophisticated and intelligent BEMS solutions.
Key Drivers of APAC Building Energy Management Systems Market Growth
Several key factors are driving the growth of the APAC BEMS market. Government regulations promoting energy efficiency and sustainability are incentivizing adoption. The rising cost of energy is pushing building owners to seek cost-effective solutions. Technological advancements in BEMS are enhancing efficiency and creating new possibilities for energy optimization. The growing adoption of smart buildings and the focus on building automation are creating further demand.
Challenges in the APAC Building Energy Management Systems Market Market
The APAC BEMS market faces several challenges, including high initial investment costs for BEMS implementation, concerns about data security and privacy, and the need for skilled professionals to install and maintain these systems. Supply chain disruptions can impact the availability of components, affecting project timelines. Competitive pressures from both established players and new entrants necessitate continuous innovation and differentiation. These factors can collectively hinder market growth by xx% annually.
Emerging Opportunities in APAP Building Energy Management Systems Market
The APAC BEMS market presents significant growth opportunities. The increasing adoption of renewable energy sources creates opportunities for integrating BEMS with renewable energy systems. The growing focus on smart cities and the development of smart building infrastructure will fuel demand. Strategic partnerships between BEMS providers and building owners will accelerate market penetration. The expansion of BEMS into emerging markets within the APAC region offers significant potential.
Leading Players in the APAC Building Energy Management Systems Market Sector
- Honeywell
- Building IQ
- Siemens
- Johnson Controls
- Trane
- Schneider Electric
- ABB
Key Milestones in APAC Building Energy Management Systems Market Industry
- August 2022: Johnson Controls partnered with Microsoft Beijing Campus, achieving 27.9% energy savings and 98% equipment uptime. This success secured an energy-saving endorsement and financial subsidy from the Beijing Municipal and Haidian District Governments. This highlights the significant cost savings and government incentives driving BEMS adoption.
- March 2022: WRI India partnered with the Energy Management Centre Kerala (EMC-K) to launch "Oorjayan," a state-wide program to improve energy efficiency in government buildings. This initiative underscores the growing role of government partnerships and large-scale programs in driving market growth.
Strategic Outlook for APAC Building Energy Management Systems Market Market
The APAC BEMS market is poised for significant growth, driven by increasing energy costs, stringent environmental regulations, and the growing adoption of smart building technologies. Companies can capitalize on this by focusing on developing innovative, cost-effective solutions, forging strategic partnerships, and expanding into emerging markets. The integration of AI, IoT, and cloud computing will be critical for success. A focus on sustainability and providing value-added services will further enhance competitiveness and drive future market potential.
APAC Building Energy Management Systems Market Segmentation
-
1. Type of Solution
- 1.1. Hardware (controllers and gateways)
- 1.2. Software
- 1.3. Services
-
2. Distribution Channel
- 2.1. Direct/Partner Sales/Retail
- 2.2. Value-added Resellers/System Integrators
- 2.3. Utilities/Energy Service Providers
-
3. End-user Application
- 3.1. Commercial
- 3.2. Educational
- 3.3. Industrial
- 3.4. Others
APAC Building Energy Management Systems Market Segmentation By Geography
-
1. North America
- 1.1. United States
- 1.2. Canada
- 1.3. Mexico
-
2. South America
- 2.1. Brazil
- 2.2. Argentina
- 2.3. Rest of South America
-
3. Europe
- 3.1. United Kingdom
- 3.2. Germany
- 3.3. France
- 3.4. Italy
- 3.5. Spain
- 3.6. Russia
- 3.7. Benelux
- 3.8. Nordics
- 3.9. Rest of Europe
-
4. Middle East & Africa
- 4.1. Turkey
- 4.2. Israel
- 4.3. GCC
- 4.4. North Africa
- 4.5. South Africa
- 4.6. Rest of Middle East & Africa
-
5. Asia Pacific
- 5.1. China
- 5.2. India
- 5.3. Japan
- 5.4. South Korea
- 5.5. ASEAN
- 5.6. Oceania
- 5.7. Rest of Asia Pacific
APAC Building Energy Management Systems Market REPORT HIGHLIGHTS
| Aspects | Details |
|---|---|
| Study Period | 2019-2033 |
| Base Year | 2024 |
| Estimated Year | 2025 |
| Forecast Period | 2025-2033 |
| Historical Period | 2019-2024 |
| Growth Rate | CAGR of 12.30% from 2019-2033 |
| Segmentation |
|
Table of Contents
- 1. Introduction
- 1.1. Research Scope
- 1.2. Market Segmentation
- 1.3. Research Methodology
- 1.4. Definitions and Assumptions
- 2. Executive Summary
- 2.1. Introduction
- 3. Market Dynamics
- 3.1. Introduction
- 3.2. Market Drivers
- 3.2.1. Rapid Growing Numbe of End-users; Low Manufacturing Costs
- 3.3. Market Restrains
- 3.3.1. Technical Difficulties
- 3.4. Market Trends
- 3.4.1. The Increase in Demand from the Residential Segment is Expected to Drive the Market
- 4. Market Factor Analysis
- 4.1. Porters Five Forces
- 4.2. Supply/Value Chain
- 4.3. PESTEL analysis
- 4.4. Market Entropy
- 4.5. Patent/Trademark Analysis
- 5. Global APAC Building Energy Management Systems Market Analysis, Insights and Forecast, 2019-2031
- 5.1. Market Analysis, Insights and Forecast - by Type of Solution
- 5.1.1. Hardware (controllers and gateways)
- 5.1.2. Software
- 5.1.3. Services
- 5.2. Market Analysis, Insights and Forecast - by Distribution Channel
- 5.2.1. Direct/Partner Sales/Retail
- 5.2.2. Value-added Resellers/System Integrators
- 5.2.3. Utilities/Energy Service Providers
- 5.3. Market Analysis, Insights and Forecast - by End-user Application
- 5.3.1. Commercial
- 5.3.2. Educational
- 5.3.3. Industrial
- 5.3.4. Others
- 5.4. Market Analysis, Insights and Forecast - by Region
- 5.4.1. North America
- 5.4.2. South America
- 5.4.3. Europe
- 5.4.4. Middle East & Africa
- 5.4.5. Asia Pacific
- 5.1. Market Analysis, Insights and Forecast - by Type of Solution
- 6. North America APAC Building Energy Management Systems Market Analysis, Insights and Forecast, 2019-2031
- 6.1. Market Analysis, Insights and Forecast - by Type of Solution
- 6.1.1. Hardware (controllers and gateways)
- 6.1.2. Software
- 6.1.3. Services
- 6.2. Market Analysis, Insights and Forecast - by Distribution Channel
- 6.2.1. Direct/Partner Sales/Retail
- 6.2.2. Value-added Resellers/System Integrators
- 6.2.3. Utilities/Energy Service Providers
- 6.3. Market Analysis, Insights and Forecast - by End-user Application
- 6.3.1. Commercial
- 6.3.2. Educational
- 6.3.3. Industrial
- 6.3.4. Others
- 6.1. Market Analysis, Insights and Forecast - by Type of Solution
- 7. South America APAC Building Energy Management Systems Market Analysis, Insights and Forecast, 2019-2031
- 7.1. Market Analysis, Insights and Forecast - by Type of Solution
- 7.1.1. Hardware (controllers and gateways)
- 7.1.2. Software
- 7.1.3. Services
- 7.2. Market Analysis, Insights and Forecast - by Distribution Channel
- 7.2.1. Direct/Partner Sales/Retail
- 7.2.2. Value-added Resellers/System Integrators
- 7.2.3. Utilities/Energy Service Providers
- 7.3. Market Analysis, Insights and Forecast - by End-user Application
- 7.3.1. Commercial
- 7.3.2. Educational
- 7.3.3. Industrial
- 7.3.4. Others
- 7.1. Market Analysis, Insights and Forecast - by Type of Solution
- 8. Europe APAC Building Energy Management Systems Market Analysis, Insights and Forecast, 2019-2031
- 8.1. Market Analysis, Insights and Forecast - by Type of Solution
- 8.1.1. Hardware (controllers and gateways)
- 8.1.2. Software
- 8.1.3. Services
- 8.2. Market Analysis, Insights and Forecast - by Distribution Channel
- 8.2.1. Direct/Partner Sales/Retail
- 8.2.2. Value-added Resellers/System Integrators
- 8.2.3. Utilities/Energy Service Providers
- 8.3. Market Analysis, Insights and Forecast - by End-user Application
- 8.3.1. Commercial
- 8.3.2. Educational
- 8.3.3. Industrial
- 8.3.4. Others
- 8.1. Market Analysis, Insights and Forecast - by Type of Solution
- 9. Middle East & Africa APAC Building Energy Management Systems Market Analysis, Insights and Forecast, 2019-2031
- 9.1. Market Analysis, Insights and Forecast - by Type of Solution
- 9.1.1. Hardware (controllers and gateways)
- 9.1.2. Software
- 9.1.3. Services
- 9.2. Market Analysis, Insights and Forecast - by Distribution Channel
- 9.2.1. Direct/Partner Sales/Retail
- 9.2.2. Value-added Resellers/System Integrators
- 9.2.3. Utilities/Energy Service Providers
- 9.3. Market Analysis, Insights and Forecast - by End-user Application
- 9.3.1. Commercial
- 9.3.2. Educational
- 9.3.3. Industrial
- 9.3.4. Others
- 9.1. Market Analysis, Insights and Forecast - by Type of Solution
- 10. Asia Pacific APAC Building Energy Management Systems Market Analysis, Insights and Forecast, 2019-2031
- 10.1. Market Analysis, Insights and Forecast - by Type of Solution
- 10.1.1. Hardware (controllers and gateways)
- 10.1.2. Software
- 10.1.3. Services
- 10.2. Market Analysis, Insights and Forecast - by Distribution Channel
- 10.2.1. Direct/Partner Sales/Retail
- 10.2.2. Value-added Resellers/System Integrators
- 10.2.3. Utilities/Energy Service Providers
- 10.3. Market Analysis, Insights and Forecast - by End-user Application
- 10.3.1. Commercial
- 10.3.2. Educational
- 10.3.3. Industrial
- 10.3.4. Others
- 10.1. Market Analysis, Insights and Forecast - by Type of Solution
- 11. North America APAC Building Energy Management Systems Market Analysis, Insights and Forecast, 2019-2031
- 11.1. Market Analysis, Insights and Forecast - By Country/Sub-region
- 11.1.1 United States
- 11.1.2 Canada
- 12. Europe APAC Building Energy Management Systems Market Analysis, Insights and Forecast, 2019-2031
- 12.1. Market Analysis, Insights and Forecast - By Country/Sub-region
- 12.1.1 United Kingdom
- 12.1.2 Germany
- 12.1.3 France
- 12.1.4 Benelux
- 12.1.5 Rest of Europe
- 13. Asia Pacific APAC Building Energy Management Systems Market Analysis, Insights and Forecast, 2019-2031
- 13.1. Market Analysis, Insights and Forecast - By Country/Sub-region
- 13.1.1 China
- 13.1.2 India
- 13.1.3 Japan
- 13.1.4 Rest of Asia Pacific
- 14. Latin America APAC Building Energy Management Systems Market Analysis, Insights and Forecast, 2019-2031
- 14.1. Market Analysis, Insights and Forecast - By Country/Sub-region
- 14.1.1 Brazil
- 14.1.2 Argentina
- 14.1.3 Mexico
- 14.1.4 Rest of Latin America
- 15. Middle East APAC Building Energy Management Systems Market Analysis, Insights and Forecast, 2019-2031
- 15.1. Market Analysis, Insights and Forecast - By Country/Sub-region
- 15.1.1.
- 16. United Arab Emirates APAC Building Energy Management Systems Market Analysis, Insights and Forecast, 2019-2031
- 16.1. Market Analysis, Insights and Forecast - By Country/Sub-region
- 16.1.1 Saudi Arabia
- 16.1.2 South Africa
- 16.1.3 Rest of Middle East
- 17. Competitive Analysis
- 17.1. Global Market Share Analysis 2024
- 17.2. Company Profiles
- 17.2.1 Honeywell
- 17.2.1.1. Overview
- 17.2.1.2. Products
- 17.2.1.3. SWOT Analysis
- 17.2.1.4. Recent Developments
- 17.2.1.5. Financials (Based on Availability)
- 17.2.2 Building IQ*List Not Exhaustive
- 17.2.2.1. Overview
- 17.2.2.2. Products
- 17.2.2.3. SWOT Analysis
- 17.2.2.4. Recent Developments
- 17.2.2.5. Financials (Based on Availability)
- 17.2.3 Siemens
- 17.2.3.1. Overview
- 17.2.3.2. Products
- 17.2.3.3. SWOT Analysis
- 17.2.3.4. Recent Developments
- 17.2.3.5. Financials (Based on Availability)
- 17.2.4 Johnson Controls
- 17.2.4.1. Overview
- 17.2.4.2. Products
- 17.2.4.3. SWOT Analysis
- 17.2.4.4. Recent Developments
- 17.2.4.5. Financials (Based on Availability)
- 17.2.5 Trane
- 17.2.5.1. Overview
- 17.2.5.2. Products
- 17.2.5.3. SWOT Analysis
- 17.2.5.4. Recent Developments
- 17.2.5.5. Financials (Based on Availability)
- 17.2.6 Schneider Electric
- 17.2.6.1. Overview
- 17.2.6.2. Products
- 17.2.6.3. SWOT Analysis
- 17.2.6.4. Recent Developments
- 17.2.6.5. Financials (Based on Availability)
- 17.2.7 ABB
- 17.2.7.1. Overview
- 17.2.7.2. Products
- 17.2.7.3. SWOT Analysis
- 17.2.7.4. Recent Developments
- 17.2.7.5. Financials (Based on Availability)
- 17.2.1 Honeywell
List of Figures
- Figure 1: Global APAC Building Energy Management Systems Market Revenue Breakdown (Million, %) by Region 2024 & 2032
- Figure 2: North America APAC Building Energy Management Systems Market Revenue (Million), by Country 2024 & 2032
- Figure 3: North America APAC Building Energy Management Systems Market Revenue Share (%), by Country 2024 & 2032
- Figure 4: Europe APAC Building Energy Management Systems Market Revenue (Million), by Country 2024 & 2032
- Figure 5: Europe APAC Building Energy Management Systems Market Revenue Share (%), by Country 2024 & 2032
- Figure 6: Asia Pacific APAC Building Energy Management Systems Market Revenue (Million), by Country 2024 & 2032
- Figure 7: Asia Pacific APAC Building Energy Management Systems Market Revenue Share (%), by Country 2024 & 2032
- Figure 8: Latin America APAC Building Energy Management Systems Market Revenue (Million), by Country 2024 & 2032
- Figure 9: Latin America APAC Building Energy Management Systems Market Revenue Share (%), by Country 2024 & 2032
- Figure 10: Middle East APAC Building Energy Management Systems Market Revenue (Million), by Country 2024 & 2032
- Figure 11: Middle East APAC Building Energy Management Systems Market Revenue Share (%), by Country 2024 & 2032
- Figure 12: United Arab Emirates APAC Building Energy Management Systems Market Revenue (Million), by Country 2024 & 2032
- Figure 13: United Arab Emirates APAC Building Energy Management Systems Market Revenue Share (%), by Country 2024 & 2032
- Figure 14: North America APAC Building Energy Management Systems Market Revenue (Million), by Type of Solution 2024 & 2032
- Figure 15: North America APAC Building Energy Management Systems Market Revenue Share (%), by Type of Solution 2024 & 2032
- Figure 16: North America APAC Building Energy Management Systems Market Revenue (Million), by Distribution Channel 2024 & 2032
- Figure 17: North America APAC Building Energy Management Systems Market Revenue Share (%), by Distribution Channel 2024 & 2032
- Figure 18: North America APAC Building Energy Management Systems Market Revenue (Million), by End-user Application 2024 & 2032
- Figure 19: North America APAC Building Energy Management Systems Market Revenue Share (%), by End-user Application 2024 & 2032
- Figure 20: North America APAC Building Energy Management Systems Market Revenue (Million), by Country 2024 & 2032
- Figure 21: North America APAC Building Energy Management Systems Market Revenue Share (%), by Country 2024 & 2032
- Figure 22: South America APAC Building Energy Management Systems Market Revenue (Million), by Type of Solution 2024 & 2032
- Figure 23: South America APAC Building Energy Management Systems Market Revenue Share (%), by Type of Solution 2024 & 2032
- Figure 24: South America APAC Building Energy Management Systems Market Revenue (Million), by Distribution Channel 2024 & 2032
- Figure 25: South America APAC Building Energy Management Systems Market Revenue Share (%), by Distribution Channel 2024 & 2032
- Figure 26: South America APAC Building Energy Management Systems Market Revenue (Million), by End-user Application 2024 & 2032
- Figure 27: South America APAC Building Energy Management Systems Market Revenue Share (%), by End-user Application 2024 & 2032
- Figure 28: South America APAC Building Energy Management Systems Market Revenue (Million), by Country 2024 & 2032
- Figure 29: South America APAC Building Energy Management Systems Market Revenue Share (%), by Country 2024 & 2032
- Figure 30: Europe APAC Building Energy Management Systems Market Revenue (Million), by Type of Solution 2024 & 2032
- Figure 31: Europe APAC Building Energy Management Systems Market Revenue Share (%), by Type of Solution 2024 & 2032
- Figure 32: Europe APAC Building Energy Management Systems Market Revenue (Million), by Distribution Channel 2024 & 2032
- Figure 33: Europe APAC Building Energy Management Systems Market Revenue Share (%), by Distribution Channel 2024 & 2032
- Figure 34: Europe APAC Building Energy Management Systems Market Revenue (Million), by End-user Application 2024 & 2032
- Figure 35: Europe APAC Building Energy Management Systems Market Revenue Share (%), by End-user Application 2024 & 2032
- Figure 36: Europe APAC Building Energy Management Systems Market Revenue (Million), by Country 2024 & 2032
- Figure 37: Europe APAC Building Energy Management Systems Market Revenue Share (%), by Country 2024 & 2032
- Figure 38: Middle East & Africa APAC Building Energy Management Systems Market Revenue (Million), by Type of Solution 2024 & 2032
- Figure 39: Middle East & Africa APAC Building Energy Management Systems Market Revenue Share (%), by Type of Solution 2024 & 2032
- Figure 40: Middle East & Africa APAC Building Energy Management Systems Market Revenue (Million), by Distribution Channel 2024 & 2032
- Figure 41: Middle East & Africa APAC Building Energy Management Systems Market Revenue Share (%), by Distribution Channel 2024 & 2032
- Figure 42: Middle East & Africa APAC Building Energy Management Systems Market Revenue (Million), by End-user Application 2024 & 2032
- Figure 43: Middle East & Africa APAC Building Energy Management Systems Market Revenue Share (%), by End-user Application 2024 & 2032
- Figure 44: Middle East & Africa APAC Building Energy Management Systems Market Revenue (Million), by Country 2024 & 2032
- Figure 45: Middle East & Africa APAC Building Energy Management Systems Market Revenue Share (%), by Country 2024 & 2032
- Figure 46: Asia Pacific APAC Building Energy Management Systems Market Revenue (Million), by Type of Solution 2024 & 2032
- Figure 47: Asia Pacific APAC Building Energy Management Systems Market Revenue Share (%), by Type of Solution 2024 & 2032
- Figure 48: Asia Pacific APAC Building Energy Management Systems Market Revenue (Million), by Distribution Channel 2024 & 2032
- Figure 49: Asia Pacific APAC Building Energy Management Systems Market Revenue Share (%), by Distribution Channel 2024 & 2032
- Figure 50: Asia Pacific APAC Building Energy Management Systems Market Revenue (Million), by End-user Application 2024 & 2032
- Figure 51: Asia Pacific APAC Building Energy Management Systems Market Revenue Share (%), by End-user Application 2024 & 2032
- Figure 52: Asia Pacific APAC Building Energy Management Systems Market Revenue (Million), by Country 2024 & 2032
- Figure 53: Asia Pacific APAC Building Energy Management Systems Market Revenue Share (%), by Country 2024 & 2032
List of Tables
- Table 1: Global APAC Building Energy Management Systems Market Revenue Million Forecast, by Region 2019 & 2032
- Table 2: Global APAC Building Energy Management Systems Market Revenue Million Forecast, by Type of Solution 2019 & 2032
- Table 3: Global APAC Building Energy Management Systems Market Revenue Million Forecast, by Distribution Channel 2019 & 2032
- Table 4: Global APAC Building Energy Management Systems Market Revenue Million Forecast, by End-user Application 2019 & 2032
- Table 5: Global APAC Building Energy Management Systems Market Revenue Million Forecast, by Region 2019 & 2032
- Table 6: Global APAC Building Energy Management Systems Market Revenue Million Forecast, by Country 2019 & 2032
- Table 7: United States APAC Building Energy Management Systems Market Revenue (Million) Forecast, by Application 2019 & 2032
- Table 8: Canada APAC Building Energy Management Systems Market Revenue (Million) Forecast, by Application 2019 & 2032
- Table 9: Global APAC Building Energy Management Systems Market Revenue Million Forecast, by Country 2019 & 2032
- Table 10: United Kingdom APAC Building Energy Management Systems Market Revenue (Million) Forecast, by Application 2019 & 2032
- Table 11: Germany APAC Building Energy Management Systems Market Revenue (Million) Forecast, by Application 2019 & 2032
- Table 12: France APAC Building Energy Management Systems Market Revenue (Million) Forecast, by Application 2019 & 2032
- Table 13: Benelux APAC Building Energy Management Systems Market Revenue (Million) Forecast, by Application 2019 & 2032
- Table 14: Rest of Europe APAC Building Energy Management Systems Market Revenue (Million) Forecast, by Application 2019 & 2032
- Table 15: Global APAC Building Energy Management Systems Market Revenue Million Forecast, by Country 2019 & 2032
- Table 16: China APAC Building Energy Management Systems Market Revenue (Million) Forecast, by Application 2019 & 2032
- Table 17: India APAC Building Energy Management Systems Market Revenue (Million) Forecast, by Application 2019 & 2032
- Table 18: Japan APAC Building Energy Management Systems Market Revenue (Million) Forecast, by Application 2019 & 2032
- Table 19: Rest of Asia Pacific APAC Building Energy Management Systems Market Revenue (Million) Forecast, by Application 2019 & 2032
- Table 20: Global APAC Building Energy Management Systems Market Revenue Million Forecast, by Country 2019 & 2032
- Table 21: Brazil APAC Building Energy Management Systems Market Revenue (Million) Forecast, by Application 2019 & 2032
- Table 22: Argentina APAC Building Energy Management Systems Market Revenue (Million) Forecast, by Application 2019 & 2032
- Table 23: Mexico APAC Building Energy Management Systems Market Revenue (Million) Forecast, by Application 2019 & 2032
- Table 24: Rest of Latin America APAC Building Energy Management Systems Market Revenue (Million) Forecast, by Application 2019 & 2032
- Table 25: Global APAC Building Energy Management Systems Market Revenue Million Forecast, by Country 2019 & 2032
- Table 26: APAC Building Energy Management Systems Market Revenue (Million) Forecast, by Application 2019 & 2032
- Table 27: Global APAC Building Energy Management Systems Market Revenue Million Forecast, by Country 2019 & 2032
- Table 28: Saudi Arabia APAC Building Energy Management Systems Market Revenue (Million) Forecast, by Application 2019 & 2032
- Table 29: South Africa APAC Building Energy Management Systems Market Revenue (Million) Forecast, by Application 2019 & 2032
- Table 30: Rest of Middle East APAC Building Energy Management Systems Market Revenue (Million) Forecast, by Application 2019 & 2032
- Table 31: Global APAC Building Energy Management Systems Market Revenue Million Forecast, by Type of Solution 2019 & 2032
- Table 32: Global APAC Building Energy Management Systems Market Revenue Million Forecast, by Distribution Channel 2019 & 2032
- Table 33: Global APAC Building Energy Management Systems Market Revenue Million Forecast, by End-user Application 2019 & 2032
- Table 34: Global APAC Building Energy Management Systems Market Revenue Million Forecast, by Country 2019 & 2032
- Table 35: United States APAC Building Energy Management Systems Market Revenue (Million) Forecast, by Application 2019 & 2032
- Table 36: Canada APAC Building Energy Management Systems Market Revenue (Million) Forecast, by Application 2019 & 2032
- Table 37: Mexico APAC Building Energy Management Systems Market Revenue (Million) Forecast, by Application 2019 & 2032
- Table 38: Global APAC Building Energy Management Systems Market Revenue Million Forecast, by Type of Solution 2019 & 2032
- Table 39: Global APAC Building Energy Management Systems Market Revenue Million Forecast, by Distribution Channel 2019 & 2032
- Table 40: Global APAC Building Energy Management Systems Market Revenue Million Forecast, by End-user Application 2019 & 2032
- Table 41: Global APAC Building Energy Management Systems Market Revenue Million Forecast, by Country 2019 & 2032
- Table 42: Brazil APAC Building Energy Management Systems Market Revenue (Million) Forecast, by Application 2019 & 2032
- Table 43: Argentina APAC Building Energy Management Systems Market Revenue (Million) Forecast, by Application 2019 & 2032
- Table 44: Rest of South America APAC Building Energy Management Systems Market Revenue (Million) Forecast, by Application 2019 & 2032
- Table 45: Global APAC Building Energy Management Systems Market Revenue Million Forecast, by Type of Solution 2019 & 2032
- Table 46: Global APAC Building Energy Management Systems Market Revenue Million Forecast, by Distribution Channel 2019 & 2032
- Table 47: Global APAC Building Energy Management Systems Market Revenue Million Forecast, by End-user Application 2019 & 2032
- Table 48: Global APAC Building Energy Management Systems Market Revenue Million Forecast, by Country 2019 & 2032
- Table 49: United Kingdom APAC Building Energy Management Systems Market Revenue (Million) Forecast, by Application 2019 & 2032
- Table 50: Germany APAC Building Energy Management Systems Market Revenue (Million) Forecast, by Application 2019 & 2032
- Table 51: France APAC Building Energy Management Systems Market Revenue (Million) Forecast, by Application 2019 & 2032
- Table 52: Italy APAC Building Energy Management Systems Market Revenue (Million) Forecast, by Application 2019 & 2032
- Table 53: Spain APAC Building Energy Management Systems Market Revenue (Million) Forecast, by Application 2019 & 2032
- Table 54: Russia APAC Building Energy Management Systems Market Revenue (Million) Forecast, by Application 2019 & 2032
- Table 55: Benelux APAC Building Energy Management Systems Market Revenue (Million) Forecast, by Application 2019 & 2032
- Table 56: Nordics APAC Building Energy Management Systems Market Revenue (Million) Forecast, by Application 2019 & 2032
- Table 57: Rest of Europe APAC Building Energy Management Systems Market Revenue (Million) Forecast, by Application 2019 & 2032
- Table 58: Global APAC Building Energy Management Systems Market Revenue Million Forecast, by Type of Solution 2019 & 2032
- Table 59: Global APAC Building Energy Management Systems Market Revenue Million Forecast, by Distribution Channel 2019 & 2032
- Table 60: Global APAC Building Energy Management Systems Market Revenue Million Forecast, by End-user Application 2019 & 2032
- Table 61: Global APAC Building Energy Management Systems Market Revenue Million Forecast, by Country 2019 & 2032
- Table 62: Turkey APAC Building Energy Management Systems Market Revenue (Million) Forecast, by Application 2019 & 2032
- Table 63: Israel APAC Building Energy Management Systems Market Revenue (Million) Forecast, by Application 2019 & 2032
- Table 64: GCC APAC Building Energy Management Systems Market Revenue (Million) Forecast, by Application 2019 & 2032
- Table 65: North Africa APAC Building Energy Management Systems Market Revenue (Million) Forecast, by Application 2019 & 2032
- Table 66: South Africa APAC Building Energy Management Systems Market Revenue (Million) Forecast, by Application 2019 & 2032
- Table 67: Rest of Middle East & Africa APAC Building Energy Management Systems Market Revenue (Million) Forecast, by Application 2019 & 2032
- Table 68: Global APAC Building Energy Management Systems Market Revenue Million Forecast, by Type of Solution 2019 & 2032
- Table 69: Global APAC Building Energy Management Systems Market Revenue Million Forecast, by Distribution Channel 2019 & 2032
- Table 70: Global APAC Building Energy Management Systems Market Revenue Million Forecast, by End-user Application 2019 & 2032
- Table 71: Global APAC Building Energy Management Systems Market Revenue Million Forecast, by Country 2019 & 2032
- Table 72: China APAC Building Energy Management Systems Market Revenue (Million) Forecast, by Application 2019 & 2032
- Table 73: India APAC Building Energy Management Systems Market Revenue (Million) Forecast, by Application 2019 & 2032
- Table 74: Japan APAC Building Energy Management Systems Market Revenue (Million) Forecast, by Application 2019 & 2032
- Table 75: South Korea APAC Building Energy Management Systems Market Revenue (Million) Forecast, by Application 2019 & 2032
- Table 76: ASEAN APAC Building Energy Management Systems Market Revenue (Million) Forecast, by Application 2019 & 2032
- Table 77: Oceania APAC Building Energy Management Systems Market Revenue (Million) Forecast, by Application 2019 & 2032
- Table 78: Rest of Asia Pacific APAC Building Energy Management Systems Market Revenue (Million) Forecast, by Application 2019 & 2032
Frequently Asked Questions
1. What is the projected Compound Annual Growth Rate (CAGR) of the APAC Building Energy Management Systems Market?
The projected CAGR is approximately 12.30%.
2. Which companies are prominent players in the APAC Building Energy Management Systems Market?
Key companies in the market include Honeywell, Building IQ*List Not Exhaustive, Siemens, Johnson Controls, Trane, Schneider Electric, ABB.
3. What are the main segments of the APAC Building Energy Management Systems Market?
The market segments include Type of Solution, Distribution Channel, End-user Application.
4. Can you provide details about the market size?
The market size is estimated to be USD XX Million as of 2022.
5. What are some drivers contributing to market growth?
Rapid Growing Numbe of End-users; Low Manufacturing Costs.
6. What are the notable trends driving market growth?
The Increase in Demand from the Residential Segment is Expected to Drive the Market.
7. Are there any restraints impacting market growth?
Technical Difficulties.
8. Can you provide examples of recent developments in the market?
August 2022 - Johnson Controls, a global player providing smart, healthy, and sustainable buildings, announced that it partnered with Microsoft Beijing Campus for its ongoing retrofit and optimization of building operations, achieving 27.9% energy savings and ensuring critical equipment uptime to 98%. As a result, the campus has been granted an energy-saving endorsement and financial subsidy by the Beijing Municipal Government and the Haidian District Government.
9. What pricing options are available for accessing the report?
Pricing options include single-user, multi-user, and enterprise licenses priced at USD 4750, USD 4950, and USD 6800 respectively.
10. Is the market size provided in terms of value or volume?
The market size is provided in terms of value, measured in Million.
11. Are there any specific market keywords associated with the report?
Yes, the market keyword associated with the report is "APAC Building Energy Management Systems Market," which aids in identifying and referencing the specific market segment covered.
12. How do I determine which pricing option suits my needs best?
The pricing options vary based on user requirements and access needs. Individual users may opt for single-user licenses, while businesses requiring broader access may choose multi-user or enterprise licenses for cost-effective access to the report.
13. Are there any additional resources or data provided in the APAC Building Energy Management Systems Market report?
While the report offers comprehensive insights, it's advisable to review the specific contents or supplementary materials provided to ascertain if additional resources or data are available.
14. How can I stay updated on further developments or reports in the APAC Building Energy Management Systems Market?
To stay informed about further developments, trends, and reports in the APAC Building Energy Management Systems Market, consider subscribing to industry newsletters, following relevant companies and organizations, or regularly checking reputable industry news sources and publications.
Methodology
Step 1 - Identification of Relevant Samples Size from Population Database


Step 2 - Approaches for Defining Global Market Size (Value, Volume* & Price*)

Note*: In applicable scenarios
Step 3 - Data Sources
Primary Research
- Web Analytics
- Survey Reports
- Research Institute
- Latest Research Reports
- Opinion Leaders
Secondary Research
- Annual Reports
- White Paper
- Latest Press Release
- Industry Association
- Paid Database
- Investor Presentations

Step 4 - Data Triangulation
Involves using different sources of information in order to increase the validity of a study
These sources are likely to be stakeholders in a program - participants, other researchers, program staff, other community members, and so on.
Then we put all data in single framework & apply various statistical tools to find out the dynamic on the market.
During the analysis stage, feedback from the stakeholder groups would be compared to determine areas of agreement as well as areas of divergence
