

Key Insights
The Asia-Pacific (APAC) aviation fuel market is experiencing robust growth, driven by a surge in air passenger traffic and the expansion of low-cost carriers across the region. This burgeoning demand, coupled with increasing tourism and economic development in countries like India, China, and Southeast Asia, is fueling significant market expansion. The market is segmented by fuel type (Air Turbine Fuel (ATF), Aviation Biofuel, and Others) and application (Commercial Aircraft, Military Aircraft, and General Aviation). While ATF currently dominates, the adoption of sustainable aviation biofuels is steadily increasing, driven by environmental concerns and government regulations promoting greener aviation. The region's diverse economic landscape contributes to varied growth rates across its sub-regions, with strong growth anticipated in Southeast Asia and India, partly fueled by their rapid economic expansion and rising disposable incomes. The growth is however, tempered by factors such as fluctuating crude oil prices and geopolitical instability, impacting fuel costs and supply chain resilience. Major players in the market include established international oil companies and regional fuel suppliers, engaging in strategic partnerships and investments to capture market share in this rapidly expanding sector.
Further fueling the APAC aviation fuel market’s expansion are government initiatives focused on improving airport infrastructure and air connectivity. These improvements make air travel more accessible and affordable, encouraging further growth in passenger numbers and, consequently, fuel demand. The increasing adoption of fuel-efficient aircraft technologies also plays a role, but this is often offset by increasing aircraft size and frequency of flights. Competition among fuel suppliers remains intense, with companies focusing on price competitiveness, reliable supply chains, and innovative solutions like the increasing adoption of blended biofuels. However, challenges remain, including infrastructure limitations in certain regions and the need for consistent regulatory frameworks supporting the development and deployment of sustainable aviation fuels to meet the rising demands of the aviation industry across APAC. The market's future trajectory hinges on the successful navigation of these challenges and the continued growth of air travel within the region.
APAC Aviation Fuel Industry: 2019-2033 Market Forecast & Analysis - Comprehensive Report
Unlock the potential of the booming APAC aviation fuel market with this in-depth report, providing a comprehensive analysis from 2019-2033. This essential resource offers crucial insights into market dynamics, growth drivers, competitive landscapes, and future opportunities across various segments including Air Turbine Fuel (ATF), Aviation Biofuel, and others, catering to Commercial, Military, and General Aviation applications. This report projects a market valued at xx Million by 2025 and xx Million by 2033. Benefit from actionable data and strategic recommendations to navigate the evolving APAC aviation fuel landscape.
APAC Aviation Fuel Industry Market Dynamics & Concentration
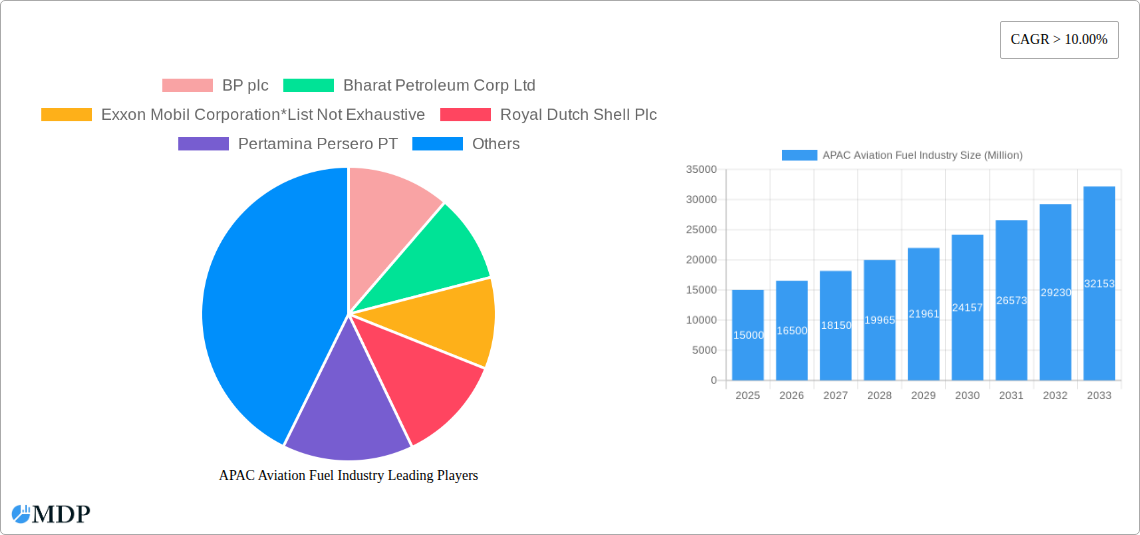
The APAC aviation fuel market exhibits a moderately concentrated structure, with key players like BP plc, Bharat Petroleum Corp Ltd, Exxon Mobil Corporation, Royal Dutch Shell Plc, Pertamina Persero PT, Chevron Corporation, World Fuel Services Corp, Petronas Aviation Sdn Bhd, China Aviation Oil Corporation Ltd, and Vitol Holding BV holding significant market share. However, the presence of numerous regional players contributes to competitive intensity. The market's dynamics are shaped by several factors:
- Market Concentration: The top 10 players hold approximately xx% of the market share in 2025, with a projected xx% by 2033.
- Innovation Drivers: Investment in sustainable aviation fuels (SAFs) and technological advancements in fuel efficiency drive innovation.
- Regulatory Frameworks: Stringent emission regulations and evolving safety standards significantly influence market operations and fuel specifications.
- Product Substitutes: The emergence of biofuels and other alternative fuels poses a potential threat to traditional ATF.
- End-User Trends: Growth in air travel, particularly in the Asia-Pacific region, fuels demand, while fluctuating fuel prices and airline consolidation affect market stability.
- M&A Activities: The number of mergers and acquisitions in the sector has increased by xx% since 2019, reflecting strategic consolidation and market expansion efforts.
APAC Aviation Fuel Industry Industry Trends & Analysis
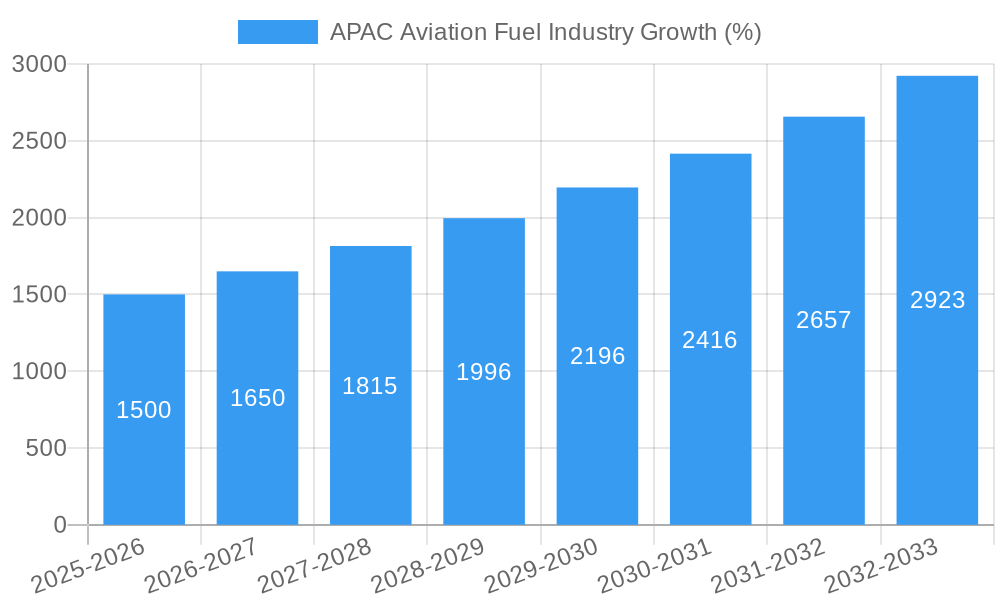
The APAC aviation fuel market is experiencing robust growth, driven primarily by the region's burgeoning air travel sector and increasing economic activity. The Compound Annual Growth Rate (CAGR) during the forecast period (2025-2033) is projected at xx%. Key market trends include:
- Market Growth Drivers: Rapid urbanization, rising disposable incomes, and expanding tourism contribute significantly to air passenger growth, boosting fuel demand. Increased government investment in aviation infrastructure further fuels market expansion.
- Technological Disruptions: The introduction of more fuel-efficient aircraft and the ongoing development of sustainable aviation fuels (SAFs) are transforming the industry, enhancing sustainability while impacting fuel consumption patterns.
- Consumer Preferences: Growing awareness of environmental concerns is driving demand for SAFs, pushing airlines and fuel suppliers to adopt eco-friendly solutions. Market penetration of SAFs is projected to reach xx% by 2033.
- Competitive Dynamics: The market features a mix of global majors and regional players, resulting in intense competition, particularly in pricing and service offerings.
Leading Markets & Segments in APAC Aviation Fuel Industry
China and India are the leading markets in the APAC aviation fuel industry, driven by their massive population, rapid economic growth, and expanding aviation infrastructure. Within fuel types, Air Turbine Fuel (ATF) dominates, representing xx% of the market in 2025.
Key Drivers:
- China: Strong economic growth, expanding air travel, and robust government investment in aviation infrastructure.
- India: Rapid economic development, increasing air passenger traffic, and government initiatives to enhance air connectivity.
Segment Dominance:
- Fuel Type: Air Turbine Fuel (ATF) maintains a commanding lead due to its widespread use in commercial and military aviation. Aviation biofuel is showing promising growth, but its market share remains relatively small.
- Application: Commercial aircraft accounts for the largest segment, followed by military and general aviation. The commercial segment is influenced by fluctuating passenger numbers and airline operational efficiency.
APAP Aviation Fuel Industry Product Developments
Recent innovations in aviation fuels primarily focus on developing sustainable and environmentally friendly alternatives to traditional ATF. The development and implementation of SAFs are gaining traction, driven by environmental regulations and consumer demand for sustainable travel. Technological advancements in fuel additives and blending techniques aim to improve fuel efficiency and reduce emissions. The emphasis is on creating sustainable options that meet stringent regulatory requirements while delivering comparable performance to conventional fuels.
Key Drivers of APAP Aviation Fuel Industry Growth
The APAC aviation fuel industry's growth is propelled by:
- Technological advancements: The introduction of fuel-efficient aircraft and sustainable aviation fuels (SAFs) is increasing market efficiency and reducing environmental impact.
- Economic growth: Rapid economic expansion in many APAC nations, leading to increased air travel demand and higher fuel consumption.
- Favorable regulatory environment: Governments are investing in aviation infrastructure and implementing policies to support the growth of the aviation sector, indirectly supporting the fuel market.
Challenges in the APAP Aviation Fuel Industry Market
Significant challenges impacting the APAC aviation fuel market include:
- Regulatory hurdles: Stringent emission regulations and evolving safety standards necessitate substantial investment in compliance and technological upgrades.
- Supply chain disruptions: Geopolitical events, natural disasters, and logistical complexities can cause supply chain disruptions, leading to fuel price volatility. These disruptions caused a xx% increase in fuel prices in 2022.
- Intense competition: The presence of numerous global and regional players creates an intensely competitive environment.
Emerging Opportunities in APAP Aviation Fuel Industry
The market presents significant long-term growth opportunities fueled by:
- Technological breakthroughs: Continuous advancements in SAF technology offer promising avenues for sustainable growth and market expansion.
- Strategic partnerships: Collaboration between fuel suppliers, airlines, and technology providers fosters innovation and enhances market efficiency.
- Market expansion strategies: Expanding into emerging markets with developing aviation sectors presents significant growth potential.
Leading Players in the APAC Aviation Fuel Industry Sector
- BP plc
- Bharat Petroleum Corp Ltd
- Exxon Mobil Corporation
- Royal Dutch Shell Plc
- Pertamina Persero PT
- Chevron Corporation
- World Fuel Services Corp
- Petronas Aviation Sdn Bhd
- China Aviation Oil Corporation Ltd
- Vitol Holding BV
Key Milestones in APAC Aviation Fuel Industry Industry
- 2020: Several airlines committed to using SAFs, driving demand and investment in alternative fuel technologies.
- 2021: Implementation of stricter emission standards in several APAC countries, pushing for innovation in fuel efficiency and sustainable solutions.
- 2022: Increased M&A activity among fuel suppliers, reflecting strategic consolidation within the industry.
- 2023: Significant investment in the development and deployment of SAF infrastructure throughout the region.
Strategic Outlook for APAC Aviation Fuel Industry Market
The APAC aviation fuel market is poised for substantial growth over the next decade. Strategic opportunities lie in investing in SAF technologies, forging strategic partnerships to enhance supply chain efficiency, and capitalizing on the expanding air travel market within the region. The focus on sustainability and reducing carbon emissions will continue to shape the future of the industry, creating opportunities for innovative players to gain market share and drive future growth.
APAC Aviation Fuel Industry Segmentation
-
1. Fuel Type
- 1.1. Air Turbine Fuel (ATF)
- 1.2. Aviation Biofuel
- 1.3. Others
-
2. Application
- 2.1. Commercial Aircraft
- 2.2. Military Aircraft
- 2.3. General Aviation
-
3. Geography
- 3.1. China
- 3.2. Japan
- 3.3. India
- 3.4. Indonesia
- 3.5. Australia
- 3.6. Rest of Asia-Pacific
APAC Aviation Fuel Industry Segmentation By Geography
- 1. China
- 2. Japan
- 3. India
- 4. Indonesia
- 5. Australia
- 6. Rest of Asia Pacific
APAC Aviation Fuel Industry REPORT HIGHLIGHTS
| Aspects | Details |
|---|---|
| Study Period | 2019-2033 |
| Base Year | 2024 |
| Estimated Year | 2025 |
| Forecast Period | 2025-2033 |
| Historical Period | 2019-2024 |
| Growth Rate | CAGR of > 10.00% from 2019-2033 |
| Segmentation |
|
Table of Contents
- 1. Introduction
- 1.1. Research Scope
- 1.2. Market Segmentation
- 1.3. Research Methodology
- 1.4. Definitions and Assumptions
- 2. Executive Summary
- 2.1. Introduction
- 3. Market Dynamics
- 3.1. Introduction
- 3.2. Market Drivers
- 3.2.1. 4.; Increase in Prices of Electricity Procured from Conventional Mechanisms 4.; Decline in Cost of Solar Energy Infrastructure
- 3.3. Market Restrains
- 3.3.1. 4.; Competition from Other Alternative Energy Sources
- 3.4. Market Trends
- 3.4.1. Commercial Aircraft Segment to Dominate the Market
- 4. Market Factor Analysis
- 4.1. Porters Five Forces
- 4.2. Supply/Value Chain
- 4.3. PESTEL analysis
- 4.4. Market Entropy
- 4.5. Patent/Trademark Analysis
- 5. Global APAC Aviation Fuel Industry Analysis, Insights and Forecast, 2019-2031
- 5.1. Market Analysis, Insights and Forecast - by Fuel Type
- 5.1.1. Air Turbine Fuel (ATF)
- 5.1.2. Aviation Biofuel
- 5.1.3. Others
- 5.2. Market Analysis, Insights and Forecast - by Application
- 5.2.1. Commercial Aircraft
- 5.2.2. Military Aircraft
- 5.2.3. General Aviation
- 5.3. Market Analysis, Insights and Forecast - by Geography
- 5.3.1. China
- 5.3.2. Japan
- 5.3.3. India
- 5.3.4. Indonesia
- 5.3.5. Australia
- 5.3.6. Rest of Asia-Pacific
- 5.4. Market Analysis, Insights and Forecast - by Region
- 5.4.1. China
- 5.4.2. Japan
- 5.4.3. India
- 5.4.4. Indonesia
- 5.4.5. Australia
- 5.4.6. Rest of Asia Pacific
- 5.1. Market Analysis, Insights and Forecast - by Fuel Type
- 6. China APAC Aviation Fuel Industry Analysis, Insights and Forecast, 2019-2031
- 6.1. Market Analysis, Insights and Forecast - by Fuel Type
- 6.1.1. Air Turbine Fuel (ATF)
- 6.1.2. Aviation Biofuel
- 6.1.3. Others
- 6.2. Market Analysis, Insights and Forecast - by Application
- 6.2.1. Commercial Aircraft
- 6.2.2. Military Aircraft
- 6.2.3. General Aviation
- 6.3. Market Analysis, Insights and Forecast - by Geography
- 6.3.1. China
- 6.3.2. Japan
- 6.3.3. India
- 6.3.4. Indonesia
- 6.3.5. Australia
- 6.3.6. Rest of Asia-Pacific
- 6.1. Market Analysis, Insights and Forecast - by Fuel Type
- 7. Japan APAC Aviation Fuel Industry Analysis, Insights and Forecast, 2019-2031
- 7.1. Market Analysis, Insights and Forecast - by Fuel Type
- 7.1.1. Air Turbine Fuel (ATF)
- 7.1.2. Aviation Biofuel
- 7.1.3. Others
- 7.2. Market Analysis, Insights and Forecast - by Application
- 7.2.1. Commercial Aircraft
- 7.2.2. Military Aircraft
- 7.2.3. General Aviation
- 7.3. Market Analysis, Insights and Forecast - by Geography
- 7.3.1. China
- 7.3.2. Japan
- 7.3.3. India
- 7.3.4. Indonesia
- 7.3.5. Australia
- 7.3.6. Rest of Asia-Pacific
- 7.1. Market Analysis, Insights and Forecast - by Fuel Type
- 8. India APAC Aviation Fuel Industry Analysis, Insights and Forecast, 2019-2031
- 8.1. Market Analysis, Insights and Forecast - by Fuel Type
- 8.1.1. Air Turbine Fuel (ATF)
- 8.1.2. Aviation Biofuel
- 8.1.3. Others
- 8.2. Market Analysis, Insights and Forecast - by Application
- 8.2.1. Commercial Aircraft
- 8.2.2. Military Aircraft
- 8.2.3. General Aviation
- 8.3. Market Analysis, Insights and Forecast - by Geography
- 8.3.1. China
- 8.3.2. Japan
- 8.3.3. India
- 8.3.4. Indonesia
- 8.3.5. Australia
- 8.3.6. Rest of Asia-Pacific
- 8.1. Market Analysis, Insights and Forecast - by Fuel Type
- 9. Indonesia APAC Aviation Fuel Industry Analysis, Insights and Forecast, 2019-2031
- 9.1. Market Analysis, Insights and Forecast - by Fuel Type
- 9.1.1. Air Turbine Fuel (ATF)
- 9.1.2. Aviation Biofuel
- 9.1.3. Others
- 9.2. Market Analysis, Insights and Forecast - by Application
- 9.2.1. Commercial Aircraft
- 9.2.2. Military Aircraft
- 9.2.3. General Aviation
- 9.3. Market Analysis, Insights and Forecast - by Geography
- 9.3.1. China
- 9.3.2. Japan
- 9.3.3. India
- 9.3.4. Indonesia
- 9.3.5. Australia
- 9.3.6. Rest of Asia-Pacific
- 9.1. Market Analysis, Insights and Forecast - by Fuel Type
- 10. Australia APAC Aviation Fuel Industry Analysis, Insights and Forecast, 2019-2031
- 10.1. Market Analysis, Insights and Forecast - by Fuel Type
- 10.1.1. Air Turbine Fuel (ATF)
- 10.1.2. Aviation Biofuel
- 10.1.3. Others
- 10.2. Market Analysis, Insights and Forecast - by Application
- 10.2.1. Commercial Aircraft
- 10.2.2. Military Aircraft
- 10.2.3. General Aviation
- 10.3. Market Analysis, Insights and Forecast - by Geography
- 10.3.1. China
- 10.3.2. Japan
- 10.3.3. India
- 10.3.4. Indonesia
- 10.3.5. Australia
- 10.3.6. Rest of Asia-Pacific
- 10.1. Market Analysis, Insights and Forecast - by Fuel Type
- 11. Rest of Asia Pacific APAC Aviation Fuel Industry Analysis, Insights and Forecast, 2019-2031
- 11.1. Market Analysis, Insights and Forecast - by Fuel Type
- 11.1.1. Air Turbine Fuel (ATF)
- 11.1.2. Aviation Biofuel
- 11.1.3. Others
- 11.2. Market Analysis, Insights and Forecast - by Application
- 11.2.1. Commercial Aircraft
- 11.2.2. Military Aircraft
- 11.2.3. General Aviation
- 11.3. Market Analysis, Insights and Forecast - by Geography
- 11.3.1. China
- 11.3.2. Japan
- 11.3.3. India
- 11.3.4. Indonesia
- 11.3.5. Australia
- 11.3.6. Rest of Asia-Pacific
- 11.1. Market Analysis, Insights and Forecast - by Fuel Type
- 12. North America APAC Aviation Fuel Industry Analysis, Insights and Forecast, 2019-2031
- 12.1. Market Analysis, Insights and Forecast - By Country/Sub-region
- 12.1.1 United States
- 12.1.2 Canada
- 12.1.3 Mexico
- 13. Europe APAC Aviation Fuel Industry Analysis, Insights and Forecast, 2019-2031
- 13.1. Market Analysis, Insights and Forecast - By Country/Sub-region
- 13.1.1 Germany
- 13.1.2 United Kingdom
- 13.1.3 France
- 13.1.4 Spain
- 13.1.5 Italy
- 13.1.6 Spain
- 13.1.7 Belgium
- 13.1.8 Netherland
- 13.1.9 Nordics
- 13.1.10 Rest of Europe
- 14. Asia Pacific APAC Aviation Fuel Industry Analysis, Insights and Forecast, 2019-2031
- 14.1. Market Analysis, Insights and Forecast - By Country/Sub-region
- 14.1.1 China
- 14.1.2 Japan
- 14.1.3 India
- 14.1.4 South Korea
- 14.1.5 Southeast Asia
- 14.1.6 Australia
- 14.1.7 Indonesia
- 14.1.8 Phillipes
- 14.1.9 Singapore
- 14.1.10 Thailandc
- 14.1.11 Rest of Asia Pacific
- 15. South America APAC Aviation Fuel Industry Analysis, Insights and Forecast, 2019-2031
- 15.1. Market Analysis, Insights and Forecast - By Country/Sub-region
- 15.1.1 Brazil
- 15.1.2 Argentina
- 15.1.3 Peru
- 15.1.4 Chile
- 15.1.5 Colombia
- 15.1.6 Ecuador
- 15.1.7 Venezuela
- 15.1.8 Rest of South America
- 16. North America APAC Aviation Fuel Industry Analysis, Insights and Forecast, 2019-2031
- 16.1. Market Analysis, Insights and Forecast - By Country/Sub-region
- 16.1.1 United States
- 16.1.2 Canada
- 16.1.3 Mexico
- 17. MEA APAC Aviation Fuel Industry Analysis, Insights and Forecast, 2019-2031
- 17.1. Market Analysis, Insights and Forecast - By Country/Sub-region
- 17.1.1 United Arab Emirates
- 17.1.2 Saudi Arabia
- 17.1.3 South Africa
- 17.1.4 Rest of Middle East and Africa
- 18. Competitive Analysis
- 18.1. Global Market Share Analysis 2024
- 18.2. Company Profiles
- 18.2.1 BP plc
- 18.2.1.1. Overview
- 18.2.1.2. Products
- 18.2.1.3. SWOT Analysis
- 18.2.1.4. Recent Developments
- 18.2.1.5. Financials (Based on Availability)
- 18.2.2 Bharat Petroleum Corp Ltd
- 18.2.2.1. Overview
- 18.2.2.2. Products
- 18.2.2.3. SWOT Analysis
- 18.2.2.4. Recent Developments
- 18.2.2.5. Financials (Based on Availability)
- 18.2.3 Exxon Mobil Corporation*List Not Exhaustive
- 18.2.3.1. Overview
- 18.2.3.2. Products
- 18.2.3.3. SWOT Analysis
- 18.2.3.4. Recent Developments
- 18.2.3.5. Financials (Based on Availability)
- 18.2.4 Royal Dutch Shell Plc
- 18.2.4.1. Overview
- 18.2.4.2. Products
- 18.2.4.3. SWOT Analysis
- 18.2.4.4. Recent Developments
- 18.2.4.5. Financials (Based on Availability)
- 18.2.5 Pertamina Persero PT
- 18.2.5.1. Overview
- 18.2.5.2. Products
- 18.2.5.3. SWOT Analysis
- 18.2.5.4. Recent Developments
- 18.2.5.5. Financials (Based on Availability)
- 18.2.6 Chevron Corporation
- 18.2.6.1. Overview
- 18.2.6.2. Products
- 18.2.6.3. SWOT Analysis
- 18.2.6.4. Recent Developments
- 18.2.6.5. Financials (Based on Availability)
- 18.2.7 World Fuel Services Corp
- 18.2.7.1. Overview
- 18.2.7.2. Products
- 18.2.7.3. SWOT Analysis
- 18.2.7.4. Recent Developments
- 18.2.7.5. Financials (Based on Availability)
- 18.2.8 Petronas Aviation Sdn Bhd
- 18.2.8.1. Overview
- 18.2.8.2. Products
- 18.2.8.3. SWOT Analysis
- 18.2.8.4. Recent Developments
- 18.2.8.5. Financials (Based on Availability)
- 18.2.9 China Aviation Oil Corporation Ltd
- 18.2.9.1. Overview
- 18.2.9.2. Products
- 18.2.9.3. SWOT Analysis
- 18.2.9.4. Recent Developments
- 18.2.9.5. Financials (Based on Availability)
- 18.2.10 Vitol Holding BV
- 18.2.10.1. Overview
- 18.2.10.2. Products
- 18.2.10.3. SWOT Analysis
- 18.2.10.4. Recent Developments
- 18.2.10.5. Financials (Based on Availability)
- 18.2.1 BP plc
List of Figures
- Figure 1: Global APAC Aviation Fuel Industry Revenue Breakdown (Million, %) by Region 2024 & 2032
- Figure 2: Global APAC Aviation Fuel Industry Volume Breakdown (Litre, %) by Region 2024 & 2032
- Figure 3: North America APAC Aviation Fuel Industry Revenue (Million), by Country 2024 & 2032
- Figure 4: North America APAC Aviation Fuel Industry Volume (Litre), by Country 2024 & 2032
- Figure 5: North America APAC Aviation Fuel Industry Revenue Share (%), by Country 2024 & 2032
- Figure 6: North America APAC Aviation Fuel Industry Volume Share (%), by Country 2024 & 2032
- Figure 7: Europe APAC Aviation Fuel Industry Revenue (Million), by Country 2024 & 2032
- Figure 8: Europe APAC Aviation Fuel Industry Volume (Litre), by Country 2024 & 2032
- Figure 9: Europe APAC Aviation Fuel Industry Revenue Share (%), by Country 2024 & 2032
- Figure 10: Europe APAC Aviation Fuel Industry Volume Share (%), by Country 2024 & 2032
- Figure 11: Asia Pacific APAC Aviation Fuel Industry Revenue (Million), by Country 2024 & 2032
- Figure 12: Asia Pacific APAC Aviation Fuel Industry Volume (Litre), by Country 2024 & 2032
- Figure 13: Asia Pacific APAC Aviation Fuel Industry Revenue Share (%), by Country 2024 & 2032
- Figure 14: Asia Pacific APAC Aviation Fuel Industry Volume Share (%), by Country 2024 & 2032
- Figure 15: South America APAC Aviation Fuel Industry Revenue (Million), by Country 2024 & 2032
- Figure 16: South America APAC Aviation Fuel Industry Volume (Litre), by Country 2024 & 2032
- Figure 17: South America APAC Aviation Fuel Industry Revenue Share (%), by Country 2024 & 2032
- Figure 18: South America APAC Aviation Fuel Industry Volume Share (%), by Country 2024 & 2032
- Figure 19: North America APAC Aviation Fuel Industry Revenue (Million), by Country 2024 & 2032
- Figure 20: North America APAC Aviation Fuel Industry Volume (Litre), by Country 2024 & 2032
- Figure 21: North America APAC Aviation Fuel Industry Revenue Share (%), by Country 2024 & 2032
- Figure 22: North America APAC Aviation Fuel Industry Volume Share (%), by Country 2024 & 2032
- Figure 23: MEA APAC Aviation Fuel Industry Revenue (Million), by Country 2024 & 2032
- Figure 24: MEA APAC Aviation Fuel Industry Volume (Litre), by Country 2024 & 2032
- Figure 25: MEA APAC Aviation Fuel Industry Revenue Share (%), by Country 2024 & 2032
- Figure 26: MEA APAC Aviation Fuel Industry Volume Share (%), by Country 2024 & 2032
- Figure 27: China APAC Aviation Fuel Industry Revenue (Million), by Fuel Type 2024 & 2032
- Figure 28: China APAC Aviation Fuel Industry Volume (Litre), by Fuel Type 2024 & 2032
- Figure 29: China APAC Aviation Fuel Industry Revenue Share (%), by Fuel Type 2024 & 2032
- Figure 30: China APAC Aviation Fuel Industry Volume Share (%), by Fuel Type 2024 & 2032
- Figure 31: China APAC Aviation Fuel Industry Revenue (Million), by Application 2024 & 2032
- Figure 32: China APAC Aviation Fuel Industry Volume (Litre), by Application 2024 & 2032
- Figure 33: China APAC Aviation Fuel Industry Revenue Share (%), by Application 2024 & 2032
- Figure 34: China APAC Aviation Fuel Industry Volume Share (%), by Application 2024 & 2032
- Figure 35: China APAC Aviation Fuel Industry Revenue (Million), by Geography 2024 & 2032
- Figure 36: China APAC Aviation Fuel Industry Volume (Litre), by Geography 2024 & 2032
- Figure 37: China APAC Aviation Fuel Industry Revenue Share (%), by Geography 2024 & 2032
- Figure 38: China APAC Aviation Fuel Industry Volume Share (%), by Geography 2024 & 2032
- Figure 39: China APAC Aviation Fuel Industry Revenue (Million), by Country 2024 & 2032
- Figure 40: China APAC Aviation Fuel Industry Volume (Litre), by Country 2024 & 2032
- Figure 41: China APAC Aviation Fuel Industry Revenue Share (%), by Country 2024 & 2032
- Figure 42: China APAC Aviation Fuel Industry Volume Share (%), by Country 2024 & 2032
- Figure 43: Japan APAC Aviation Fuel Industry Revenue (Million), by Fuel Type 2024 & 2032
- Figure 44: Japan APAC Aviation Fuel Industry Volume (Litre), by Fuel Type 2024 & 2032
- Figure 45: Japan APAC Aviation Fuel Industry Revenue Share (%), by Fuel Type 2024 & 2032
- Figure 46: Japan APAC Aviation Fuel Industry Volume Share (%), by Fuel Type 2024 & 2032
- Figure 47: Japan APAC Aviation Fuel Industry Revenue (Million), by Application 2024 & 2032
- Figure 48: Japan APAC Aviation Fuel Industry Volume (Litre), by Application 2024 & 2032
- Figure 49: Japan APAC Aviation Fuel Industry Revenue Share (%), by Application 2024 & 2032
- Figure 50: Japan APAC Aviation Fuel Industry Volume Share (%), by Application 2024 & 2032
- Figure 51: Japan APAC Aviation Fuel Industry Revenue (Million), by Geography 2024 & 2032
- Figure 52: Japan APAC Aviation Fuel Industry Volume (Litre), by Geography 2024 & 2032
- Figure 53: Japan APAC Aviation Fuel Industry Revenue Share (%), by Geography 2024 & 2032
- Figure 54: Japan APAC Aviation Fuel Industry Volume Share (%), by Geography 2024 & 2032
- Figure 55: Japan APAC Aviation Fuel Industry Revenue (Million), by Country 2024 & 2032
- Figure 56: Japan APAC Aviation Fuel Industry Volume (Litre), by Country 2024 & 2032
- Figure 57: Japan APAC Aviation Fuel Industry Revenue Share (%), by Country 2024 & 2032
- Figure 58: Japan APAC Aviation Fuel Industry Volume Share (%), by Country 2024 & 2032
- Figure 59: India APAC Aviation Fuel Industry Revenue (Million), by Fuel Type 2024 & 2032
- Figure 60: India APAC Aviation Fuel Industry Volume (Litre), by Fuel Type 2024 & 2032
- Figure 61: India APAC Aviation Fuel Industry Revenue Share (%), by Fuel Type 2024 & 2032
- Figure 62: India APAC Aviation Fuel Industry Volume Share (%), by Fuel Type 2024 & 2032
- Figure 63: India APAC Aviation Fuel Industry Revenue (Million), by Application 2024 & 2032
- Figure 64: India APAC Aviation Fuel Industry Volume (Litre), by Application 2024 & 2032
- Figure 65: India APAC Aviation Fuel Industry Revenue Share (%), by Application 2024 & 2032
- Figure 66: India APAC Aviation Fuel Industry Volume Share (%), by Application 2024 & 2032
- Figure 67: India APAC Aviation Fuel Industry Revenue (Million), by Geography 2024 & 2032
- Figure 68: India APAC Aviation Fuel Industry Volume (Litre), by Geography 2024 & 2032
- Figure 69: India APAC Aviation Fuel Industry Revenue Share (%), by Geography 2024 & 2032
- Figure 70: India APAC Aviation Fuel Industry Volume Share (%), by Geography 2024 & 2032
- Figure 71: India APAC Aviation Fuel Industry Revenue (Million), by Country 2024 & 2032
- Figure 72: India APAC Aviation Fuel Industry Volume (Litre), by Country 2024 & 2032
- Figure 73: India APAC Aviation Fuel Industry Revenue Share (%), by Country 2024 & 2032
- Figure 74: India APAC Aviation Fuel Industry Volume Share (%), by Country 2024 & 2032
- Figure 75: Indonesia APAC Aviation Fuel Industry Revenue (Million), by Fuel Type 2024 & 2032
- Figure 76: Indonesia APAC Aviation Fuel Industry Volume (Litre), by Fuel Type 2024 & 2032
- Figure 77: Indonesia APAC Aviation Fuel Industry Revenue Share (%), by Fuel Type 2024 & 2032
- Figure 78: Indonesia APAC Aviation Fuel Industry Volume Share (%), by Fuel Type 2024 & 2032
- Figure 79: Indonesia APAC Aviation Fuel Industry Revenue (Million), by Application 2024 & 2032
- Figure 80: Indonesia APAC Aviation Fuel Industry Volume (Litre), by Application 2024 & 2032
- Figure 81: Indonesia APAC Aviation Fuel Industry Revenue Share (%), by Application 2024 & 2032
- Figure 82: Indonesia APAC Aviation Fuel Industry Volume Share (%), by Application 2024 & 2032
- Figure 83: Indonesia APAC Aviation Fuel Industry Revenue (Million), by Geography 2024 & 2032
- Figure 84: Indonesia APAC Aviation Fuel Industry Volume (Litre), by Geography 2024 & 2032
- Figure 85: Indonesia APAC Aviation Fuel Industry Revenue Share (%), by Geography 2024 & 2032
- Figure 86: Indonesia APAC Aviation Fuel Industry Volume Share (%), by Geography 2024 & 2032
- Figure 87: Indonesia APAC Aviation Fuel Industry Revenue (Million), by Country 2024 & 2032
- Figure 88: Indonesia APAC Aviation Fuel Industry Volume (Litre), by Country 2024 & 2032
- Figure 89: Indonesia APAC Aviation Fuel Industry Revenue Share (%), by Country 2024 & 2032
- Figure 90: Indonesia APAC Aviation Fuel Industry Volume Share (%), by Country 2024 & 2032
- Figure 91: Australia APAC Aviation Fuel Industry Revenue (Million), by Fuel Type 2024 & 2032
- Figure 92: Australia APAC Aviation Fuel Industry Volume (Litre), by Fuel Type 2024 & 2032
- Figure 93: Australia APAC Aviation Fuel Industry Revenue Share (%), by Fuel Type 2024 & 2032
- Figure 94: Australia APAC Aviation Fuel Industry Volume Share (%), by Fuel Type 2024 & 2032
- Figure 95: Australia APAC Aviation Fuel Industry Revenue (Million), by Application 2024 & 2032
- Figure 96: Australia APAC Aviation Fuel Industry Volume (Litre), by Application 2024 & 2032
- Figure 97: Australia APAC Aviation Fuel Industry Revenue Share (%), by Application 2024 & 2032
- Figure 98: Australia APAC Aviation Fuel Industry Volume Share (%), by Application 2024 & 2032
- Figure 99: Australia APAC Aviation Fuel Industry Revenue (Million), by Geography 2024 & 2032
- Figure 100: Australia APAC Aviation Fuel Industry Volume (Litre), by Geography 2024 & 2032
- Figure 101: Australia APAC Aviation Fuel Industry Revenue Share (%), by Geography 2024 & 2032
- Figure 102: Australia APAC Aviation Fuel Industry Volume Share (%), by Geography 2024 & 2032
- Figure 103: Australia APAC Aviation Fuel Industry Revenue (Million), by Country 2024 & 2032
- Figure 104: Australia APAC Aviation Fuel Industry Volume (Litre), by Country 2024 & 2032
- Figure 105: Australia APAC Aviation Fuel Industry Revenue Share (%), by Country 2024 & 2032
- Figure 106: Australia APAC Aviation Fuel Industry Volume Share (%), by Country 2024 & 2032
- Figure 107: Rest of Asia Pacific APAC Aviation Fuel Industry Revenue (Million), by Fuel Type 2024 & 2032
- Figure 108: Rest of Asia Pacific APAC Aviation Fuel Industry Volume (Litre), by Fuel Type 2024 & 2032
- Figure 109: Rest of Asia Pacific APAC Aviation Fuel Industry Revenue Share (%), by Fuel Type 2024 & 2032
- Figure 110: Rest of Asia Pacific APAC Aviation Fuel Industry Volume Share (%), by Fuel Type 2024 & 2032
- Figure 111: Rest of Asia Pacific APAC Aviation Fuel Industry Revenue (Million), by Application 2024 & 2032
- Figure 112: Rest of Asia Pacific APAC Aviation Fuel Industry Volume (Litre), by Application 2024 & 2032
- Figure 113: Rest of Asia Pacific APAC Aviation Fuel Industry Revenue Share (%), by Application 2024 & 2032
- Figure 114: Rest of Asia Pacific APAC Aviation Fuel Industry Volume Share (%), by Application 2024 & 2032
- Figure 115: Rest of Asia Pacific APAC Aviation Fuel Industry Revenue (Million), by Geography 2024 & 2032
- Figure 116: Rest of Asia Pacific APAC Aviation Fuel Industry Volume (Litre), by Geography 2024 & 2032
- Figure 117: Rest of Asia Pacific APAC Aviation Fuel Industry Revenue Share (%), by Geography 2024 & 2032
- Figure 118: Rest of Asia Pacific APAC Aviation Fuel Industry Volume Share (%), by Geography 2024 & 2032
- Figure 119: Rest of Asia Pacific APAC Aviation Fuel Industry Revenue (Million), by Country 2024 & 2032
- Figure 120: Rest of Asia Pacific APAC Aviation Fuel Industry Volume (Litre), by Country 2024 & 2032
- Figure 121: Rest of Asia Pacific APAC Aviation Fuel Industry Revenue Share (%), by Country 2024 & 2032
- Figure 122: Rest of Asia Pacific APAC Aviation Fuel Industry Volume Share (%), by Country 2024 & 2032
List of Tables
- Table 1: Global APAC Aviation Fuel Industry Revenue Million Forecast, by Region 2019 & 2032
- Table 2: Global APAC Aviation Fuel Industry Volume Litre Forecast, by Region 2019 & 2032
- Table 3: Global APAC Aviation Fuel Industry Revenue Million Forecast, by Fuel Type 2019 & 2032
- Table 4: Global APAC Aviation Fuel Industry Volume Litre Forecast, by Fuel Type 2019 & 2032
- Table 5: Global APAC Aviation Fuel Industry Revenue Million Forecast, by Application 2019 & 2032
- Table 6: Global APAC Aviation Fuel Industry Volume Litre Forecast, by Application 2019 & 2032
- Table 7: Global APAC Aviation Fuel Industry Revenue Million Forecast, by Geography 2019 & 2032
- Table 8: Global APAC Aviation Fuel Industry Volume Litre Forecast, by Geography 2019 & 2032
- Table 9: Global APAC Aviation Fuel Industry Revenue Million Forecast, by Region 2019 & 2032
- Table 10: Global APAC Aviation Fuel Industry Volume Litre Forecast, by Region 2019 & 2032
- Table 11: Global APAC Aviation Fuel Industry Revenue Million Forecast, by Country 2019 & 2032
- Table 12: Global APAC Aviation Fuel Industry Volume Litre Forecast, by Country 2019 & 2032
- Table 13: United States APAC Aviation Fuel Industry Revenue (Million) Forecast, by Application 2019 & 2032
- Table 14: United States APAC Aviation Fuel Industry Volume (Litre) Forecast, by Application 2019 & 2032
- Table 15: Canada APAC Aviation Fuel Industry Revenue (Million) Forecast, by Application 2019 & 2032
- Table 16: Canada APAC Aviation Fuel Industry Volume (Litre) Forecast, by Application 2019 & 2032
- Table 17: Mexico APAC Aviation Fuel Industry Revenue (Million) Forecast, by Application 2019 & 2032
- Table 18: Mexico APAC Aviation Fuel Industry Volume (Litre) Forecast, by Application 2019 & 2032
- Table 19: Global APAC Aviation Fuel Industry Revenue Million Forecast, by Country 2019 & 2032
- Table 20: Global APAC Aviation Fuel Industry Volume Litre Forecast, by Country 2019 & 2032
- Table 21: Germany APAC Aviation Fuel Industry Revenue (Million) Forecast, by Application 2019 & 2032
- Table 22: Germany APAC Aviation Fuel Industry Volume (Litre) Forecast, by Application 2019 & 2032
- Table 23: United Kingdom APAC Aviation Fuel Industry Revenue (Million) Forecast, by Application 2019 & 2032
- Table 24: United Kingdom APAC Aviation Fuel Industry Volume (Litre) Forecast, by Application 2019 & 2032
- Table 25: France APAC Aviation Fuel Industry Revenue (Million) Forecast, by Application 2019 & 2032
- Table 26: France APAC Aviation Fuel Industry Volume (Litre) Forecast, by Application 2019 & 2032
- Table 27: Spain APAC Aviation Fuel Industry Revenue (Million) Forecast, by Application 2019 & 2032
- Table 28: Spain APAC Aviation Fuel Industry Volume (Litre) Forecast, by Application 2019 & 2032
- Table 29: Italy APAC Aviation Fuel Industry Revenue (Million) Forecast, by Application 2019 & 2032
- Table 30: Italy APAC Aviation Fuel Industry Volume (Litre) Forecast, by Application 2019 & 2032
- Table 31: Spain APAC Aviation Fuel Industry Revenue (Million) Forecast, by Application 2019 & 2032
- Table 32: Spain APAC Aviation Fuel Industry Volume (Litre) Forecast, by Application 2019 & 2032
- Table 33: Belgium APAC Aviation Fuel Industry Revenue (Million) Forecast, by Application 2019 & 2032
- Table 34: Belgium APAC Aviation Fuel Industry Volume (Litre) Forecast, by Application 2019 & 2032
- Table 35: Netherland APAC Aviation Fuel Industry Revenue (Million) Forecast, by Application 2019 & 2032
- Table 36: Netherland APAC Aviation Fuel Industry Volume (Litre) Forecast, by Application 2019 & 2032
- Table 37: Nordics APAC Aviation Fuel Industry Revenue (Million) Forecast, by Application 2019 & 2032
- Table 38: Nordics APAC Aviation Fuel Industry Volume (Litre) Forecast, by Application 2019 & 2032
- Table 39: Rest of Europe APAC Aviation Fuel Industry Revenue (Million) Forecast, by Application 2019 & 2032
- Table 40: Rest of Europe APAC Aviation Fuel Industry Volume (Litre) Forecast, by Application 2019 & 2032
- Table 41: Global APAC Aviation Fuel Industry Revenue Million Forecast, by Country 2019 & 2032
- Table 42: Global APAC Aviation Fuel Industry Volume Litre Forecast, by Country 2019 & 2032
- Table 43: China APAC Aviation Fuel Industry Revenue (Million) Forecast, by Application 2019 & 2032
- Table 44: China APAC Aviation Fuel Industry Volume (Litre) Forecast, by Application 2019 & 2032
- Table 45: Japan APAC Aviation Fuel Industry Revenue (Million) Forecast, by Application 2019 & 2032
- Table 46: Japan APAC Aviation Fuel Industry Volume (Litre) Forecast, by Application 2019 & 2032
- Table 47: India APAC Aviation Fuel Industry Revenue (Million) Forecast, by Application 2019 & 2032
- Table 48: India APAC Aviation Fuel Industry Volume (Litre) Forecast, by Application 2019 & 2032
- Table 49: South Korea APAC Aviation Fuel Industry Revenue (Million) Forecast, by Application 2019 & 2032
- Table 50: South Korea APAC Aviation Fuel Industry Volume (Litre) Forecast, by Application 2019 & 2032
- Table 51: Southeast Asia APAC Aviation Fuel Industry Revenue (Million) Forecast, by Application 2019 & 2032
- Table 52: Southeast Asia APAC Aviation Fuel Industry Volume (Litre) Forecast, by Application 2019 & 2032
- Table 53: Australia APAC Aviation Fuel Industry Revenue (Million) Forecast, by Application 2019 & 2032
- Table 54: Australia APAC Aviation Fuel Industry Volume (Litre) Forecast, by Application 2019 & 2032
- Table 55: Indonesia APAC Aviation Fuel Industry Revenue (Million) Forecast, by Application 2019 & 2032
- Table 56: Indonesia APAC Aviation Fuel Industry Volume (Litre) Forecast, by Application 2019 & 2032
- Table 57: Phillipes APAC Aviation Fuel Industry Revenue (Million) Forecast, by Application 2019 & 2032
- Table 58: Phillipes APAC Aviation Fuel Industry Volume (Litre) Forecast, by Application 2019 & 2032
- Table 59: Singapore APAC Aviation Fuel Industry Revenue (Million) Forecast, by Application 2019 & 2032
- Table 60: Singapore APAC Aviation Fuel Industry Volume (Litre) Forecast, by Application 2019 & 2032
- Table 61: Thailandc APAC Aviation Fuel Industry Revenue (Million) Forecast, by Application 2019 & 2032
- Table 62: Thailandc APAC Aviation Fuel Industry Volume (Litre) Forecast, by Application 2019 & 2032
- Table 63: Rest of Asia Pacific APAC Aviation Fuel Industry Revenue (Million) Forecast, by Application 2019 & 2032
- Table 64: Rest of Asia Pacific APAC Aviation Fuel Industry Volume (Litre) Forecast, by Application 2019 & 2032
- Table 65: Global APAC Aviation Fuel Industry Revenue Million Forecast, by Country 2019 & 2032
- Table 66: Global APAC Aviation Fuel Industry Volume Litre Forecast, by Country 2019 & 2032
- Table 67: Brazil APAC Aviation Fuel Industry Revenue (Million) Forecast, by Application 2019 & 2032
- Table 68: Brazil APAC Aviation Fuel Industry Volume (Litre) Forecast, by Application 2019 & 2032
- Table 69: Argentina APAC Aviation Fuel Industry Revenue (Million) Forecast, by Application 2019 & 2032
- Table 70: Argentina APAC Aviation Fuel Industry Volume (Litre) Forecast, by Application 2019 & 2032
- Table 71: Peru APAC Aviation Fuel Industry Revenue (Million) Forecast, by Application 2019 & 2032
- Table 72: Peru APAC Aviation Fuel Industry Volume (Litre) Forecast, by Application 2019 & 2032
- Table 73: Chile APAC Aviation Fuel Industry Revenue (Million) Forecast, by Application 2019 & 2032
- Table 74: Chile APAC Aviation Fuel Industry Volume (Litre) Forecast, by Application 2019 & 2032
- Table 75: Colombia APAC Aviation Fuel Industry Revenue (Million) Forecast, by Application 2019 & 2032
- Table 76: Colombia APAC Aviation Fuel Industry Volume (Litre) Forecast, by Application 2019 & 2032
- Table 77: Ecuador APAC Aviation Fuel Industry Revenue (Million) Forecast, by Application 2019 & 2032
- Table 78: Ecuador APAC Aviation Fuel Industry Volume (Litre) Forecast, by Application 2019 & 2032
- Table 79: Venezuela APAC Aviation Fuel Industry Revenue (Million) Forecast, by Application 2019 & 2032
- Table 80: Venezuela APAC Aviation Fuel Industry Volume (Litre) Forecast, by Application 2019 & 2032
- Table 81: Rest of South America APAC Aviation Fuel Industry Revenue (Million) Forecast, by Application 2019 & 2032
- Table 82: Rest of South America APAC Aviation Fuel Industry Volume (Litre) Forecast, by Application 2019 & 2032
- Table 83: Global APAC Aviation Fuel Industry Revenue Million Forecast, by Country 2019 & 2032
- Table 84: Global APAC Aviation Fuel Industry Volume Litre Forecast, by Country 2019 & 2032
- Table 85: United States APAC Aviation Fuel Industry Revenue (Million) Forecast, by Application 2019 & 2032
- Table 86: United States APAC Aviation Fuel Industry Volume (Litre) Forecast, by Application 2019 & 2032
- Table 87: Canada APAC Aviation Fuel Industry Revenue (Million) Forecast, by Application 2019 & 2032
- Table 88: Canada APAC Aviation Fuel Industry Volume (Litre) Forecast, by Application 2019 & 2032
- Table 89: Mexico APAC Aviation Fuel Industry Revenue (Million) Forecast, by Application 2019 & 2032
- Table 90: Mexico APAC Aviation Fuel Industry Volume (Litre) Forecast, by Application 2019 & 2032
- Table 91: Global APAC Aviation Fuel Industry Revenue Million Forecast, by Country 2019 & 2032
- Table 92: Global APAC Aviation Fuel Industry Volume Litre Forecast, by Country 2019 & 2032
- Table 93: United Arab Emirates APAC Aviation Fuel Industry Revenue (Million) Forecast, by Application 2019 & 2032
- Table 94: United Arab Emirates APAC Aviation Fuel Industry Volume (Litre) Forecast, by Application 2019 & 2032
- Table 95: Saudi Arabia APAC Aviation Fuel Industry Revenue (Million) Forecast, by Application 2019 & 2032
- Table 96: Saudi Arabia APAC Aviation Fuel Industry Volume (Litre) Forecast, by Application 2019 & 2032
- Table 97: South Africa APAC Aviation Fuel Industry Revenue (Million) Forecast, by Application 2019 & 2032
- Table 98: South Africa APAC Aviation Fuel Industry Volume (Litre) Forecast, by Application 2019 & 2032
- Table 99: Rest of Middle East and Africa APAC Aviation Fuel Industry Revenue (Million) Forecast, by Application 2019 & 2032
- Table 100: Rest of Middle East and Africa APAC Aviation Fuel Industry Volume (Litre) Forecast, by Application 2019 & 2032
- Table 101: Global APAC Aviation Fuel Industry Revenue Million Forecast, by Fuel Type 2019 & 2032
- Table 102: Global APAC Aviation Fuel Industry Volume Litre Forecast, by Fuel Type 2019 & 2032
- Table 103: Global APAC Aviation Fuel Industry Revenue Million Forecast, by Application 2019 & 2032
- Table 104: Global APAC Aviation Fuel Industry Volume Litre Forecast, by Application 2019 & 2032
- Table 105: Global APAC Aviation Fuel Industry Revenue Million Forecast, by Geography 2019 & 2032
- Table 106: Global APAC Aviation Fuel Industry Volume Litre Forecast, by Geography 2019 & 2032
- Table 107: Global APAC Aviation Fuel Industry Revenue Million Forecast, by Country 2019 & 2032
- Table 108: Global APAC Aviation Fuel Industry Volume Litre Forecast, by Country 2019 & 2032
- Table 109: Global APAC Aviation Fuel Industry Revenue Million Forecast, by Fuel Type 2019 & 2032
- Table 110: Global APAC Aviation Fuel Industry Volume Litre Forecast, by Fuel Type 2019 & 2032
- Table 111: Global APAC Aviation Fuel Industry Revenue Million Forecast, by Application 2019 & 2032
- Table 112: Global APAC Aviation Fuel Industry Volume Litre Forecast, by Application 2019 & 2032
- Table 113: Global APAC Aviation Fuel Industry Revenue Million Forecast, by Geography 2019 & 2032
- Table 114: Global APAC Aviation Fuel Industry Volume Litre Forecast, by Geography 2019 & 2032
- Table 115: Global APAC Aviation Fuel Industry Revenue Million Forecast, by Country 2019 & 2032
- Table 116: Global APAC Aviation Fuel Industry Volume Litre Forecast, by Country 2019 & 2032
- Table 117: Global APAC Aviation Fuel Industry Revenue Million Forecast, by Fuel Type 2019 & 2032
- Table 118: Global APAC Aviation Fuel Industry Volume Litre Forecast, by Fuel Type 2019 & 2032
- Table 119: Global APAC Aviation Fuel Industry Revenue Million Forecast, by Application 2019 & 2032
- Table 120: Global APAC Aviation Fuel Industry Volume Litre Forecast, by Application 2019 & 2032
- Table 121: Global APAC Aviation Fuel Industry Revenue Million Forecast, by Geography 2019 & 2032
- Table 122: Global APAC Aviation Fuel Industry Volume Litre Forecast, by Geography 2019 & 2032
- Table 123: Global APAC Aviation Fuel Industry Revenue Million Forecast, by Country 2019 & 2032
- Table 124: Global APAC Aviation Fuel Industry Volume Litre Forecast, by Country 2019 & 2032
- Table 125: Global APAC Aviation Fuel Industry Revenue Million Forecast, by Fuel Type 2019 & 2032
- Table 126: Global APAC Aviation Fuel Industry Volume Litre Forecast, by Fuel Type 2019 & 2032
- Table 127: Global APAC Aviation Fuel Industry Revenue Million Forecast, by Application 2019 & 2032
- Table 128: Global APAC Aviation Fuel Industry Volume Litre Forecast, by Application 2019 & 2032
- Table 129: Global APAC Aviation Fuel Industry Revenue Million Forecast, by Geography 2019 & 2032
- Table 130: Global APAC Aviation Fuel Industry Volume Litre Forecast, by Geography 2019 & 2032
- Table 131: Global APAC Aviation Fuel Industry Revenue Million Forecast, by Country 2019 & 2032
- Table 132: Global APAC Aviation Fuel Industry Volume Litre Forecast, by Country 2019 & 2032
- Table 133: Global APAC Aviation Fuel Industry Revenue Million Forecast, by Fuel Type 2019 & 2032
- Table 134: Global APAC Aviation Fuel Industry Volume Litre Forecast, by Fuel Type 2019 & 2032
- Table 135: Global APAC Aviation Fuel Industry Revenue Million Forecast, by Application 2019 & 2032
- Table 136: Global APAC Aviation Fuel Industry Volume Litre Forecast, by Application 2019 & 2032
- Table 137: Global APAC Aviation Fuel Industry Revenue Million Forecast, by Geography 2019 & 2032
- Table 138: Global APAC Aviation Fuel Industry Volume Litre Forecast, by Geography 2019 & 2032
- Table 139: Global APAC Aviation Fuel Industry Revenue Million Forecast, by Country 2019 & 2032
- Table 140: Global APAC Aviation Fuel Industry Volume Litre Forecast, by Country 2019 & 2032
- Table 141: Global APAC Aviation Fuel Industry Revenue Million Forecast, by Fuel Type 2019 & 2032
- Table 142: Global APAC Aviation Fuel Industry Volume Litre Forecast, by Fuel Type 2019 & 2032
- Table 143: Global APAC Aviation Fuel Industry Revenue Million Forecast, by Application 2019 & 2032
- Table 144: Global APAC Aviation Fuel Industry Volume Litre Forecast, by Application 2019 & 2032
- Table 145: Global APAC Aviation Fuel Industry Revenue Million Forecast, by Geography 2019 & 2032
- Table 146: Global APAC Aviation Fuel Industry Volume Litre Forecast, by Geography 2019 & 2032
- Table 147: Global APAC Aviation Fuel Industry Revenue Million Forecast, by Country 2019 & 2032
- Table 148: Global APAC Aviation Fuel Industry Volume Litre Forecast, by Country 2019 & 2032
Frequently Asked Questions
1. What is the projected Compound Annual Growth Rate (CAGR) of the APAC Aviation Fuel Industry?
The projected CAGR is approximately > 10.00%.
2. Which companies are prominent players in the APAC Aviation Fuel Industry?
Key companies in the market include BP plc, Bharat Petroleum Corp Ltd, Exxon Mobil Corporation*List Not Exhaustive, Royal Dutch Shell Plc, Pertamina Persero PT, Chevron Corporation, World Fuel Services Corp, Petronas Aviation Sdn Bhd, China Aviation Oil Corporation Ltd, Vitol Holding BV.
3. What are the main segments of the APAC Aviation Fuel Industry?
The market segments include Fuel Type, Application, Geography.
4. Can you provide details about the market size?
The market size is estimated to be USD XX Million as of 2022.
5. What are some drivers contributing to market growth?
4.; Increase in Prices of Electricity Procured from Conventional Mechanisms 4.; Decline in Cost of Solar Energy Infrastructure.
6. What are the notable trends driving market growth?
Commercial Aircraft Segment to Dominate the Market.
7. Are there any restraints impacting market growth?
4.; Competition from Other Alternative Energy Sources.
8. Can you provide examples of recent developments in the market?
N/A
9. What pricing options are available for accessing the report?
Pricing options include single-user, multi-user, and enterprise licenses priced at USD 4750, USD 5250, and USD 8750 respectively.
10. Is the market size provided in terms of value or volume?
The market size is provided in terms of value, measured in Million and volume, measured in Litre.
11. Are there any specific market keywords associated with the report?
Yes, the market keyword associated with the report is "APAC Aviation Fuel Industry," which aids in identifying and referencing the specific market segment covered.
12. How do I determine which pricing option suits my needs best?
The pricing options vary based on user requirements and access needs. Individual users may opt for single-user licenses, while businesses requiring broader access may choose multi-user or enterprise licenses for cost-effective access to the report.
13. Are there any additional resources or data provided in the APAC Aviation Fuel Industry report?
While the report offers comprehensive insights, it's advisable to review the specific contents or supplementary materials provided to ascertain if additional resources or data are available.
14. How can I stay updated on further developments or reports in the APAC Aviation Fuel Industry?
To stay informed about further developments, trends, and reports in the APAC Aviation Fuel Industry, consider subscribing to industry newsletters, following relevant companies and organizations, or regularly checking reputable industry news sources and publications.
Methodology
Step 1 - Identification of Relevant Samples Size from Population Database


Step 2 - Approaches for Defining Global Market Size (Value, Volume* & Price*)

Note*: In applicable scenarios
Step 3 - Data Sources
Primary Research
- Web Analytics
- Survey Reports
- Research Institute
- Latest Research Reports
- Opinion Leaders
Secondary Research
- Annual Reports
- White Paper
- Latest Press Release
- Industry Association
- Paid Database
- Investor Presentations

Step 4 - Data Triangulation
Involves using different sources of information in order to increase the validity of a study
These sources are likely to be stakeholders in a program - participants, other researchers, program staff, other community members, and so on.
Then we put all data in single framework & apply various statistical tools to find out the dynamic on the market.
During the analysis stage, feedback from the stakeholder groups would be compared to determine areas of agreement as well as areas of divergence
