

Key Insights
The Asia-Pacific (APAC) alcoholic drinks market, a dynamic and rapidly evolving landscape, is projected to experience robust growth over the forecast period (2025-2033). Driven by rising disposable incomes, increasing urbanization, and a burgeoning young adult population with a penchant for premiumization and diverse alcoholic beverage options, the market shows significant promise. The region's diverse cultural preferences and consumption habits present both challenges and opportunities for market players. While beer remains a dominant segment, the growing popularity of wine and spirits, particularly in emerging economies like India and China, is significantly shaping market dynamics. The off-trade channel (retail sales) is witnessing strong growth, fueled by e-commerce expansion and changing consumer behavior. However, stringent government regulations regarding alcohol advertising and consumption, alongside health concerns about excessive alcohol intake, pose restraints to the industry's growth. Competition amongst both global and local players is intense, with established international brands leveraging their brand recognition while local players capitalize on regional tastes and preferences. Within APAC, specific countries like China, India, and Japan present distinct market characteristics requiring tailored strategies. China, for example, exhibits a strong preference for baijiu alongside increasing Western alcohol consumption. India shows a marked preference for Indian Made Foreign Liquor (IMFL), while Japan presents a relatively mature market with established preferences for sake and whisky. The forecast period will likely see a continuation of these trends, with opportunities for innovation and product diversification providing further growth potential.
Significant growth is anticipated in the premium and craft segments of the alcoholic beverage market. Consumers are increasingly willing to spend more on higher-quality products with unique characteristics and storytelling. This trend will be seen across all alcoholic beverage types and channels. Furthermore, the rise of experiential consumption and social drinking occasions continues to drive growth. Strategic partnerships and investments in local production and distribution networks will be crucial for success in this highly competitive and geographically diverse market. Sustainability concerns are also increasingly important to consumers, potentially influencing brand choices and production methods. The evolving regulatory landscape presents a challenge that requires careful navigation, with compliance being key to maintaining a positive market presence.
APAC Alcoholic Drinks Industry: Market Report 2019-2033
Dive deep into the dynamic APAC alcoholic drinks market with our comprehensive report, providing actionable insights for strategic decision-making. This detailed analysis covers the period from 2019 to 2033, with a focus on 2025, offering a thorough understanding of market trends, key players, and future opportunities. This report is essential for investors, industry professionals, and anyone seeking to navigate the complexities of this thriving market.
APAC Alcoholic Drinks Industry Market Dynamics & Concentration
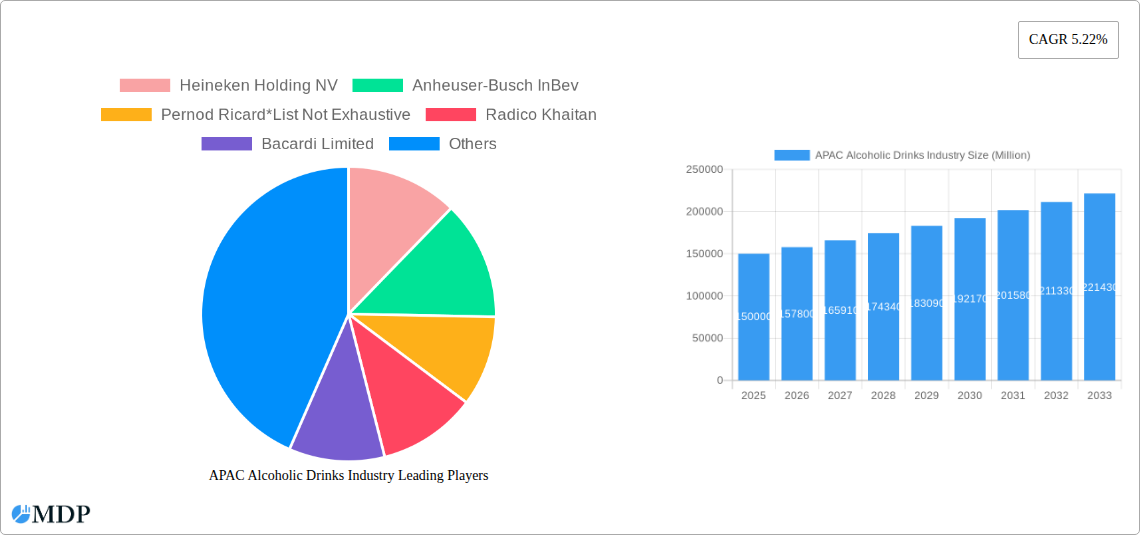
The APAC alcoholic drinks market, valued at xx Million in 2024, is characterized by a dynamic interplay of factors influencing its growth and concentration. Market leaders such as Heineken Holding NV, Anheuser-Busch InBev, and Pernod Ricard hold significant market share, but the landscape also includes numerous regional players like Radico Khaitan, Bacardi Limited, Suntory Beverages & Food Limited, Brown-Forman, Molson Coors Brewing Company, Diageo PLC, and The Wine Group LLC.
- Market Concentration: The market exhibits moderate concentration, with the top 5 players holding an estimated xx% market share in 2024. However, increasing competition from smaller, craft breweries and distilleries is challenging this concentration.
- Innovation Drivers: Consumer demand for premiumization, health-conscious options (low-calorie, organic), and innovative product formats (RTDs, ready-to-drink cocktails) are driving innovation.
- Regulatory Frameworks: Varying regulations across different APAC countries regarding alcohol production, distribution, and advertising significantly impact market dynamics. These regulations influence pricing, product availability, and marketing strategies.
- Product Substitutes: Non-alcoholic beverages, including craft sodas and functional drinks, present growing competition to alcoholic beverages, particularly among health-conscious consumers.
- End-User Trends: Changing lifestyles, rising disposable incomes in emerging economies, and evolving social norms are key drivers of consumer preference shifts. Premiumization and the growing popularity of craft beverages represent notable trends.
- M&A Activities: The APAC alcoholic beverage industry has witnessed xx M&A deals in the past five years, reflecting strategic consolidation and expansion efforts by major players.
APAC Alcoholic Drinks Industry Industry Trends & Analysis
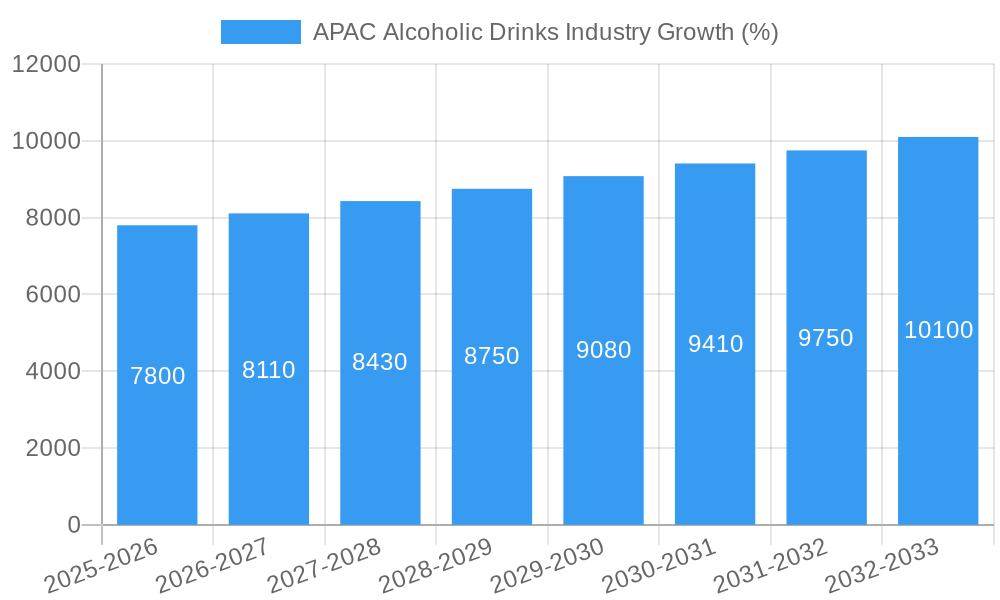
The APAC alcoholic drinks market demonstrates robust growth potential, driven by a complex interplay of factors. The market is predicted to expand at a CAGR of xx% during the forecast period (2025-2033), reaching an estimated value of xx Million by 2033. This growth trajectory is underpinned by several key industry trends:
- Market Growth Drivers: Rising disposable incomes, particularly in developing economies within APAC, are a significant catalyst. Urbanization and a burgeoning young adult population also contribute significantly. Changing consumer preferences towards premiumization and diverse product offerings further fuel market expansion.
- Technological Disruptions: E-commerce platforms and direct-to-consumer (DTC) models are transforming distribution channels, improving efficiency, and broadening market reach. Technological advancements in production and packaging also contribute to enhanced efficiency and product innovation.
- Consumer Preferences: The preference for premium and craft alcoholic beverages is evident, with consumers increasingly seeking unique flavor profiles, higher-quality ingredients, and authentic brand stories. This trend particularly fuels the growth of craft beer, premium spirits, and imported wines.
- Competitive Dynamics: Intense competition among both established global players and emerging local brands shapes the market. Competitive strategies involve product innovation, targeted marketing campaigns, and strategic partnerships to gain market share and enhance brand visibility. Market penetration for craft beers and spirits continues to grow.
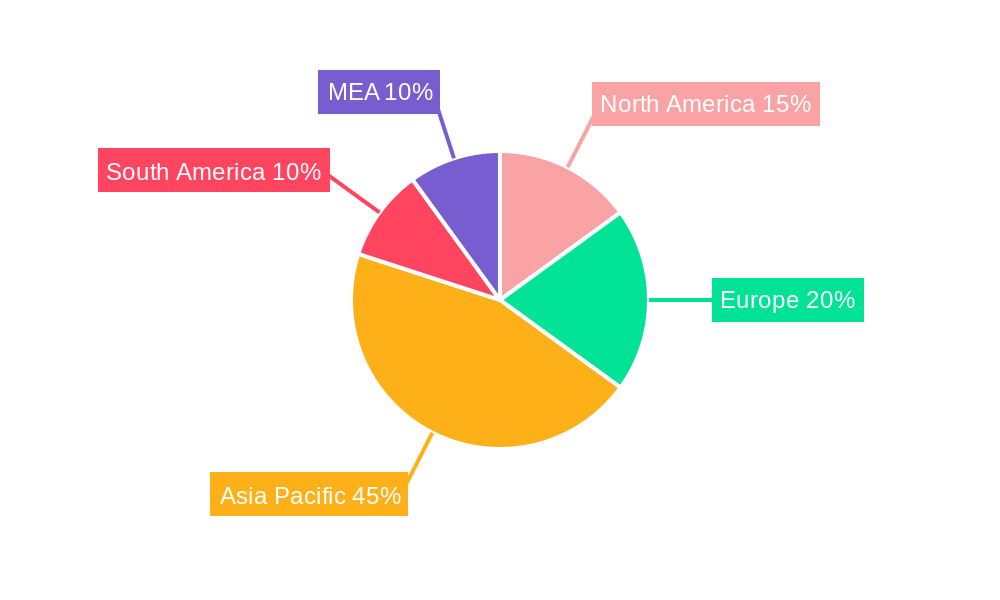
Leading Markets & Segments in APAC Alcoholic Drinks Industry
Within the vast APAC region, China, India, Japan and South Korea stand out as leading markets. This dominance is influenced by economic factors, infrastructure and population size:
Key Drivers:
- China: Strong economic growth, increasing disposable incomes, and a significant population drive high alcohol consumption. The rise of a middle class with more disposable income is pushing the demand for premium alcoholic beverages.
- India: A large and growing population creates massive market potential, although regulatory challenges and varied consumption habits across different regions influence market dynamics.
- Japan: A mature market with a strong preference for traditional alcoholic beverages but also experiencing growth in premium segments and craft options.
- South Korea: High disposable income, a young population, and a sophisticated drinking culture drive demand for diverse alcoholic products.
Dominance Analysis: While Beer maintains a significant market share, the spirits segment is experiencing rapid growth, particularly in premium and imported varieties. The on-trade channel (restaurants, bars) remains dominant, but the off-trade channel (retail stores) is witnessing increased growth due to the rise of e-commerce and convenience shopping.
APAC Alcoholic Drinks Industry Product Developments
Product innovation is a key battleground in the APAC alcoholic drinks market. Companies are leveraging technological advancements to create new product formats, flavors, and experiences. Examples include ready-to-drink cocktails (RTDs), low-calorie and organic options, and unique flavor combinations catering to evolving consumer preferences. This trend shows that companies are adopting strategies that focus on health-conscious options as well as premium offerings with premium price points. These strategies are used to adapt to evolving consumer preferences and provide value and uniqueness in a highly competitive market.
Key Drivers of APAC Alcoholic Drinks Industry Growth
Several key factors are propelling the growth of the APAC alcoholic drinks industry:
- Economic Growth: Rising disposable incomes across many APAC countries directly translate into increased spending on discretionary items, including alcoholic beverages.
- Changing Consumer Preferences: The preference for premiumization, craft options, and innovative product formats continues to drive growth.
- Favorable Government Policies (in selected regions): In certain countries within the region, government policies that support the alcohol industry contribute to its expansion.
Challenges in the APAC Alcoholic Drinks Industry Market
The APAC alcoholic drinks market faces several significant challenges:
- Regulatory Hurdles: Varying and sometimes stringent alcohol regulations across different APAC countries create complexities in production, distribution, and marketing.
- Supply Chain Disruptions: Global supply chain issues impact the availability and cost of raw materials, affecting production and pricing.
- Intense Competition: The market’s high competitiveness necessitates continuous innovation and efficient cost management to sustain profitability.
Emerging Opportunities in APAC Alcoholic Drinks Industry
Long-term growth in the APAC alcoholic drinks industry is fueled by several emerging opportunities:
- Health-conscious options: The increasing demand for low-calorie, organic, and functional alcoholic beverages presents significant opportunities for companies to develop and market such products.
- Premiumization and Craft Beverages: The ongoing trend of premiumization creates growth potential for high-quality, unique, and artisan products.
- Strategic Partnerships and M&A: Strategic collaborations and mergers and acquisitions enable companies to expand their product portfolio, enhance market reach, and accelerate growth.
Leading Players in the APAC Alcoholic Drinks Industry Sector
- Heineken Holding NV
- Anheuser-Busch InBev
- Pernod Ricard
- Radico Khaitan
- Bacardi Limited
- Suntory Beverages & Food Limited
- Brown-Forman
- Molson Coors Brewing Company
- Diageo PLC
- The Wine Group LLC
Key Milestones in APAC Alcoholic Drinks Industry Industry
- April 2022: Diageo India launched a new single malt whisky and two mixers, showcasing innovation in the spirits segment.
- February 2022: Bacardi GTR partnered with China Duty-Free Group to introduce a new travel-retail exclusive Teeling Whiskey line, expanding its market reach.
- July 2021: The Boston Beer Company and Beam Suntory formed a strategic partnership to expand into ready-to-drink (RTD) and bottled spirits markets, highlighting collaboration and market expansion strategies.
Strategic Outlook for APAC Alcoholic Drinks Industry Market
The APAC alcoholic drinks market holds substantial long-term growth potential. Strategic opportunities lie in capitalizing on the rising demand for premium and craft beverages, adapting to evolving consumer preferences, and navigating the complexities of the regulatory landscape. Companies that effectively invest in product innovation, sustainable supply chains, and targeted marketing campaigns will be well-positioned to succeed in this dynamic and lucrative market.
APAC Alcoholic Drinks Industry Segmentation
-
1. Product Type
- 1.1. Beer
- 1.2. Wine
- 1.3. Spirits
-
2. Distribution Channel
- 2.1. On-trade
-
2.2. Off-trade
- 2.2.1. Supermarkets/Hypermarkets
- 2.2.2. Specialist Stores
- 2.2.3. Online Retail Stores
- 2.2.4. Other Off-trade Channels
-
3. Geography
- 3.1. China
- 3.2. Japan
- 3.3. India
- 3.4. Australia
- 3.5. Rest of Asia-Pacific
APAC Alcoholic Drinks Industry Segmentation By Geography
- 1. China
- 2. Japan
- 3. India
- 4. Australia
- 5. Rest of Asia Pacific
APAC Alcoholic Drinks Industry REPORT HIGHLIGHTS
| Aspects | Details |
|---|---|
| Study Period | 2019-2033 |
| Base Year | 2024 |
| Estimated Year | 2025 |
| Forecast Period | 2025-2033 |
| Historical Period | 2019-2024 |
| Growth Rate | CAGR of 5.22% from 2019-2033 |
| Segmentation |
|
Table of Contents
- 1. Introduction
- 1.1. Research Scope
- 1.2. Market Segmentation
- 1.3. Research Methodology
- 1.4. Definitions and Assumptions
- 2. Executive Summary
- 2.1. Introduction
- 3. Market Dynamics
- 3.1. Introduction
- 3.2. Market Drivers
- 3.2.1. Convenience Offered By Online Food Delivery Services; Attractive Offers And Memberships Along With Advertisements And Marketing By Players
- 3.3. Market Restrains
- 3.3.1. Consumers Desire For Fine Dining Experience
- 3.4. Market Trends
- 3.4.1. Rising Demand for Cocktails and Other Mixed Drinks
- 4. Market Factor Analysis
- 4.1. Porters Five Forces
- 4.2. Supply/Value Chain
- 4.3. PESTEL analysis
- 4.4. Market Entropy
- 4.5. Patent/Trademark Analysis
- 5. Global APAC Alcoholic Drinks Industry Analysis, Insights and Forecast, 2019-2031
- 5.1. Market Analysis, Insights and Forecast - by Product Type
- 5.1.1. Beer
- 5.1.2. Wine
- 5.1.3. Spirits
- 5.2. Market Analysis, Insights and Forecast - by Distribution Channel
- 5.2.1. On-trade
- 5.2.2. Off-trade
- 5.2.2.1. Supermarkets/Hypermarkets
- 5.2.2.2. Specialist Stores
- 5.2.2.3. Online Retail Stores
- 5.2.2.4. Other Off-trade Channels
- 5.3. Market Analysis, Insights and Forecast - by Geography
- 5.3.1. China
- 5.3.2. Japan
- 5.3.3. India
- 5.3.4. Australia
- 5.3.5. Rest of Asia-Pacific
- 5.4. Market Analysis, Insights and Forecast - by Region
- 5.4.1. China
- 5.4.2. Japan
- 5.4.3. India
- 5.4.4. Australia
- 5.4.5. Rest of Asia Pacific
- 5.1. Market Analysis, Insights and Forecast - by Product Type
- 6. China APAC Alcoholic Drinks Industry Analysis, Insights and Forecast, 2019-2031
- 6.1. Market Analysis, Insights and Forecast - by Product Type
- 6.1.1. Beer
- 6.1.2. Wine
- 6.1.3. Spirits
- 6.2. Market Analysis, Insights and Forecast - by Distribution Channel
- 6.2.1. On-trade
- 6.2.2. Off-trade
- 6.2.2.1. Supermarkets/Hypermarkets
- 6.2.2.2. Specialist Stores
- 6.2.2.3. Online Retail Stores
- 6.2.2.4. Other Off-trade Channels
- 6.3. Market Analysis, Insights and Forecast - by Geography
- 6.3.1. China
- 6.3.2. Japan
- 6.3.3. India
- 6.3.4. Australia
- 6.3.5. Rest of Asia-Pacific
- 6.1. Market Analysis, Insights and Forecast - by Product Type
- 7. Japan APAC Alcoholic Drinks Industry Analysis, Insights and Forecast, 2019-2031
- 7.1. Market Analysis, Insights and Forecast - by Product Type
- 7.1.1. Beer
- 7.1.2. Wine
- 7.1.3. Spirits
- 7.2. Market Analysis, Insights and Forecast - by Distribution Channel
- 7.2.1. On-trade
- 7.2.2. Off-trade
- 7.2.2.1. Supermarkets/Hypermarkets
- 7.2.2.2. Specialist Stores
- 7.2.2.3. Online Retail Stores
- 7.2.2.4. Other Off-trade Channels
- 7.3. Market Analysis, Insights and Forecast - by Geography
- 7.3.1. China
- 7.3.2. Japan
- 7.3.3. India
- 7.3.4. Australia
- 7.3.5. Rest of Asia-Pacific
- 7.1. Market Analysis, Insights and Forecast - by Product Type
- 8. India APAC Alcoholic Drinks Industry Analysis, Insights and Forecast, 2019-2031
- 8.1. Market Analysis, Insights and Forecast - by Product Type
- 8.1.1. Beer
- 8.1.2. Wine
- 8.1.3. Spirits
- 8.2. Market Analysis, Insights and Forecast - by Distribution Channel
- 8.2.1. On-trade
- 8.2.2. Off-trade
- 8.2.2.1. Supermarkets/Hypermarkets
- 8.2.2.2. Specialist Stores
- 8.2.2.3. Online Retail Stores
- 8.2.2.4. Other Off-trade Channels
- 8.3. Market Analysis, Insights and Forecast - by Geography
- 8.3.1. China
- 8.3.2. Japan
- 8.3.3. India
- 8.3.4. Australia
- 8.3.5. Rest of Asia-Pacific
- 8.1. Market Analysis, Insights and Forecast - by Product Type
- 9. Australia APAC Alcoholic Drinks Industry Analysis, Insights and Forecast, 2019-2031
- 9.1. Market Analysis, Insights and Forecast - by Product Type
- 9.1.1. Beer
- 9.1.2. Wine
- 9.1.3. Spirits
- 9.2. Market Analysis, Insights and Forecast - by Distribution Channel
- 9.2.1. On-trade
- 9.2.2. Off-trade
- 9.2.2.1. Supermarkets/Hypermarkets
- 9.2.2.2. Specialist Stores
- 9.2.2.3. Online Retail Stores
- 9.2.2.4. Other Off-trade Channels
- 9.3. Market Analysis, Insights and Forecast - by Geography
- 9.3.1. China
- 9.3.2. Japan
- 9.3.3. India
- 9.3.4. Australia
- 9.3.5. Rest of Asia-Pacific
- 9.1. Market Analysis, Insights and Forecast - by Product Type
- 10. Rest of Asia Pacific APAC Alcoholic Drinks Industry Analysis, Insights and Forecast, 2019-2031
- 10.1. Market Analysis, Insights and Forecast - by Product Type
- 10.1.1. Beer
- 10.1.2. Wine
- 10.1.3. Spirits
- 10.2. Market Analysis, Insights and Forecast - by Distribution Channel
- 10.2.1. On-trade
- 10.2.2. Off-trade
- 10.2.2.1. Supermarkets/Hypermarkets
- 10.2.2.2. Specialist Stores
- 10.2.2.3. Online Retail Stores
- 10.2.2.4. Other Off-trade Channels
- 10.3. Market Analysis, Insights and Forecast - by Geography
- 10.3.1. China
- 10.3.2. Japan
- 10.3.3. India
- 10.3.4. Australia
- 10.3.5. Rest of Asia-Pacific
- 10.1. Market Analysis, Insights and Forecast - by Product Type
- 11. North America APAC Alcoholic Drinks Industry Analysis, Insights and Forecast, 2019-2031
- 11.1. Market Analysis, Insights and Forecast - By Country/Sub-region
- 11.1.1 United States
- 11.1.2 Canada
- 11.1.3 Mexico
- 12. Europe APAC Alcoholic Drinks Industry Analysis, Insights and Forecast, 2019-2031
- 12.1. Market Analysis, Insights and Forecast - By Country/Sub-region
- 12.1.1 Germany
- 12.1.2 United Kingdom
- 12.1.3 France
- 12.1.4 Spain
- 12.1.5 Italy
- 12.1.6 Spain
- 12.1.7 Belgium
- 12.1.8 Netherland
- 12.1.9 Nordics
- 12.1.10 Rest of Europe
- 13. Asia Pacific APAC Alcoholic Drinks Industry Analysis, Insights and Forecast, 2019-2031
- 13.1. Market Analysis, Insights and Forecast - By Country/Sub-region
- 13.1.1 China
- 13.1.2 Japan
- 13.1.3 India
- 13.1.4 South Korea
- 13.1.5 Southeast Asia
- 13.1.6 Australia
- 13.1.7 Indonesia
- 13.1.8 Phillipes
- 13.1.9 Singapore
- 13.1.10 Thailandc
- 13.1.11 Rest of Asia Pacific
- 14. South America APAC Alcoholic Drinks Industry Analysis, Insights and Forecast, 2019-2031
- 14.1. Market Analysis, Insights and Forecast - By Country/Sub-region
- 14.1.1 Brazil
- 14.1.2 Argentina
- 14.1.3 Peru
- 14.1.4 Chile
- 14.1.5 Colombia
- 14.1.6 Ecuador
- 14.1.7 Venezuela
- 14.1.8 Rest of South America
- 15. North America APAC Alcoholic Drinks Industry Analysis, Insights and Forecast, 2019-2031
- 15.1. Market Analysis, Insights and Forecast - By Country/Sub-region
- 15.1.1 United States
- 15.1.2 Canada
- 15.1.3 Mexico
- 16. MEA APAC Alcoholic Drinks Industry Analysis, Insights and Forecast, 2019-2031
- 16.1. Market Analysis, Insights and Forecast - By Country/Sub-region
- 16.1.1 United Arab Emirates
- 16.1.2 Saudi Arabia
- 16.1.3 South Africa
- 16.1.4 Rest of Middle East and Africa
- 17. Competitive Analysis
- 17.1. Global Market Share Analysis 2024
- 17.2. Company Profiles
- 17.2.1 Heineken Holding NV
- 17.2.1.1. Overview
- 17.2.1.2. Products
- 17.2.1.3. SWOT Analysis
- 17.2.1.4. Recent Developments
- 17.2.1.5. Financials (Based on Availability)
- 17.2.2 Anheuser-Busch InBev
- 17.2.2.1. Overview
- 17.2.2.2. Products
- 17.2.2.3. SWOT Analysis
- 17.2.2.4. Recent Developments
- 17.2.2.5. Financials (Based on Availability)
- 17.2.3 Pernod Ricard*List Not Exhaustive
- 17.2.3.1. Overview
- 17.2.3.2. Products
- 17.2.3.3. SWOT Analysis
- 17.2.3.4. Recent Developments
- 17.2.3.5. Financials (Based on Availability)
- 17.2.4 Radico Khaitan
- 17.2.4.1. Overview
- 17.2.4.2. Products
- 17.2.4.3. SWOT Analysis
- 17.2.4.4. Recent Developments
- 17.2.4.5. Financials (Based on Availability)
- 17.2.5 Bacardi Limited
- 17.2.5.1. Overview
- 17.2.5.2. Products
- 17.2.5.3. SWOT Analysis
- 17.2.5.4. Recent Developments
- 17.2.5.5. Financials (Based on Availability)
- 17.2.6 Suntory Beverages & Food Limited
- 17.2.6.1. Overview
- 17.2.6.2. Products
- 17.2.6.3. SWOT Analysis
- 17.2.6.4. Recent Developments
- 17.2.6.5. Financials (Based on Availability)
- 17.2.7 Brown-Forman
- 17.2.7.1. Overview
- 17.2.7.2. Products
- 17.2.7.3. SWOT Analysis
- 17.2.7.4. Recent Developments
- 17.2.7.5. Financials (Based on Availability)
- 17.2.8 Molson Coors Brewing Company
- 17.2.8.1. Overview
- 17.2.8.2. Products
- 17.2.8.3. SWOT Analysis
- 17.2.8.4. Recent Developments
- 17.2.8.5. Financials (Based on Availability)
- 17.2.9 Diageo PLC
- 17.2.9.1. Overview
- 17.2.9.2. Products
- 17.2.9.3. SWOT Analysis
- 17.2.9.4. Recent Developments
- 17.2.9.5. Financials (Based on Availability)
- 17.2.10 The Wine Group LLC
- 17.2.10.1. Overview
- 17.2.10.2. Products
- 17.2.10.3. SWOT Analysis
- 17.2.10.4. Recent Developments
- 17.2.10.5. Financials (Based on Availability)
- 17.2.1 Heineken Holding NV
List of Figures
- Figure 1: Global APAC Alcoholic Drinks Industry Revenue Breakdown (Million, %) by Region 2024 & 2032
- Figure 2: North America APAC Alcoholic Drinks Industry Revenue (Million), by Country 2024 & 2032
- Figure 3: North America APAC Alcoholic Drinks Industry Revenue Share (%), by Country 2024 & 2032
- Figure 4: Europe APAC Alcoholic Drinks Industry Revenue (Million), by Country 2024 & 2032
- Figure 5: Europe APAC Alcoholic Drinks Industry Revenue Share (%), by Country 2024 & 2032
- Figure 6: Asia Pacific APAC Alcoholic Drinks Industry Revenue (Million), by Country 2024 & 2032
- Figure 7: Asia Pacific APAC Alcoholic Drinks Industry Revenue Share (%), by Country 2024 & 2032
- Figure 8: South America APAC Alcoholic Drinks Industry Revenue (Million), by Country 2024 & 2032
- Figure 9: South America APAC Alcoholic Drinks Industry Revenue Share (%), by Country 2024 & 2032
- Figure 10: North America APAC Alcoholic Drinks Industry Revenue (Million), by Country 2024 & 2032
- Figure 11: North America APAC Alcoholic Drinks Industry Revenue Share (%), by Country 2024 & 2032
- Figure 12: MEA APAC Alcoholic Drinks Industry Revenue (Million), by Country 2024 & 2032
- Figure 13: MEA APAC Alcoholic Drinks Industry Revenue Share (%), by Country 2024 & 2032
- Figure 14: China APAC Alcoholic Drinks Industry Revenue (Million), by Product Type 2024 & 2032
- Figure 15: China APAC Alcoholic Drinks Industry Revenue Share (%), by Product Type 2024 & 2032
- Figure 16: China APAC Alcoholic Drinks Industry Revenue (Million), by Distribution Channel 2024 & 2032
- Figure 17: China APAC Alcoholic Drinks Industry Revenue Share (%), by Distribution Channel 2024 & 2032
- Figure 18: China APAC Alcoholic Drinks Industry Revenue (Million), by Geography 2024 & 2032
- Figure 19: China APAC Alcoholic Drinks Industry Revenue Share (%), by Geography 2024 & 2032
- Figure 20: China APAC Alcoholic Drinks Industry Revenue (Million), by Country 2024 & 2032
- Figure 21: China APAC Alcoholic Drinks Industry Revenue Share (%), by Country 2024 & 2032
- Figure 22: Japan APAC Alcoholic Drinks Industry Revenue (Million), by Product Type 2024 & 2032
- Figure 23: Japan APAC Alcoholic Drinks Industry Revenue Share (%), by Product Type 2024 & 2032
- Figure 24: Japan APAC Alcoholic Drinks Industry Revenue (Million), by Distribution Channel 2024 & 2032
- Figure 25: Japan APAC Alcoholic Drinks Industry Revenue Share (%), by Distribution Channel 2024 & 2032
- Figure 26: Japan APAC Alcoholic Drinks Industry Revenue (Million), by Geography 2024 & 2032
- Figure 27: Japan APAC Alcoholic Drinks Industry Revenue Share (%), by Geography 2024 & 2032
- Figure 28: Japan APAC Alcoholic Drinks Industry Revenue (Million), by Country 2024 & 2032
- Figure 29: Japan APAC Alcoholic Drinks Industry Revenue Share (%), by Country 2024 & 2032
- Figure 30: India APAC Alcoholic Drinks Industry Revenue (Million), by Product Type 2024 & 2032
- Figure 31: India APAC Alcoholic Drinks Industry Revenue Share (%), by Product Type 2024 & 2032
- Figure 32: India APAC Alcoholic Drinks Industry Revenue (Million), by Distribution Channel 2024 & 2032
- Figure 33: India APAC Alcoholic Drinks Industry Revenue Share (%), by Distribution Channel 2024 & 2032
- Figure 34: India APAC Alcoholic Drinks Industry Revenue (Million), by Geography 2024 & 2032
- Figure 35: India APAC Alcoholic Drinks Industry Revenue Share (%), by Geography 2024 & 2032
- Figure 36: India APAC Alcoholic Drinks Industry Revenue (Million), by Country 2024 & 2032
- Figure 37: India APAC Alcoholic Drinks Industry Revenue Share (%), by Country 2024 & 2032
- Figure 38: Australia APAC Alcoholic Drinks Industry Revenue (Million), by Product Type 2024 & 2032
- Figure 39: Australia APAC Alcoholic Drinks Industry Revenue Share (%), by Product Type 2024 & 2032
- Figure 40: Australia APAC Alcoholic Drinks Industry Revenue (Million), by Distribution Channel 2024 & 2032
- Figure 41: Australia APAC Alcoholic Drinks Industry Revenue Share (%), by Distribution Channel 2024 & 2032
- Figure 42: Australia APAC Alcoholic Drinks Industry Revenue (Million), by Geography 2024 & 2032
- Figure 43: Australia APAC Alcoholic Drinks Industry Revenue Share (%), by Geography 2024 & 2032
- Figure 44: Australia APAC Alcoholic Drinks Industry Revenue (Million), by Country 2024 & 2032
- Figure 45: Australia APAC Alcoholic Drinks Industry Revenue Share (%), by Country 2024 & 2032
- Figure 46: Rest of Asia Pacific APAC Alcoholic Drinks Industry Revenue (Million), by Product Type 2024 & 2032
- Figure 47: Rest of Asia Pacific APAC Alcoholic Drinks Industry Revenue Share (%), by Product Type 2024 & 2032
- Figure 48: Rest of Asia Pacific APAC Alcoholic Drinks Industry Revenue (Million), by Distribution Channel 2024 & 2032
- Figure 49: Rest of Asia Pacific APAC Alcoholic Drinks Industry Revenue Share (%), by Distribution Channel 2024 & 2032
- Figure 50: Rest of Asia Pacific APAC Alcoholic Drinks Industry Revenue (Million), by Geography 2024 & 2032
- Figure 51: Rest of Asia Pacific APAC Alcoholic Drinks Industry Revenue Share (%), by Geography 2024 & 2032
- Figure 52: Rest of Asia Pacific APAC Alcoholic Drinks Industry Revenue (Million), by Country 2024 & 2032
- Figure 53: Rest of Asia Pacific APAC Alcoholic Drinks Industry Revenue Share (%), by Country 2024 & 2032
List of Tables
- Table 1: Global APAC Alcoholic Drinks Industry Revenue Million Forecast, by Region 2019 & 2032
- Table 2: Global APAC Alcoholic Drinks Industry Revenue Million Forecast, by Product Type 2019 & 2032
- Table 3: Global APAC Alcoholic Drinks Industry Revenue Million Forecast, by Distribution Channel 2019 & 2032
- Table 4: Global APAC Alcoholic Drinks Industry Revenue Million Forecast, by Geography 2019 & 2032
- Table 5: Global APAC Alcoholic Drinks Industry Revenue Million Forecast, by Region 2019 & 2032
- Table 6: Global APAC Alcoholic Drinks Industry Revenue Million Forecast, by Country 2019 & 2032
- Table 7: United States APAC Alcoholic Drinks Industry Revenue (Million) Forecast, by Application 2019 & 2032
- Table 8: Canada APAC Alcoholic Drinks Industry Revenue (Million) Forecast, by Application 2019 & 2032
- Table 9: Mexico APAC Alcoholic Drinks Industry Revenue (Million) Forecast, by Application 2019 & 2032
- Table 10: Global APAC Alcoholic Drinks Industry Revenue Million Forecast, by Country 2019 & 2032
- Table 11: Germany APAC Alcoholic Drinks Industry Revenue (Million) Forecast, by Application 2019 & 2032
- Table 12: United Kingdom APAC Alcoholic Drinks Industry Revenue (Million) Forecast, by Application 2019 & 2032
- Table 13: France APAC Alcoholic Drinks Industry Revenue (Million) Forecast, by Application 2019 & 2032
- Table 14: Spain APAC Alcoholic Drinks Industry Revenue (Million) Forecast, by Application 2019 & 2032
- Table 15: Italy APAC Alcoholic Drinks Industry Revenue (Million) Forecast, by Application 2019 & 2032
- Table 16: Spain APAC Alcoholic Drinks Industry Revenue (Million) Forecast, by Application 2019 & 2032
- Table 17: Belgium APAC Alcoholic Drinks Industry Revenue (Million) Forecast, by Application 2019 & 2032
- Table 18: Netherland APAC Alcoholic Drinks Industry Revenue (Million) Forecast, by Application 2019 & 2032
- Table 19: Nordics APAC Alcoholic Drinks Industry Revenue (Million) Forecast, by Application 2019 & 2032
- Table 20: Rest of Europe APAC Alcoholic Drinks Industry Revenue (Million) Forecast, by Application 2019 & 2032
- Table 21: Global APAC Alcoholic Drinks Industry Revenue Million Forecast, by Country 2019 & 2032
- Table 22: China APAC Alcoholic Drinks Industry Revenue (Million) Forecast, by Application 2019 & 2032
- Table 23: Japan APAC Alcoholic Drinks Industry Revenue (Million) Forecast, by Application 2019 & 2032
- Table 24: India APAC Alcoholic Drinks Industry Revenue (Million) Forecast, by Application 2019 & 2032
- Table 25: South Korea APAC Alcoholic Drinks Industry Revenue (Million) Forecast, by Application 2019 & 2032
- Table 26: Southeast Asia APAC Alcoholic Drinks Industry Revenue (Million) Forecast, by Application 2019 & 2032
- Table 27: Australia APAC Alcoholic Drinks Industry Revenue (Million) Forecast, by Application 2019 & 2032
- Table 28: Indonesia APAC Alcoholic Drinks Industry Revenue (Million) Forecast, by Application 2019 & 2032
- Table 29: Phillipes APAC Alcoholic Drinks Industry Revenue (Million) Forecast, by Application 2019 & 2032
- Table 30: Singapore APAC Alcoholic Drinks Industry Revenue (Million) Forecast, by Application 2019 & 2032
- Table 31: Thailandc APAC Alcoholic Drinks Industry Revenue (Million) Forecast, by Application 2019 & 2032
- Table 32: Rest of Asia Pacific APAC Alcoholic Drinks Industry Revenue (Million) Forecast, by Application 2019 & 2032
- Table 33: Global APAC Alcoholic Drinks Industry Revenue Million Forecast, by Country 2019 & 2032
- Table 34: Brazil APAC Alcoholic Drinks Industry Revenue (Million) Forecast, by Application 2019 & 2032
- Table 35: Argentina APAC Alcoholic Drinks Industry Revenue (Million) Forecast, by Application 2019 & 2032
- Table 36: Peru APAC Alcoholic Drinks Industry Revenue (Million) Forecast, by Application 2019 & 2032
- Table 37: Chile APAC Alcoholic Drinks Industry Revenue (Million) Forecast, by Application 2019 & 2032
- Table 38: Colombia APAC Alcoholic Drinks Industry Revenue (Million) Forecast, by Application 2019 & 2032
- Table 39: Ecuador APAC Alcoholic Drinks Industry Revenue (Million) Forecast, by Application 2019 & 2032
- Table 40: Venezuela APAC Alcoholic Drinks Industry Revenue (Million) Forecast, by Application 2019 & 2032
- Table 41: Rest of South America APAC Alcoholic Drinks Industry Revenue (Million) Forecast, by Application 2019 & 2032
- Table 42: Global APAC Alcoholic Drinks Industry Revenue Million Forecast, by Country 2019 & 2032
- Table 43: United States APAC Alcoholic Drinks Industry Revenue (Million) Forecast, by Application 2019 & 2032
- Table 44: Canada APAC Alcoholic Drinks Industry Revenue (Million) Forecast, by Application 2019 & 2032
- Table 45: Mexico APAC Alcoholic Drinks Industry Revenue (Million) Forecast, by Application 2019 & 2032
- Table 46: Global APAC Alcoholic Drinks Industry Revenue Million Forecast, by Country 2019 & 2032
- Table 47: United Arab Emirates APAC Alcoholic Drinks Industry Revenue (Million) Forecast, by Application 2019 & 2032
- Table 48: Saudi Arabia APAC Alcoholic Drinks Industry Revenue (Million) Forecast, by Application 2019 & 2032
- Table 49: South Africa APAC Alcoholic Drinks Industry Revenue (Million) Forecast, by Application 2019 & 2032
- Table 50: Rest of Middle East and Africa APAC Alcoholic Drinks Industry Revenue (Million) Forecast, by Application 2019 & 2032
- Table 51: Global APAC Alcoholic Drinks Industry Revenue Million Forecast, by Product Type 2019 & 2032
- Table 52: Global APAC Alcoholic Drinks Industry Revenue Million Forecast, by Distribution Channel 2019 & 2032
- Table 53: Global APAC Alcoholic Drinks Industry Revenue Million Forecast, by Geography 2019 & 2032
- Table 54: Global APAC Alcoholic Drinks Industry Revenue Million Forecast, by Country 2019 & 2032
- Table 55: Global APAC Alcoholic Drinks Industry Revenue Million Forecast, by Product Type 2019 & 2032
- Table 56: Global APAC Alcoholic Drinks Industry Revenue Million Forecast, by Distribution Channel 2019 & 2032
- Table 57: Global APAC Alcoholic Drinks Industry Revenue Million Forecast, by Geography 2019 & 2032
- Table 58: Global APAC Alcoholic Drinks Industry Revenue Million Forecast, by Country 2019 & 2032
- Table 59: Global APAC Alcoholic Drinks Industry Revenue Million Forecast, by Product Type 2019 & 2032
- Table 60: Global APAC Alcoholic Drinks Industry Revenue Million Forecast, by Distribution Channel 2019 & 2032
- Table 61: Global APAC Alcoholic Drinks Industry Revenue Million Forecast, by Geography 2019 & 2032
- Table 62: Global APAC Alcoholic Drinks Industry Revenue Million Forecast, by Country 2019 & 2032
- Table 63: Global APAC Alcoholic Drinks Industry Revenue Million Forecast, by Product Type 2019 & 2032
- Table 64: Global APAC Alcoholic Drinks Industry Revenue Million Forecast, by Distribution Channel 2019 & 2032
- Table 65: Global APAC Alcoholic Drinks Industry Revenue Million Forecast, by Geography 2019 & 2032
- Table 66: Global APAC Alcoholic Drinks Industry Revenue Million Forecast, by Country 2019 & 2032
- Table 67: Global APAC Alcoholic Drinks Industry Revenue Million Forecast, by Product Type 2019 & 2032
- Table 68: Global APAC Alcoholic Drinks Industry Revenue Million Forecast, by Distribution Channel 2019 & 2032
- Table 69: Global APAC Alcoholic Drinks Industry Revenue Million Forecast, by Geography 2019 & 2032
- Table 70: Global APAC Alcoholic Drinks Industry Revenue Million Forecast, by Country 2019 & 2032
Frequently Asked Questions
1. What is the projected Compound Annual Growth Rate (CAGR) of the APAC Alcoholic Drinks Industry?
The projected CAGR is approximately 5.22%.
2. Which companies are prominent players in the APAC Alcoholic Drinks Industry?
Key companies in the market include Heineken Holding NV, Anheuser-Busch InBev, Pernod Ricard*List Not Exhaustive, Radico Khaitan, Bacardi Limited, Suntory Beverages & Food Limited, Brown-Forman, Molson Coors Brewing Company, Diageo PLC, The Wine Group LLC.
3. What are the main segments of the APAC Alcoholic Drinks Industry?
The market segments include Product Type, Distribution Channel, Geography.
4. Can you provide details about the market size?
The market size is estimated to be USD XX Million as of 2022.
5. What are some drivers contributing to market growth?
Convenience Offered By Online Food Delivery Services; Attractive Offers And Memberships Along With Advertisements And Marketing By Players.
6. What are the notable trends driving market growth?
Rising Demand for Cocktails and Other Mixed Drinks.
7. Are there any restraints impacting market growth?
Consumers Desire For Fine Dining Experience.
8. Can you provide examples of recent developments in the market?
In April 2022, Diageo India launched a new single malt whisky and two mixers for its Johnnie Walker and Black & White Scotch brands. The new whisky was created using Rajasthan-specific six-row barley grains and was aged at a heat of more than 100°F.
9. What pricing options are available for accessing the report?
Pricing options include single-user, multi-user, and enterprise licenses priced at USD 4750, USD 5250, and USD 8750 respectively.
10. Is the market size provided in terms of value or volume?
The market size is provided in terms of value, measured in Million.
11. Are there any specific market keywords associated with the report?
Yes, the market keyword associated with the report is "APAC Alcoholic Drinks Industry," which aids in identifying and referencing the specific market segment covered.
12. How do I determine which pricing option suits my needs best?
The pricing options vary based on user requirements and access needs. Individual users may opt for single-user licenses, while businesses requiring broader access may choose multi-user or enterprise licenses for cost-effective access to the report.
13. Are there any additional resources or data provided in the APAC Alcoholic Drinks Industry report?
While the report offers comprehensive insights, it's advisable to review the specific contents or supplementary materials provided to ascertain if additional resources or data are available.
14. How can I stay updated on further developments or reports in the APAC Alcoholic Drinks Industry?
To stay informed about further developments, trends, and reports in the APAC Alcoholic Drinks Industry, consider subscribing to industry newsletters, following relevant companies and organizations, or regularly checking reputable industry news sources and publications.
Methodology
Step 1 - Identification of Relevant Samples Size from Population Database


Step 2 - Approaches for Defining Global Market Size (Value, Volume* & Price*)

Note*: In applicable scenarios
Step 3 - Data Sources
Primary Research
- Web Analytics
- Survey Reports
- Research Institute
- Latest Research Reports
- Opinion Leaders
Secondary Research
- Annual Reports
- White Paper
- Latest Press Release
- Industry Association
- Paid Database
- Investor Presentations

Step 4 - Data Triangulation
Involves using different sources of information in order to increase the validity of a study
These sources are likely to be stakeholders in a program - participants, other researchers, program staff, other community members, and so on.
Then we put all data in single framework & apply various statistical tools to find out the dynamic on the market.
During the analysis stage, feedback from the stakeholder groups would be compared to determine areas of agreement as well as areas of divergence
