

Key Insights
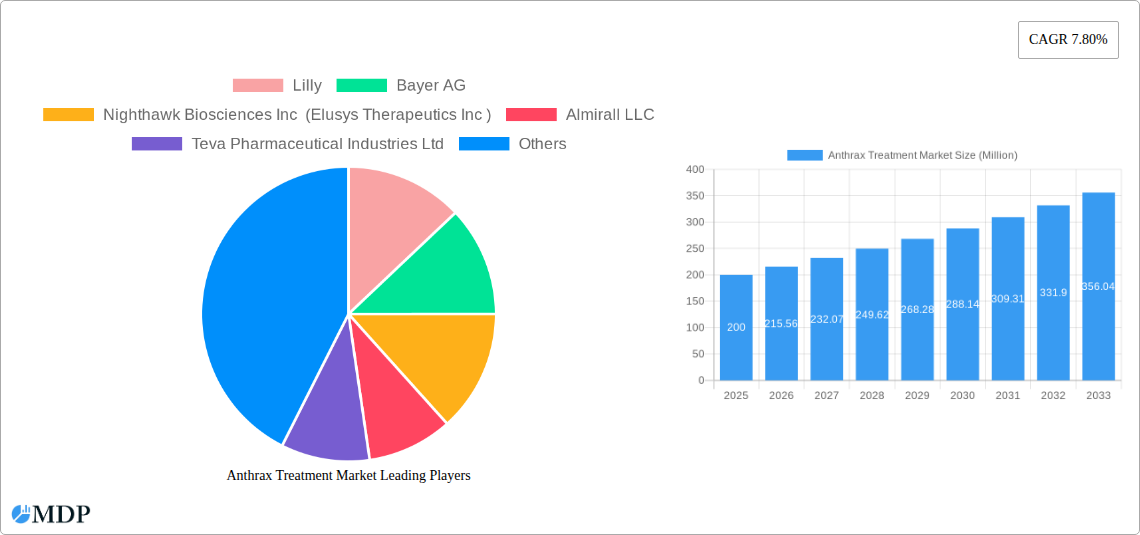
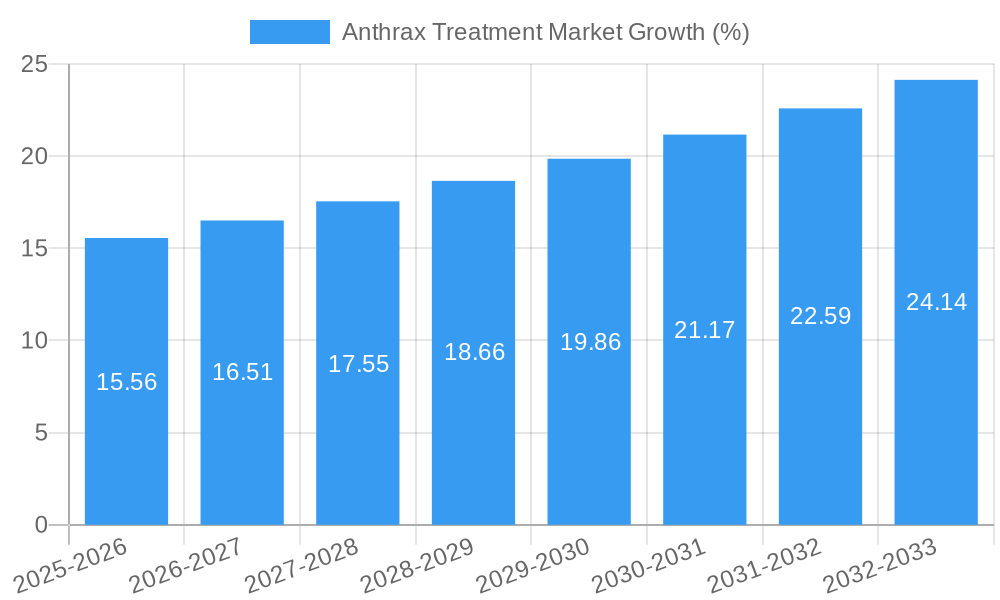
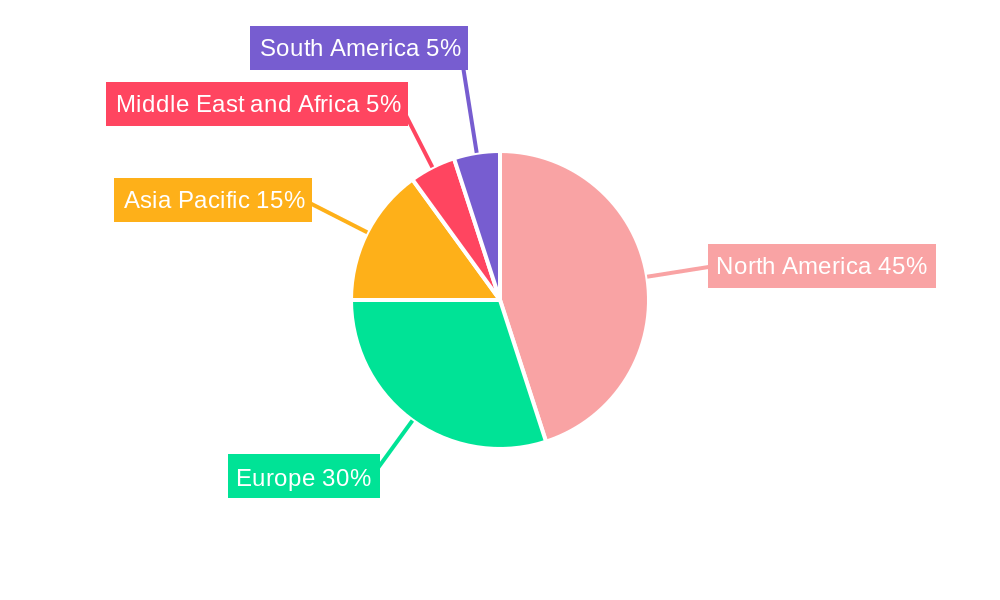
The Anthrax Treatment Market, valued at approximately $XX million in 2025, is projected to experience robust growth, driven by a compound annual growth rate (CAGR) of 7.80% from 2025 to 2033. This expansion is fueled by several key factors. Increased bioterrorism concerns and the potential for anthrax outbreaks necessitate a robust and readily available treatment landscape. The market's segmentation reflects this need, with antibiotics like ciprofloxacin and doxycycline dominating the drug class segment due to their established efficacy and widespread use. Immunoglobulins also play a significant role, offering passive immunity crucial in severe cases. Hospitals remain the primary distribution channel, underscoring the critical nature of anthrax treatment requiring immediate medical intervention. The geographic distribution mirrors global health priorities, with North America and Europe holding substantial market shares due to advanced healthcare infrastructure and robust preparedness programs. However, growth in the Asia-Pacific region is expected to be significant, driven by increasing healthcare expenditure and rising awareness of bioterrorism threats. Market restraints include the relative rarity of anthrax cases in many regions leading to lower overall demand and the potential for antibiotic resistance, necessitating ongoing research and development into newer, more effective treatments.
The diverse anthrax types – cutaneous, inhalation, gastrointestinal, and injection – present unique challenges and treatment pathways, influencing the market segmentation. While cutaneous anthrax often responds well to antibiotic therapy alone, inhalation anthrax, considered the most lethal form, necessitates a more aggressive and often combined treatment approach. This complexity contributes to the market's ongoing evolution, with pharmaceutical companies like Lilly, Bayer AG, and others actively investing in research and development to improve existing therapies and explore novel treatment options. The forecast period, 2025-2033, promises continued growth, driven by both proactive preparedness measures and the potential for future outbreaks. The market's expansion hinges on sustained investment in research, improved diagnostic capabilities, and effective public health strategies aimed at mitigating the risk of anthrax exposure. Government funding and collaborations between public health organizations and pharmaceutical companies will continue to shape the market's trajectory.
Anthrax Treatment Market: A Comprehensive Report (2019-2033)
This comprehensive report provides an in-depth analysis of the Anthrax Treatment Market, covering market dynamics, industry trends, leading segments, and key players. With a study period spanning 2019-2033, a base year of 2025, and a forecast period of 2025-2033, this report offers invaluable insights for stakeholders seeking to navigate this crucial sector. The market size is estimated at xx Million in 2025 and is projected to reach xx Million by 2033, exhibiting a CAGR of xx%.
Anthrax Treatment Market Market Dynamics & Concentration
The Anthrax Treatment Market is characterized by a moderate level of concentration, with a few major players holding significant market share. Innovation is driven by the need for more effective and readily available treatments, particularly for inhalation anthrax. Stringent regulatory frameworks, such as those overseen by the FDA and EMA, significantly influence product development and market entry. The market faces limited substitution, with existing treatments largely focused on antibiotics and immunoglobulins. End-user trends reflect a growing emphasis on preparedness and response strategies for bioterrorism and naturally occurring anthrax outbreaks.
- Market Concentration: The top 5 players account for approximately xx% of the market share in 2025.
- Innovation Drivers: Development of novel therapeutics with improved efficacy and reduced side effects.
- Regulatory Landscape: Stringent approval processes and safety regulations shape market dynamics.
- M&A Activity: A total of xx M&A deals were observed during the historical period (2019-2024), indicating a moderate level of consolidation. The acquisition of Elusys Therapeutics by NightHawk Biosciences in 2022 highlights strategic moves in the market.
Anthrax Treatment Market Industry Trends & Analysis
The Anthrax Treatment Market is experiencing growth driven by increasing government funding for biodefense initiatives, rising awareness of anthrax threats (both natural and bioterrorism-related), and advancements in therapeutic development. Technological disruptions are primarily focused on improving the efficacy and delivery methods of existing treatments. Consumer preferences heavily favor treatments with minimal side effects and rapid onset of action. Competitive dynamics are shaped by the balance between established players with existing product portfolios and emerging companies developing innovative therapies. The market is witnessing a gradual shift towards more targeted and effective treatments, leading to increased market penetration of newer therapies.
Leading Markets & Segments in Anthrax Treatment Market
The North American region holds the dominant position in the Anthrax Treatment Market, driven by high government spending on biodefense and a robust healthcare infrastructure. Within the drug classes, Antibiotics currently hold the largest market share, followed by Immunoglobulins. Hospitals represent the primary distribution channel. Inhalation anthrax accounts for the largest segment within the Anthrax Type category.
- Key Drivers for North American Dominance:
- High levels of government funding for biodefense initiatives.
- Robust healthcare infrastructure and well-established distribution networks.
- Advanced research and development capabilities.
- Segment Dominance Analysis:
- Drug Class: Antibiotics dominate due to established efficacy and widespread availability.
- Distribution Channel: Hospitals are the primary route due to the need for specialized administration.
- Anthrax Type: Inhalation anthrax commands the largest share due to its high mortality rate and the associated need for rapid and effective treatment.
Anthrax Treatment Market Product Developments
Recent product developments focus on improving the efficacy, safety, and ease of administration of anthrax treatments. This includes advancements in antibiotic formulations and the development of novel immunotherapies. Key competitive advantages stem from superior efficacy, reduced side effects, and convenient administration methods. Technological trends point towards personalized medicine approaches and targeted therapies to enhance treatment outcomes.
Key Drivers of Anthrax Treatment Market Growth
The Anthrax Treatment Market is fueled by several key factors:
- Increased government funding for biodefense: Significant investments in preparedness and response programs drive demand for effective treatments.
- Technological advancements: Development of newer, more effective therapies with improved safety profiles.
- Rising awareness of anthrax threats: Both naturally occurring outbreaks and the potential for bioterrorism contribute to market growth.
Challenges in the Anthrax Treatment Market Market
The market faces several challenges:
- Stringent regulatory requirements: The lengthy and complex approval processes for new treatments can delay market entry.
- Supply chain disruptions: Potential interruptions in the supply of raw materials or finished products can impact availability.
- Competition from existing and emerging players: The market is relatively concentrated, creating competitive pressure among established players and new entrants.
Emerging Opportunities in Anthrax Treatment Market
Significant opportunities exist in the Anthrax Treatment Market:
- Development of novel therapies: The continued pursuit of more effective and safer treatments will drive market growth.
- Strategic partnerships and collaborations: Joint ventures between pharmaceutical companies and research institutions can accelerate innovation.
- Expansion into emerging markets: Growing awareness and preparedness in developing countries presents untapped market potential.
Leading Players in the Anthrax Treatment Market Sector
- Lilly
- Bayer AG
- Nighthawk Biosciences Inc (Elusys Therapeutics Inc)
- Almirall LLC
- Teva Pharmaceutical Industries Ltd
- Emergent
- GSK plc
- Paratek Pharmaceuticals Inc
- Pfizer Inc
Key Milestones in Anthrax Treatment Market Industry
- April 2022: NightHawk Biosciences acquires Elusys Therapeutics, bolstering its anthrax treatment portfolio with ANTHIM (obiltoxaximab).
- January 2022: Elusys Therapeutics secures a contract with the US Department of Health and Human Services (HHS) for continued supply of ANTHIM.
Strategic Outlook for Anthrax Treatment Market Market
The Anthrax Treatment Market is poised for continued growth, driven by ongoing research and development, increasing government investment, and heightened global awareness of anthrax threats. Strategic opportunities lie in developing innovative therapies, forging strategic partnerships, and expanding market access to underserved regions. The market will likely see a consolidation phase, driven by the need for players to broaden their product portfolios and build resilience.
Anthrax Treatment Market Segmentation
-
1. Anthrax Type
- 1.1. Cutaneous Anthrax
- 1.2. Inhalation Anthrax
- 1.3. Gastrointestinal Anthrax
- 1.4. Injection Anthrax
-
2. Drug Class
- 2.1. Antibiotics
- 2.2. Immunoglobulins
- 2.3. Others
-
3. Distribution Channel
- 3.1. Hospitals
- 3.2. Pharmacies
- 3.3. Other Distribution Channels
Anthrax Treatment Market Segmentation By Geography
-
1. North America
- 1.1. United States
- 1.2. Canada
- 1.3. Mexico
-
2. Europe
- 2.1. Germany
- 2.2. United Kingdom
- 2.3. France
- 2.4. Italy
- 2.5. Spain
- 2.6. Rest of Europe
-
3. Asia Pacific
- 3.1. China
- 3.2. Japan
- 3.3. India
- 3.4. Australia
- 3.5. South Korea
- 3.6. Rest of Asia Pacific
-
4. Middle East and Africa
- 4.1. GCC
- 4.2. South Africa
- 4.3. Rest of Middle East and Africa
-
5. South America
- 5.1. Brazil
- 5.2. Argentina
- 5.3. Rest of South America
Anthrax Treatment Market REPORT HIGHLIGHTS
| Aspects | Details |
|---|---|
| Study Period | 2019-2033 |
| Base Year | 2024 |
| Estimated Year | 2025 |
| Forecast Period | 2025-2033 |
| Historical Period | 2019-2024 |
| Growth Rate | CAGR of 7.80% from 2019-2033 |
| Segmentation |
|
Table of Contents
- 1. Introduction
- 1.1. Research Scope
- 1.2. Market Segmentation
- 1.3. Research Methodology
- 1.4. Definitions and Assumptions
- 2. Executive Summary
- 2.1. Introduction
- 3. Market Dynamics
- 3.1. Introduction
- 3.2. Market Drivers
- 3.2.1. Increase in Research Funding; Development of Novel Therapies for Treatment of Anthrax
- 3.3. Market Restrains
- 3.3.1. High Cost Associated with Diagnostic Treatment
- 3.4. Market Trends
- 3.4.1. Inhalation Anthrax Segment is Expected to Dominate During the Forecast Period
- 4. Market Factor Analysis
- 4.1. Porters Five Forces
- 4.2. Supply/Value Chain
- 4.3. PESTEL analysis
- 4.4. Market Entropy
- 4.5. Patent/Trademark Analysis
- 5. Global Anthrax Treatment Market Analysis, Insights and Forecast, 2019-2031
- 5.1. Market Analysis, Insights and Forecast - by Anthrax Type
- 5.1.1. Cutaneous Anthrax
- 5.1.2. Inhalation Anthrax
- 5.1.3. Gastrointestinal Anthrax
- 5.1.4. Injection Anthrax
- 5.2. Market Analysis, Insights and Forecast - by Drug Class
- 5.2.1. Antibiotics
- 5.2.2. Immunoglobulins
- 5.2.3. Others
- 5.3. Market Analysis, Insights and Forecast - by Distribution Channel
- 5.3.1. Hospitals
- 5.3.2. Pharmacies
- 5.3.3. Other Distribution Channels
- 5.4. Market Analysis, Insights and Forecast - by Region
- 5.4.1. North America
- 5.4.2. Europe
- 5.4.3. Asia Pacific
- 5.4.4. Middle East and Africa
- 5.4.5. South America
- 5.1. Market Analysis, Insights and Forecast - by Anthrax Type
- 6. North America Anthrax Treatment Market Analysis, Insights and Forecast, 2019-2031
- 6.1. Market Analysis, Insights and Forecast - by Anthrax Type
- 6.1.1. Cutaneous Anthrax
- 6.1.2. Inhalation Anthrax
- 6.1.3. Gastrointestinal Anthrax
- 6.1.4. Injection Anthrax
- 6.2. Market Analysis, Insights and Forecast - by Drug Class
- 6.2.1. Antibiotics
- 6.2.2. Immunoglobulins
- 6.2.3. Others
- 6.3. Market Analysis, Insights and Forecast - by Distribution Channel
- 6.3.1. Hospitals
- 6.3.2. Pharmacies
- 6.3.3. Other Distribution Channels
- 6.1. Market Analysis, Insights and Forecast - by Anthrax Type
- 7. Europe Anthrax Treatment Market Analysis, Insights and Forecast, 2019-2031
- 7.1. Market Analysis, Insights and Forecast - by Anthrax Type
- 7.1.1. Cutaneous Anthrax
- 7.1.2. Inhalation Anthrax
- 7.1.3. Gastrointestinal Anthrax
- 7.1.4. Injection Anthrax
- 7.2. Market Analysis, Insights and Forecast - by Drug Class
- 7.2.1. Antibiotics
- 7.2.2. Immunoglobulins
- 7.2.3. Others
- 7.3. Market Analysis, Insights and Forecast - by Distribution Channel
- 7.3.1. Hospitals
- 7.3.2. Pharmacies
- 7.3.3. Other Distribution Channels
- 7.1. Market Analysis, Insights and Forecast - by Anthrax Type
- 8. Asia Pacific Anthrax Treatment Market Analysis, Insights and Forecast, 2019-2031
- 8.1. Market Analysis, Insights and Forecast - by Anthrax Type
- 8.1.1. Cutaneous Anthrax
- 8.1.2. Inhalation Anthrax
- 8.1.3. Gastrointestinal Anthrax
- 8.1.4. Injection Anthrax
- 8.2. Market Analysis, Insights and Forecast - by Drug Class
- 8.2.1. Antibiotics
- 8.2.2. Immunoglobulins
- 8.2.3. Others
- 8.3. Market Analysis, Insights and Forecast - by Distribution Channel
- 8.3.1. Hospitals
- 8.3.2. Pharmacies
- 8.3.3. Other Distribution Channels
- 8.1. Market Analysis, Insights and Forecast - by Anthrax Type
- 9. Middle East and Africa Anthrax Treatment Market Analysis, Insights and Forecast, 2019-2031
- 9.1. Market Analysis, Insights and Forecast - by Anthrax Type
- 9.1.1. Cutaneous Anthrax
- 9.1.2. Inhalation Anthrax
- 9.1.3. Gastrointestinal Anthrax
- 9.1.4. Injection Anthrax
- 9.2. Market Analysis, Insights and Forecast - by Drug Class
- 9.2.1. Antibiotics
- 9.2.2. Immunoglobulins
- 9.2.3. Others
- 9.3. Market Analysis, Insights and Forecast - by Distribution Channel
- 9.3.1. Hospitals
- 9.3.2. Pharmacies
- 9.3.3. Other Distribution Channels
- 9.1. Market Analysis, Insights and Forecast - by Anthrax Type
- 10. South America Anthrax Treatment Market Analysis, Insights and Forecast, 2019-2031
- 10.1. Market Analysis, Insights and Forecast - by Anthrax Type
- 10.1.1. Cutaneous Anthrax
- 10.1.2. Inhalation Anthrax
- 10.1.3. Gastrointestinal Anthrax
- 10.1.4. Injection Anthrax
- 10.2. Market Analysis, Insights and Forecast - by Drug Class
- 10.2.1. Antibiotics
- 10.2.2. Immunoglobulins
- 10.2.3. Others
- 10.3. Market Analysis, Insights and Forecast - by Distribution Channel
- 10.3.1. Hospitals
- 10.3.2. Pharmacies
- 10.3.3. Other Distribution Channels
- 10.1. Market Analysis, Insights and Forecast - by Anthrax Type
- 11. North America Anthrax Treatment Market Analysis, Insights and Forecast, 2019-2031
- 11.1. Market Analysis, Insights and Forecast - By Country/Sub-region
- 11.1.1 United States
- 11.1.2 Canada
- 11.1.3 Mexico
- 12. Europe Anthrax Treatment Market Analysis, Insights and Forecast, 2019-2031
- 12.1. Market Analysis, Insights and Forecast - By Country/Sub-region
- 12.1.1 Germany
- 12.1.2 United Kingdom
- 12.1.3 France
- 12.1.4 Italy
- 12.1.5 Spain
- 12.1.6 Rest of Europe
- 13. Asia Pacific Anthrax Treatment Market Analysis, Insights and Forecast, 2019-2031
- 13.1. Market Analysis, Insights and Forecast - By Country/Sub-region
- 13.1.1 China
- 13.1.2 Japan
- 13.1.3 India
- 13.1.4 Australia
- 13.1.5 South Korea
- 13.1.6 Rest of Asia Pacific
- 14. Middle East and Africa Anthrax Treatment Market Analysis, Insights and Forecast, 2019-2031
- 14.1. Market Analysis, Insights and Forecast - By Country/Sub-region
- 14.1.1 GCC
- 14.1.2 South Africa
- 14.1.3 Rest of Middle East and Africa
- 15. South America Anthrax Treatment Market Analysis, Insights and Forecast, 2019-2031
- 15.1. Market Analysis, Insights and Forecast - By Country/Sub-region
- 15.1.1 Brazil
- 15.1.2 Argentina
- 15.1.3 Rest of South America
- 16. Competitive Analysis
- 16.1. Global Market Share Analysis 2024
- 16.2. Company Profiles
- 16.2.1 Lilly
- 16.2.1.1. Overview
- 16.2.1.2. Products
- 16.2.1.3. SWOT Analysis
- 16.2.1.4. Recent Developments
- 16.2.1.5. Financials (Based on Availability)
- 16.2.2 Bayer AG
- 16.2.2.1. Overview
- 16.2.2.2. Products
- 16.2.2.3. SWOT Analysis
- 16.2.2.4. Recent Developments
- 16.2.2.5. Financials (Based on Availability)
- 16.2.3 Nighthawk Biosciences Inc (Elusys Therapeutics Inc )
- 16.2.3.1. Overview
- 16.2.3.2. Products
- 16.2.3.3. SWOT Analysis
- 16.2.3.4. Recent Developments
- 16.2.3.5. Financials (Based on Availability)
- 16.2.4 Almirall LLC
- 16.2.4.1. Overview
- 16.2.4.2. Products
- 16.2.4.3. SWOT Analysis
- 16.2.4.4. Recent Developments
- 16.2.4.5. Financials (Based on Availability)
- 16.2.5 Teva Pharmaceutical Industries Ltd
- 16.2.5.1. Overview
- 16.2.5.2. Products
- 16.2.5.3. SWOT Analysis
- 16.2.5.4. Recent Developments
- 16.2.5.5. Financials (Based on Availability)
- 16.2.6 Emergent
- 16.2.6.1. Overview
- 16.2.6.2. Products
- 16.2.6.3. SWOT Analysis
- 16.2.6.4. Recent Developments
- 16.2.6.5. Financials (Based on Availability)
- 16.2.7 GSK plc
- 16.2.7.1. Overview
- 16.2.7.2. Products
- 16.2.7.3. SWOT Analysis
- 16.2.7.4. Recent Developments
- 16.2.7.5. Financials (Based on Availability)
- 16.2.8 Paratek Pharmaceuticals Inc
- 16.2.8.1. Overview
- 16.2.8.2. Products
- 16.2.8.3. SWOT Analysis
- 16.2.8.4. Recent Developments
- 16.2.8.5. Financials (Based on Availability)
- 16.2.9 Pfizer Inc
- 16.2.9.1. Overview
- 16.2.9.2. Products
- 16.2.9.3. SWOT Analysis
- 16.2.9.4. Recent Developments
- 16.2.9.5. Financials (Based on Availability)
- 16.2.1 Lilly
List of Figures
- Figure 1: Global Anthrax Treatment Market Revenue Breakdown (Million, %) by Region 2024 & 2032
- Figure 2: Global Anthrax Treatment Market Volume Breakdown (K Unit, %) by Region 2024 & 2032
- Figure 3: North America Anthrax Treatment Market Revenue (Million), by Country 2024 & 2032
- Figure 4: North America Anthrax Treatment Market Volume (K Unit), by Country 2024 & 2032
- Figure 5: North America Anthrax Treatment Market Revenue Share (%), by Country 2024 & 2032
- Figure 6: North America Anthrax Treatment Market Volume Share (%), by Country 2024 & 2032
- Figure 7: Europe Anthrax Treatment Market Revenue (Million), by Country 2024 & 2032
- Figure 8: Europe Anthrax Treatment Market Volume (K Unit), by Country 2024 & 2032
- Figure 9: Europe Anthrax Treatment Market Revenue Share (%), by Country 2024 & 2032
- Figure 10: Europe Anthrax Treatment Market Volume Share (%), by Country 2024 & 2032
- Figure 11: Asia Pacific Anthrax Treatment Market Revenue (Million), by Country 2024 & 2032
- Figure 12: Asia Pacific Anthrax Treatment Market Volume (K Unit), by Country 2024 & 2032
- Figure 13: Asia Pacific Anthrax Treatment Market Revenue Share (%), by Country 2024 & 2032
- Figure 14: Asia Pacific Anthrax Treatment Market Volume Share (%), by Country 2024 & 2032
- Figure 15: Middle East and Africa Anthrax Treatment Market Revenue (Million), by Country 2024 & 2032
- Figure 16: Middle East and Africa Anthrax Treatment Market Volume (K Unit), by Country 2024 & 2032
- Figure 17: Middle East and Africa Anthrax Treatment Market Revenue Share (%), by Country 2024 & 2032
- Figure 18: Middle East and Africa Anthrax Treatment Market Volume Share (%), by Country 2024 & 2032
- Figure 19: South America Anthrax Treatment Market Revenue (Million), by Country 2024 & 2032
- Figure 20: South America Anthrax Treatment Market Volume (K Unit), by Country 2024 & 2032
- Figure 21: South America Anthrax Treatment Market Revenue Share (%), by Country 2024 & 2032
- Figure 22: South America Anthrax Treatment Market Volume Share (%), by Country 2024 & 2032
- Figure 23: North America Anthrax Treatment Market Revenue (Million), by Anthrax Type 2024 & 2032
- Figure 24: North America Anthrax Treatment Market Volume (K Unit), by Anthrax Type 2024 & 2032
- Figure 25: North America Anthrax Treatment Market Revenue Share (%), by Anthrax Type 2024 & 2032
- Figure 26: North America Anthrax Treatment Market Volume Share (%), by Anthrax Type 2024 & 2032
- Figure 27: North America Anthrax Treatment Market Revenue (Million), by Drug Class 2024 & 2032
- Figure 28: North America Anthrax Treatment Market Volume (K Unit), by Drug Class 2024 & 2032
- Figure 29: North America Anthrax Treatment Market Revenue Share (%), by Drug Class 2024 & 2032
- Figure 30: North America Anthrax Treatment Market Volume Share (%), by Drug Class 2024 & 2032
- Figure 31: North America Anthrax Treatment Market Revenue (Million), by Distribution Channel 2024 & 2032
- Figure 32: North America Anthrax Treatment Market Volume (K Unit), by Distribution Channel 2024 & 2032
- Figure 33: North America Anthrax Treatment Market Revenue Share (%), by Distribution Channel 2024 & 2032
- Figure 34: North America Anthrax Treatment Market Volume Share (%), by Distribution Channel 2024 & 2032
- Figure 35: North America Anthrax Treatment Market Revenue (Million), by Country 2024 & 2032
- Figure 36: North America Anthrax Treatment Market Volume (K Unit), by Country 2024 & 2032
- Figure 37: North America Anthrax Treatment Market Revenue Share (%), by Country 2024 & 2032
- Figure 38: North America Anthrax Treatment Market Volume Share (%), by Country 2024 & 2032
- Figure 39: Europe Anthrax Treatment Market Revenue (Million), by Anthrax Type 2024 & 2032
- Figure 40: Europe Anthrax Treatment Market Volume (K Unit), by Anthrax Type 2024 & 2032
- Figure 41: Europe Anthrax Treatment Market Revenue Share (%), by Anthrax Type 2024 & 2032
- Figure 42: Europe Anthrax Treatment Market Volume Share (%), by Anthrax Type 2024 & 2032
- Figure 43: Europe Anthrax Treatment Market Revenue (Million), by Drug Class 2024 & 2032
- Figure 44: Europe Anthrax Treatment Market Volume (K Unit), by Drug Class 2024 & 2032
- Figure 45: Europe Anthrax Treatment Market Revenue Share (%), by Drug Class 2024 & 2032
- Figure 46: Europe Anthrax Treatment Market Volume Share (%), by Drug Class 2024 & 2032
- Figure 47: Europe Anthrax Treatment Market Revenue (Million), by Distribution Channel 2024 & 2032
- Figure 48: Europe Anthrax Treatment Market Volume (K Unit), by Distribution Channel 2024 & 2032
- Figure 49: Europe Anthrax Treatment Market Revenue Share (%), by Distribution Channel 2024 & 2032
- Figure 50: Europe Anthrax Treatment Market Volume Share (%), by Distribution Channel 2024 & 2032
- Figure 51: Europe Anthrax Treatment Market Revenue (Million), by Country 2024 & 2032
- Figure 52: Europe Anthrax Treatment Market Volume (K Unit), by Country 2024 & 2032
- Figure 53: Europe Anthrax Treatment Market Revenue Share (%), by Country 2024 & 2032
- Figure 54: Europe Anthrax Treatment Market Volume Share (%), by Country 2024 & 2032
- Figure 55: Asia Pacific Anthrax Treatment Market Revenue (Million), by Anthrax Type 2024 & 2032
- Figure 56: Asia Pacific Anthrax Treatment Market Volume (K Unit), by Anthrax Type 2024 & 2032
- Figure 57: Asia Pacific Anthrax Treatment Market Revenue Share (%), by Anthrax Type 2024 & 2032
- Figure 58: Asia Pacific Anthrax Treatment Market Volume Share (%), by Anthrax Type 2024 & 2032
- Figure 59: Asia Pacific Anthrax Treatment Market Revenue (Million), by Drug Class 2024 & 2032
- Figure 60: Asia Pacific Anthrax Treatment Market Volume (K Unit), by Drug Class 2024 & 2032
- Figure 61: Asia Pacific Anthrax Treatment Market Revenue Share (%), by Drug Class 2024 & 2032
- Figure 62: Asia Pacific Anthrax Treatment Market Volume Share (%), by Drug Class 2024 & 2032
- Figure 63: Asia Pacific Anthrax Treatment Market Revenue (Million), by Distribution Channel 2024 & 2032
- Figure 64: Asia Pacific Anthrax Treatment Market Volume (K Unit), by Distribution Channel 2024 & 2032
- Figure 65: Asia Pacific Anthrax Treatment Market Revenue Share (%), by Distribution Channel 2024 & 2032
- Figure 66: Asia Pacific Anthrax Treatment Market Volume Share (%), by Distribution Channel 2024 & 2032
- Figure 67: Asia Pacific Anthrax Treatment Market Revenue (Million), by Country 2024 & 2032
- Figure 68: Asia Pacific Anthrax Treatment Market Volume (K Unit), by Country 2024 & 2032
- Figure 69: Asia Pacific Anthrax Treatment Market Revenue Share (%), by Country 2024 & 2032
- Figure 70: Asia Pacific Anthrax Treatment Market Volume Share (%), by Country 2024 & 2032
- Figure 71: Middle East and Africa Anthrax Treatment Market Revenue (Million), by Anthrax Type 2024 & 2032
- Figure 72: Middle East and Africa Anthrax Treatment Market Volume (K Unit), by Anthrax Type 2024 & 2032
- Figure 73: Middle East and Africa Anthrax Treatment Market Revenue Share (%), by Anthrax Type 2024 & 2032
- Figure 74: Middle East and Africa Anthrax Treatment Market Volume Share (%), by Anthrax Type 2024 & 2032
- Figure 75: Middle East and Africa Anthrax Treatment Market Revenue (Million), by Drug Class 2024 & 2032
- Figure 76: Middle East and Africa Anthrax Treatment Market Volume (K Unit), by Drug Class 2024 & 2032
- Figure 77: Middle East and Africa Anthrax Treatment Market Revenue Share (%), by Drug Class 2024 & 2032
- Figure 78: Middle East and Africa Anthrax Treatment Market Volume Share (%), by Drug Class 2024 & 2032
- Figure 79: Middle East and Africa Anthrax Treatment Market Revenue (Million), by Distribution Channel 2024 & 2032
- Figure 80: Middle East and Africa Anthrax Treatment Market Volume (K Unit), by Distribution Channel 2024 & 2032
- Figure 81: Middle East and Africa Anthrax Treatment Market Revenue Share (%), by Distribution Channel 2024 & 2032
- Figure 82: Middle East and Africa Anthrax Treatment Market Volume Share (%), by Distribution Channel 2024 & 2032
- Figure 83: Middle East and Africa Anthrax Treatment Market Revenue (Million), by Country 2024 & 2032
- Figure 84: Middle East and Africa Anthrax Treatment Market Volume (K Unit), by Country 2024 & 2032
- Figure 85: Middle East and Africa Anthrax Treatment Market Revenue Share (%), by Country 2024 & 2032
- Figure 86: Middle East and Africa Anthrax Treatment Market Volume Share (%), by Country 2024 & 2032
- Figure 87: South America Anthrax Treatment Market Revenue (Million), by Anthrax Type 2024 & 2032
- Figure 88: South America Anthrax Treatment Market Volume (K Unit), by Anthrax Type 2024 & 2032
- Figure 89: South America Anthrax Treatment Market Revenue Share (%), by Anthrax Type 2024 & 2032
- Figure 90: South America Anthrax Treatment Market Volume Share (%), by Anthrax Type 2024 & 2032
- Figure 91: South America Anthrax Treatment Market Revenue (Million), by Drug Class 2024 & 2032
- Figure 92: South America Anthrax Treatment Market Volume (K Unit), by Drug Class 2024 & 2032
- Figure 93: South America Anthrax Treatment Market Revenue Share (%), by Drug Class 2024 & 2032
- Figure 94: South America Anthrax Treatment Market Volume Share (%), by Drug Class 2024 & 2032
- Figure 95: South America Anthrax Treatment Market Revenue (Million), by Distribution Channel 2024 & 2032
- Figure 96: South America Anthrax Treatment Market Volume (K Unit), by Distribution Channel 2024 & 2032
- Figure 97: South America Anthrax Treatment Market Revenue Share (%), by Distribution Channel 2024 & 2032
- Figure 98: South America Anthrax Treatment Market Volume Share (%), by Distribution Channel 2024 & 2032
- Figure 99: South America Anthrax Treatment Market Revenue (Million), by Country 2024 & 2032
- Figure 100: South America Anthrax Treatment Market Volume (K Unit), by Country 2024 & 2032
- Figure 101: South America Anthrax Treatment Market Revenue Share (%), by Country 2024 & 2032
- Figure 102: South America Anthrax Treatment Market Volume Share (%), by Country 2024 & 2032
List of Tables
- Table 1: Global Anthrax Treatment Market Revenue Million Forecast, by Region 2019 & 2032
- Table 2: Global Anthrax Treatment Market Volume K Unit Forecast, by Region 2019 & 2032
- Table 3: Global Anthrax Treatment Market Revenue Million Forecast, by Anthrax Type 2019 & 2032
- Table 4: Global Anthrax Treatment Market Volume K Unit Forecast, by Anthrax Type 2019 & 2032
- Table 5: Global Anthrax Treatment Market Revenue Million Forecast, by Drug Class 2019 & 2032
- Table 6: Global Anthrax Treatment Market Volume K Unit Forecast, by Drug Class 2019 & 2032
- Table 7: Global Anthrax Treatment Market Revenue Million Forecast, by Distribution Channel 2019 & 2032
- Table 8: Global Anthrax Treatment Market Volume K Unit Forecast, by Distribution Channel 2019 & 2032
- Table 9: Global Anthrax Treatment Market Revenue Million Forecast, by Region 2019 & 2032
- Table 10: Global Anthrax Treatment Market Volume K Unit Forecast, by Region 2019 & 2032
- Table 11: Global Anthrax Treatment Market Revenue Million Forecast, by Country 2019 & 2032
- Table 12: Global Anthrax Treatment Market Volume K Unit Forecast, by Country 2019 & 2032
- Table 13: United States Anthrax Treatment Market Revenue (Million) Forecast, by Application 2019 & 2032
- Table 14: United States Anthrax Treatment Market Volume (K Unit) Forecast, by Application 2019 & 2032
- Table 15: Canada Anthrax Treatment Market Revenue (Million) Forecast, by Application 2019 & 2032
- Table 16: Canada Anthrax Treatment Market Volume (K Unit) Forecast, by Application 2019 & 2032
- Table 17: Mexico Anthrax Treatment Market Revenue (Million) Forecast, by Application 2019 & 2032
- Table 18: Mexico Anthrax Treatment Market Volume (K Unit) Forecast, by Application 2019 & 2032
- Table 19: Global Anthrax Treatment Market Revenue Million Forecast, by Country 2019 & 2032
- Table 20: Global Anthrax Treatment Market Volume K Unit Forecast, by Country 2019 & 2032
- Table 21: Germany Anthrax Treatment Market Revenue (Million) Forecast, by Application 2019 & 2032
- Table 22: Germany Anthrax Treatment Market Volume (K Unit) Forecast, by Application 2019 & 2032
- Table 23: United Kingdom Anthrax Treatment Market Revenue (Million) Forecast, by Application 2019 & 2032
- Table 24: United Kingdom Anthrax Treatment Market Volume (K Unit) Forecast, by Application 2019 & 2032
- Table 25: France Anthrax Treatment Market Revenue (Million) Forecast, by Application 2019 & 2032
- Table 26: France Anthrax Treatment Market Volume (K Unit) Forecast, by Application 2019 & 2032
- Table 27: Italy Anthrax Treatment Market Revenue (Million) Forecast, by Application 2019 & 2032
- Table 28: Italy Anthrax Treatment Market Volume (K Unit) Forecast, by Application 2019 & 2032
- Table 29: Spain Anthrax Treatment Market Revenue (Million) Forecast, by Application 2019 & 2032
- Table 30: Spain Anthrax Treatment Market Volume (K Unit) Forecast, by Application 2019 & 2032
- Table 31: Rest of Europe Anthrax Treatment Market Revenue (Million) Forecast, by Application 2019 & 2032
- Table 32: Rest of Europe Anthrax Treatment Market Volume (K Unit) Forecast, by Application 2019 & 2032
- Table 33: Global Anthrax Treatment Market Revenue Million Forecast, by Country 2019 & 2032
- Table 34: Global Anthrax Treatment Market Volume K Unit Forecast, by Country 2019 & 2032
- Table 35: China Anthrax Treatment Market Revenue (Million) Forecast, by Application 2019 & 2032
- Table 36: China Anthrax Treatment Market Volume (K Unit) Forecast, by Application 2019 & 2032
- Table 37: Japan Anthrax Treatment Market Revenue (Million) Forecast, by Application 2019 & 2032
- Table 38: Japan Anthrax Treatment Market Volume (K Unit) Forecast, by Application 2019 & 2032
- Table 39: India Anthrax Treatment Market Revenue (Million) Forecast, by Application 2019 & 2032
- Table 40: India Anthrax Treatment Market Volume (K Unit) Forecast, by Application 2019 & 2032
- Table 41: Australia Anthrax Treatment Market Revenue (Million) Forecast, by Application 2019 & 2032
- Table 42: Australia Anthrax Treatment Market Volume (K Unit) Forecast, by Application 2019 & 2032
- Table 43: South Korea Anthrax Treatment Market Revenue (Million) Forecast, by Application 2019 & 2032
- Table 44: South Korea Anthrax Treatment Market Volume (K Unit) Forecast, by Application 2019 & 2032
- Table 45: Rest of Asia Pacific Anthrax Treatment Market Revenue (Million) Forecast, by Application 2019 & 2032
- Table 46: Rest of Asia Pacific Anthrax Treatment Market Volume (K Unit) Forecast, by Application 2019 & 2032
- Table 47: Global Anthrax Treatment Market Revenue Million Forecast, by Country 2019 & 2032
- Table 48: Global Anthrax Treatment Market Volume K Unit Forecast, by Country 2019 & 2032
- Table 49: GCC Anthrax Treatment Market Revenue (Million) Forecast, by Application 2019 & 2032
- Table 50: GCC Anthrax Treatment Market Volume (K Unit) Forecast, by Application 2019 & 2032
- Table 51: South Africa Anthrax Treatment Market Revenue (Million) Forecast, by Application 2019 & 2032
- Table 52: South Africa Anthrax Treatment Market Volume (K Unit) Forecast, by Application 2019 & 2032
- Table 53: Rest of Middle East and Africa Anthrax Treatment Market Revenue (Million) Forecast, by Application 2019 & 2032
- Table 54: Rest of Middle East and Africa Anthrax Treatment Market Volume (K Unit) Forecast, by Application 2019 & 2032
- Table 55: Global Anthrax Treatment Market Revenue Million Forecast, by Country 2019 & 2032
- Table 56: Global Anthrax Treatment Market Volume K Unit Forecast, by Country 2019 & 2032
- Table 57: Brazil Anthrax Treatment Market Revenue (Million) Forecast, by Application 2019 & 2032
- Table 58: Brazil Anthrax Treatment Market Volume (K Unit) Forecast, by Application 2019 & 2032
- Table 59: Argentina Anthrax Treatment Market Revenue (Million) Forecast, by Application 2019 & 2032
- Table 60: Argentina Anthrax Treatment Market Volume (K Unit) Forecast, by Application 2019 & 2032
- Table 61: Rest of South America Anthrax Treatment Market Revenue (Million) Forecast, by Application 2019 & 2032
- Table 62: Rest of South America Anthrax Treatment Market Volume (K Unit) Forecast, by Application 2019 & 2032
- Table 63: Global Anthrax Treatment Market Revenue Million Forecast, by Anthrax Type 2019 & 2032
- Table 64: Global Anthrax Treatment Market Volume K Unit Forecast, by Anthrax Type 2019 & 2032
- Table 65: Global Anthrax Treatment Market Revenue Million Forecast, by Drug Class 2019 & 2032
- Table 66: Global Anthrax Treatment Market Volume K Unit Forecast, by Drug Class 2019 & 2032
- Table 67: Global Anthrax Treatment Market Revenue Million Forecast, by Distribution Channel 2019 & 2032
- Table 68: Global Anthrax Treatment Market Volume K Unit Forecast, by Distribution Channel 2019 & 2032
- Table 69: Global Anthrax Treatment Market Revenue Million Forecast, by Country 2019 & 2032
- Table 70: Global Anthrax Treatment Market Volume K Unit Forecast, by Country 2019 & 2032
- Table 71: United States Anthrax Treatment Market Revenue (Million) Forecast, by Application 2019 & 2032
- Table 72: United States Anthrax Treatment Market Volume (K Unit) Forecast, by Application 2019 & 2032
- Table 73: Canada Anthrax Treatment Market Revenue (Million) Forecast, by Application 2019 & 2032
- Table 74: Canada Anthrax Treatment Market Volume (K Unit) Forecast, by Application 2019 & 2032
- Table 75: Mexico Anthrax Treatment Market Revenue (Million) Forecast, by Application 2019 & 2032
- Table 76: Mexico Anthrax Treatment Market Volume (K Unit) Forecast, by Application 2019 & 2032
- Table 77: Global Anthrax Treatment Market Revenue Million Forecast, by Anthrax Type 2019 & 2032
- Table 78: Global Anthrax Treatment Market Volume K Unit Forecast, by Anthrax Type 2019 & 2032
- Table 79: Global Anthrax Treatment Market Revenue Million Forecast, by Drug Class 2019 & 2032
- Table 80: Global Anthrax Treatment Market Volume K Unit Forecast, by Drug Class 2019 & 2032
- Table 81: Global Anthrax Treatment Market Revenue Million Forecast, by Distribution Channel 2019 & 2032
- Table 82: Global Anthrax Treatment Market Volume K Unit Forecast, by Distribution Channel 2019 & 2032
- Table 83: Global Anthrax Treatment Market Revenue Million Forecast, by Country 2019 & 2032
- Table 84: Global Anthrax Treatment Market Volume K Unit Forecast, by Country 2019 & 2032
- Table 85: Germany Anthrax Treatment Market Revenue (Million) Forecast, by Application 2019 & 2032
- Table 86: Germany Anthrax Treatment Market Volume (K Unit) Forecast, by Application 2019 & 2032
- Table 87: United Kingdom Anthrax Treatment Market Revenue (Million) Forecast, by Application 2019 & 2032
- Table 88: United Kingdom Anthrax Treatment Market Volume (K Unit) Forecast, by Application 2019 & 2032
- Table 89: France Anthrax Treatment Market Revenue (Million) Forecast, by Application 2019 & 2032
- Table 90: France Anthrax Treatment Market Volume (K Unit) Forecast, by Application 2019 & 2032
- Table 91: Italy Anthrax Treatment Market Revenue (Million) Forecast, by Application 2019 & 2032
- Table 92: Italy Anthrax Treatment Market Volume (K Unit) Forecast, by Application 2019 & 2032
- Table 93: Spain Anthrax Treatment Market Revenue (Million) Forecast, by Application 2019 & 2032
- Table 94: Spain Anthrax Treatment Market Volume (K Unit) Forecast, by Application 2019 & 2032
- Table 95: Rest of Europe Anthrax Treatment Market Revenue (Million) Forecast, by Application 2019 & 2032
- Table 96: Rest of Europe Anthrax Treatment Market Volume (K Unit) Forecast, by Application 2019 & 2032
- Table 97: Global Anthrax Treatment Market Revenue Million Forecast, by Anthrax Type 2019 & 2032
- Table 98: Global Anthrax Treatment Market Volume K Unit Forecast, by Anthrax Type 2019 & 2032
- Table 99: Global Anthrax Treatment Market Revenue Million Forecast, by Drug Class 2019 & 2032
- Table 100: Global Anthrax Treatment Market Volume K Unit Forecast, by Drug Class 2019 & 2032
- Table 101: Global Anthrax Treatment Market Revenue Million Forecast, by Distribution Channel 2019 & 2032
- Table 102: Global Anthrax Treatment Market Volume K Unit Forecast, by Distribution Channel 2019 & 2032
- Table 103: Global Anthrax Treatment Market Revenue Million Forecast, by Country 2019 & 2032
- Table 104: Global Anthrax Treatment Market Volume K Unit Forecast, by Country 2019 & 2032
- Table 105: China Anthrax Treatment Market Revenue (Million) Forecast, by Application 2019 & 2032
- Table 106: China Anthrax Treatment Market Volume (K Unit) Forecast, by Application 2019 & 2032
- Table 107: Japan Anthrax Treatment Market Revenue (Million) Forecast, by Application 2019 & 2032
- Table 108: Japan Anthrax Treatment Market Volume (K Unit) Forecast, by Application 2019 & 2032
- Table 109: India Anthrax Treatment Market Revenue (Million) Forecast, by Application 2019 & 2032
- Table 110: India Anthrax Treatment Market Volume (K Unit) Forecast, by Application 2019 & 2032
- Table 111: Australia Anthrax Treatment Market Revenue (Million) Forecast, by Application 2019 & 2032
- Table 112: Australia Anthrax Treatment Market Volume (K Unit) Forecast, by Application 2019 & 2032
- Table 113: South Korea Anthrax Treatment Market Revenue (Million) Forecast, by Application 2019 & 2032
- Table 114: South Korea Anthrax Treatment Market Volume (K Unit) Forecast, by Application 2019 & 2032
- Table 115: Rest of Asia Pacific Anthrax Treatment Market Revenue (Million) Forecast, by Application 2019 & 2032
- Table 116: Rest of Asia Pacific Anthrax Treatment Market Volume (K Unit) Forecast, by Application 2019 & 2032
- Table 117: Global Anthrax Treatment Market Revenue Million Forecast, by Anthrax Type 2019 & 2032
- Table 118: Global Anthrax Treatment Market Volume K Unit Forecast, by Anthrax Type 2019 & 2032
- Table 119: Global Anthrax Treatment Market Revenue Million Forecast, by Drug Class 2019 & 2032
- Table 120: Global Anthrax Treatment Market Volume K Unit Forecast, by Drug Class 2019 & 2032
- Table 121: Global Anthrax Treatment Market Revenue Million Forecast, by Distribution Channel 2019 & 2032
- Table 122: Global Anthrax Treatment Market Volume K Unit Forecast, by Distribution Channel 2019 & 2032
- Table 123: Global Anthrax Treatment Market Revenue Million Forecast, by Country 2019 & 2032
- Table 124: Global Anthrax Treatment Market Volume K Unit Forecast, by Country 2019 & 2032
- Table 125: GCC Anthrax Treatment Market Revenue (Million) Forecast, by Application 2019 & 2032
- Table 126: GCC Anthrax Treatment Market Volume (K Unit) Forecast, by Application 2019 & 2032
- Table 127: South Africa Anthrax Treatment Market Revenue (Million) Forecast, by Application 2019 & 2032
- Table 128: South Africa Anthrax Treatment Market Volume (K Unit) Forecast, by Application 2019 & 2032
- Table 129: Rest of Middle East and Africa Anthrax Treatment Market Revenue (Million) Forecast, by Application 2019 & 2032
- Table 130: Rest of Middle East and Africa Anthrax Treatment Market Volume (K Unit) Forecast, by Application 2019 & 2032
- Table 131: Global Anthrax Treatment Market Revenue Million Forecast, by Anthrax Type 2019 & 2032
- Table 132: Global Anthrax Treatment Market Volume K Unit Forecast, by Anthrax Type 2019 & 2032
- Table 133: Global Anthrax Treatment Market Revenue Million Forecast, by Drug Class 2019 & 2032
- Table 134: Global Anthrax Treatment Market Volume K Unit Forecast, by Drug Class 2019 & 2032
- Table 135: Global Anthrax Treatment Market Revenue Million Forecast, by Distribution Channel 2019 & 2032
- Table 136: Global Anthrax Treatment Market Volume K Unit Forecast, by Distribution Channel 2019 & 2032
- Table 137: Global Anthrax Treatment Market Revenue Million Forecast, by Country 2019 & 2032
- Table 138: Global Anthrax Treatment Market Volume K Unit Forecast, by Country 2019 & 2032
- Table 139: Brazil Anthrax Treatment Market Revenue (Million) Forecast, by Application 2019 & 2032
- Table 140: Brazil Anthrax Treatment Market Volume (K Unit) Forecast, by Application 2019 & 2032
- Table 141: Argentina Anthrax Treatment Market Revenue (Million) Forecast, by Application 2019 & 2032
- Table 142: Argentina Anthrax Treatment Market Volume (K Unit) Forecast, by Application 2019 & 2032
- Table 143: Rest of South America Anthrax Treatment Market Revenue (Million) Forecast, by Application 2019 & 2032
- Table 144: Rest of South America Anthrax Treatment Market Volume (K Unit) Forecast, by Application 2019 & 2032
Frequently Asked Questions
1. What is the projected Compound Annual Growth Rate (CAGR) of the Anthrax Treatment Market?
The projected CAGR is approximately 7.80%.
2. Which companies are prominent players in the Anthrax Treatment Market?
Key companies in the market include Lilly, Bayer AG, Nighthawk Biosciences Inc (Elusys Therapeutics Inc ), Almirall LLC, Teva Pharmaceutical Industries Ltd, Emergent, GSK plc, Paratek Pharmaceuticals Inc, Pfizer Inc.
3. What are the main segments of the Anthrax Treatment Market?
The market segments include Anthrax Type, Drug Class, Distribution Channel.
4. Can you provide details about the market size?
The market size is estimated to be USD XX Million as of 2022.
5. What are some drivers contributing to market growth?
Increase in Research Funding; Development of Novel Therapies for Treatment of Anthrax.
6. What are the notable trends driving market growth?
Inhalation Anthrax Segment is Expected to Dominate During the Forecast Period.
7. Are there any restraints impacting market growth?
High Cost Associated with Diagnostic Treatment.
8. Can you provide examples of recent developments in the market?
In April 2022, NightHawk Biosciences completed the acquisition of Elusys Therapeutics, Inc., a commercial-stage biodefense company and developer of ANTHIM (obiltoxaximab), a treatment for inhalation anthrax.
9. What pricing options are available for accessing the report?
Pricing options include single-user, multi-user, and enterprise licenses priced at USD 4750, USD 5250, and USD 8750 respectively.
10. Is the market size provided in terms of value or volume?
The market size is provided in terms of value, measured in Million and volume, measured in K Unit.
11. Are there any specific market keywords associated with the report?
Yes, the market keyword associated with the report is "Anthrax Treatment Market," which aids in identifying and referencing the specific market segment covered.
12. How do I determine which pricing option suits my needs best?
The pricing options vary based on user requirements and access needs. Individual users may opt for single-user licenses, while businesses requiring broader access may choose multi-user or enterprise licenses for cost-effective access to the report.
13. Are there any additional resources or data provided in the Anthrax Treatment Market report?
While the report offers comprehensive insights, it's advisable to review the specific contents or supplementary materials provided to ascertain if additional resources or data are available.
14. How can I stay updated on further developments or reports in the Anthrax Treatment Market?
To stay informed about further developments, trends, and reports in the Anthrax Treatment Market, consider subscribing to industry newsletters, following relevant companies and organizations, or regularly checking reputable industry news sources and publications.
Methodology
Step 1 - Identification of Relevant Samples Size from Population Database


Step 2 - Approaches for Defining Global Market Size (Value, Volume* & Price*)

Note*: In applicable scenarios
Step 3 - Data Sources
Primary Research
- Web Analytics
- Survey Reports
- Research Institute
- Latest Research Reports
- Opinion Leaders
Secondary Research
- Annual Reports
- White Paper
- Latest Press Release
- Industry Association
- Paid Database
- Investor Presentations

Step 4 - Data Triangulation
Involves using different sources of information in order to increase the validity of a study
These sources are likely to be stakeholders in a program - participants, other researchers, program staff, other community members, and so on.
Then we put all data in single framework & apply various statistical tools to find out the dynamic on the market.
During the analysis stage, feedback from the stakeholder groups would be compared to determine areas of agreement as well as areas of divergence
