

Key Insights
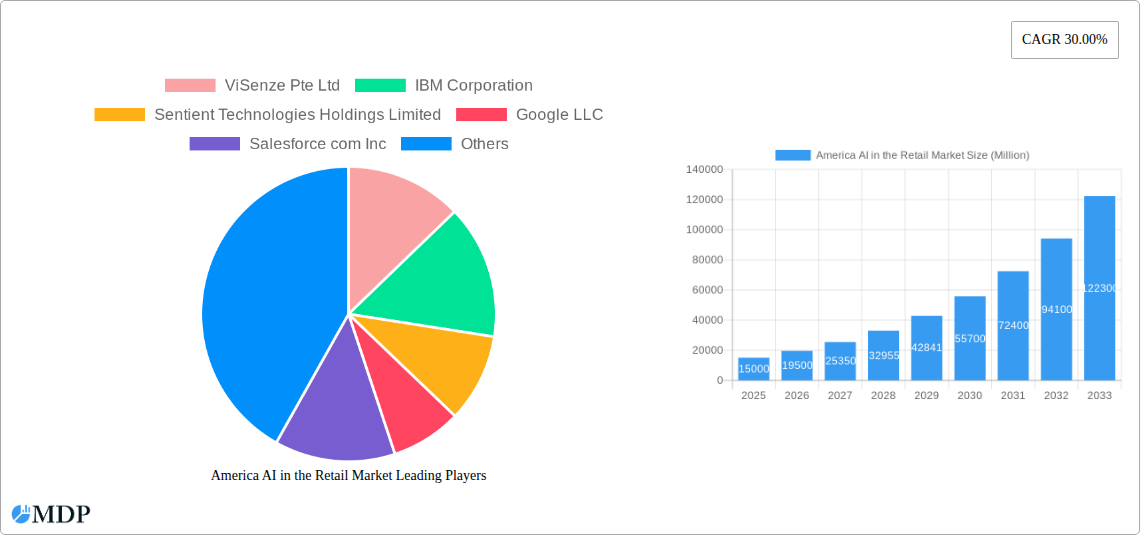
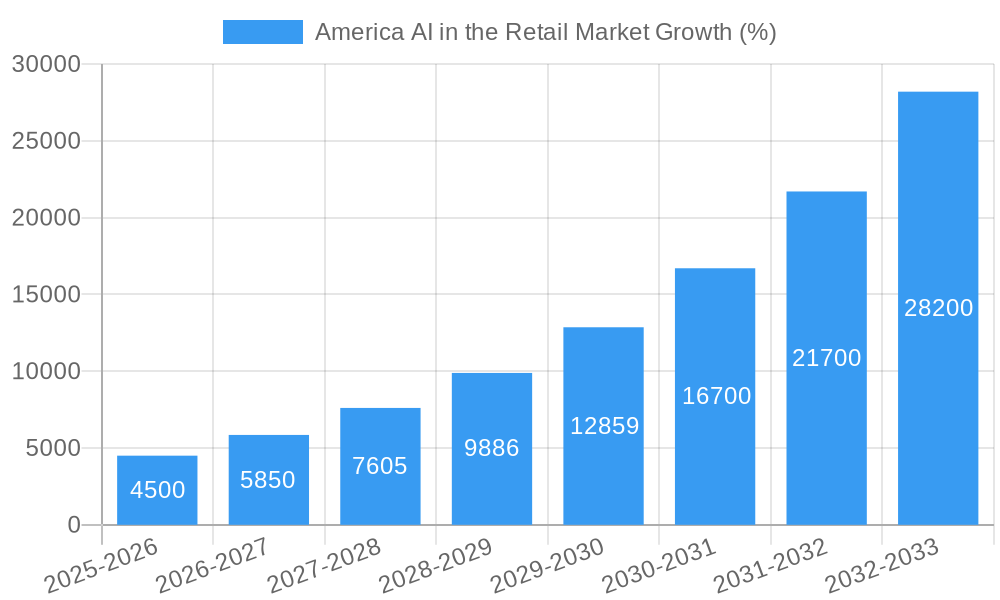
The North American AI in Retail market is experiencing explosive growth, driven by the increasing adoption of AI-powered solutions across various retail segments. A 30% CAGR (Compound Annual Growth Rate) from 2019 to 2024 suggests a significant market expansion, and projecting this trend conservatively, we can anticipate continued robust growth throughout the forecast period (2025-2033). Key drivers include the need for enhanced customer experience through personalized recommendations and targeted marketing, optimized supply chain management via predictive analytics, and fraud detection improvements leveraging machine learning. Omnichannel strategies are fueling this growth, as retailers integrate AI across online and physical stores to create seamless shopping experiences. The adoption of AI-powered solutions like chatbots for customer service, image recognition for improved search and inventory management, and predictive analytics for demand forecasting is transforming the retail landscape. While data privacy concerns and the high initial investment costs of implementing AI solutions pose some restraints, the long-term benefits in efficiency, revenue generation, and customer satisfaction significantly outweigh these challenges. The Apparel and Footwear, Food and Grocery, and Electronics and Home Appliances sectors are currently leading adoption, but growth is anticipated across all segments as the technology matures and becomes more accessible. Major technology providers like IBM, Google, and Amazon are actively contributing to this growth through robust cloud-based AI solutions.
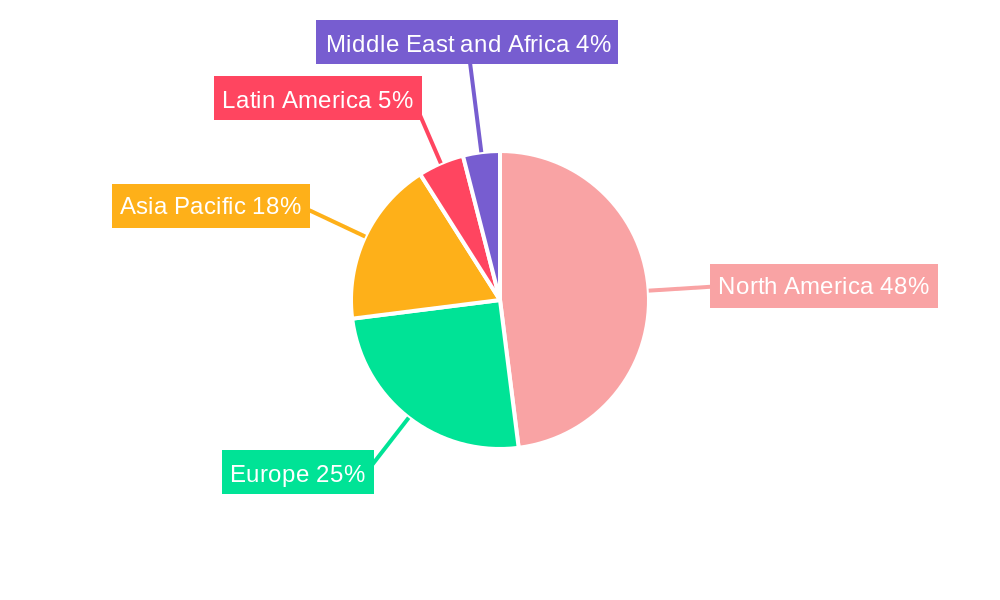
The North American market is expected to dominate globally due to high technological adoption rates, strong investment in R&D, and the presence of major retail players early adopting AI initiatives. While precise regional market share data is unavailable, North America likely holds a significant portion (estimated at 45-50%) due to its advanced technological infrastructure and established digital retail ecosystem. Europe and Asia Pacific are anticipated to follow closely, experiencing strong growth driven by increased digitalization and the expansion of e-commerce within their respective regions. The continued development and refinement of AI algorithms, including advancements in Natural Language Processing and Machine Learning, will be crucial in furthering the market’s expansion. The integration of AI with other emerging technologies, such as the Internet of Things (IoT) and blockchain, will also unlock new opportunities and drive further growth in the North American AI in Retail market.
America AI in the Retail Market: A Comprehensive Report (2019-2033)
This in-depth report provides a comprehensive analysis of the burgeoning America AI in the Retail Market, offering invaluable insights for industry stakeholders, investors, and strategists. We delve into market dynamics, technological advancements, leading players, and future growth projections, covering the period from 2019 to 2033. The report leverages extensive data analysis and expert insights to deliver actionable intelligence for navigating this rapidly evolving landscape. The market is projected to reach xx Million by 2033, presenting significant opportunities for growth and innovation.
This report covers a comprehensive study period from 2019-2033, with a base year of 2025 and a forecast period from 2025-2033. The historical period analyzed is 2019-2024.
America AI in the Retail Market Market Dynamics & Concentration
The America AI in the Retail Market is characterized by dynamic growth, driven by increasing adoption of AI-powered solutions across various retail segments. Market concentration is moderate, with several key players vying for dominance. Innovation is fueled by advancements in machine learning, natural language processing, and computer vision. Regulatory frameworks, while evolving, generally support AI adoption, albeit with ongoing discussions surrounding data privacy and algorithmic bias. Product substitutes, such as traditional manual processes, are rapidly losing ground to the efficiency and scalability offered by AI. End-user trends indicate a strong preference for personalized experiences and seamless omnichannel engagement, further propelling AI adoption. M&A activity in the sector is robust, with approximately xx deals recorded during the historical period (2019-2024), indicating a strategic focus on consolidation and expansion. Market share is currently distributed as follows (Estimated 2025):
- Amazon Web Services Inc: xx%
- Google LLC: xx%
- Microsoft Corporation: xx%
- IBM Corporation: xx%
- Others: xx%
America AI in the Retail Market Industry Trends & Analysis
The America AI in the Retail Market exhibits strong growth trajectory, driven by several key factors. The Compound Annual Growth Rate (CAGR) during the forecast period (2025-2033) is estimated to be xx%. This robust growth is fueled by increasing consumer demand for personalized shopping experiences, the need for enhanced operational efficiency, and the growing availability of sophisticated AI-powered solutions. Technological disruptions, particularly in areas such as computer vision and natural language processing, are significantly impacting the market landscape. Consumers increasingly expect personalized recommendations, targeted advertising, and seamless omnichannel integration, creating immense pressure on retailers to adopt AI-driven solutions. Competitive dynamics are characterized by both collaboration and competition, with established technology companies partnering with retail giants to integrate AI capabilities into existing infrastructure. The market penetration rate for AI in retail is projected to reach xx% by 2033.
Leading Markets & Segments in America AI in the Retail Market
The Omnichannel segment dominates the America AI in the Retail Market, driven by the need to provide consistent and personalized experiences across all touchpoints. Within the solution segment, the Cloud: Service model is leading, reflecting the scalability and cost-effectiveness of cloud-based solutions. The Apparel and Footwear application segment is a significant market driver, followed by Food and Grocery and Electronics and Home Appliances. Machine Learning is currently the most prevalent technology, underpinning many of the AI-driven solutions adopted by retailers. Key regional drivers vary:
- Omnichannel: Driven by the rise of e-commerce and consumer expectation of integrated shopping journeys.
- Software solutions: Cost-effective and readily scalable nature.
- Apparel and Footwear: High demand for personalized recommendations and inventory management.
- Machine Learning: Foundation for numerous AI-driven functions, from fraud detection to predictive analytics.
Detailed dominance analysis reveals that the key drivers for the leading segments are:
- Economic policies: Government initiatives promoting digital transformation and AI adoption.
- Infrastructure: Robust digital infrastructure supporting data-intensive AI applications.
- Consumer preferences: Increasing demand for personalized experiences and convenience.
America AI in the Retail Market Product Developments
Recent product innovations focus on enhancing personalization, improving customer service, and optimizing supply chain management. New applications include AI-powered chatbots for customer support, sophisticated recommendation engines driven by machine learning, and computer vision systems for improved inventory management and loss prevention. The competitive advantage lies in the ability to integrate AI seamlessly into existing retail operations, offering a tangible return on investment and demonstrably improved efficiency and customer experience. This focus on practical, business-relevant applications is a key driver of market growth.
Key Drivers of America AI in the Retail Market Growth
The growth of the America AI in the Retail Market is driven by a confluence of technological, economic, and regulatory factors. Advancements in machine learning and natural language processing are enabling the development of more sophisticated AI-powered solutions. The increasing availability of big data is providing valuable insights that can be leveraged to improve decision-making and personalization. Favorable economic conditions, including increased consumer spending and growing retail sector investment, are fueling adoption. Government initiatives promoting digital transformation and AI adoption are creating a supportive regulatory environment.
Challenges in the America AI in the Retail Market Market
The market faces challenges such as data privacy concerns, high implementation costs, and the need for skilled personnel to manage AI systems. Regulatory hurdles related to data security and algorithmic transparency can hinder adoption. Supply chain disruptions can impact the availability of hardware and software components necessary for AI implementation. Intense competition among technology providers and retail companies creates pressure to deliver innovative and cost-effective solutions. These factors could negatively impact the growth rate by approximately xx% by 2030.
Emerging Opportunities in America AI in the Retail Market
Emerging opportunities stem from the convergence of AI with other technologies, such as blockchain and IoT. Strategic partnerships between technology companies and retailers are creating innovative solutions that address specific market needs. Expansion into new geographic markets and the development of tailored AI solutions for niche retail segments present significant growth potential. Breakthroughs in areas such as explainable AI (XAI) and edge computing will further enhance the adoption of AI in the retail sector.
Leading Players in the America AI in the Retail Market Sector
- ViSenze Pte Ltd
- IBM Corporation
- Sentient Technologies Holdings Limited
- Google LLC
- Salesforce com Inc
- Microsoft Corporation
- Amazon Web Services Inc
- Sophos Inc (Thoma Bravo)
- Oracle Corporation
- SAP SE
Key Milestones in America AI in the Retail Market Industry
- 2020: Amazon launches its cashierless store concept, Amazon Go.
- 2021: Google Cloud unveils new AI-powered retail solutions.
- 2022: Microsoft partners with several major retailers to integrate AI-powered supply chain management solutions.
- 2023: IBM announces several new AI retail solutions, including personalized recommendation engines.
- 2024: Several mergers and acquisitions take place, consolidating the market.
Strategic Outlook for America AI in the Retail Market Market
The future of the America AI in the Retail Market is bright, with continued growth driven by ongoing technological advancements and increasing consumer adoption. Strategic opportunities lie in the development of innovative solutions that address specific market needs and enhance customer experience. Focus on personalization, enhanced customer service, and optimized supply chain management will drive success. Strategic partnerships and acquisitions will continue to shape the market landscape, leading to further consolidation and increased competition. The market’s potential is substantial, driven by the increasing digitalization of the retail sector and growing reliance on data-driven decision-making.
America AI in the Retail Market Segmentation
-
1. Channel
- 1.1. Omnichannel
- 1.2. Brick and Mortar
- 1.3. Pure-play Online Retailers
-
2. Solution
-
2.1. Software
- 2.1.1. On Premise
- 2.1.2. Cloud
- 2.2. Service
-
2.1. Software
-
3. Application
- 3.1. Apparel and Footwear
- 3.2. Food and Grocery
- 3.3. Electronics and Home Appliances
- 3.4. Home Improvement
- 3.5. Other Applications
-
4. Technology
- 4.1. Machine Learning
- 4.2. Natural Language Processing
- 4.3. Chatbots
- 4.4. Image and Video Analytics
- 4.5. Swarm Intelligence
America AI in the Retail Market Segmentation By Geography
-
1. North America
- 1.1. United States
- 1.2. Canada
- 1.3. Mexico
-
2. South America
- 2.1. Brazil
- 2.2. Argentina
- 2.3. Rest of South America
-
3. Europe
- 3.1. United Kingdom
- 3.2. Germany
- 3.3. France
- 3.4. Italy
- 3.5. Spain
- 3.6. Russia
- 3.7. Benelux
- 3.8. Nordics
- 3.9. Rest of Europe
-
4. Middle East & Africa
- 4.1. Turkey
- 4.2. Israel
- 4.3. GCC
- 4.4. North Africa
- 4.5. South Africa
- 4.6. Rest of Middle East & Africa
-
5. Asia Pacific
- 5.1. China
- 5.2. India
- 5.3. Japan
- 5.4. South Korea
- 5.5. ASEAN
- 5.6. Oceania
- 5.7. Rest of Asia Pacific
America AI in the Retail Market REPORT HIGHLIGHTS
| Aspects | Details |
|---|---|
| Study Period | 2019-2033 |
| Base Year | 2024 |
| Estimated Year | 2025 |
| Forecast Period | 2025-2033 |
| Historical Period | 2019-2024 |
| Growth Rate | CAGR of 30.00% from 2019-2033 |
| Segmentation |
|
Table of Contents
- 1. Introduction
- 1.1. Research Scope
- 1.2. Market Segmentation
- 1.3. Research Methodology
- 1.4. Definitions and Assumptions
- 2. Executive Summary
- 2.1. Introduction
- 3. Market Dynamics
- 3.1. Introduction
- 3.2. Market Drivers
- 3.2.1 ; Hardware Advancement Acting as a Key Enabler for AI in Retail; Disruptive Developments in Retail
- 3.2.2 including AR
- 3.2.3 VR
- 3.2.4 IOT
- 3.2.5 and New Metrics; Rise of AI First Organizations; Need for Efficiency in Supply Chain Optimization
- 3.3. Market Restrains
- 3.3.1 ; Lack of Professionals
- 3.3.2 as well as In-house Knowledge for Cultural Readiness
- 3.4. Market Trends
- 3.4.1. Machine Learning Technology is Expected to Grow Siginificantly
- 4. Market Factor Analysis
- 4.1. Porters Five Forces
- 4.2. Supply/Value Chain
- 4.3. PESTEL analysis
- 4.4. Market Entropy
- 4.5. Patent/Trademark Analysis
- 5. Global America AI in the Retail Market Analysis, Insights and Forecast, 2019-2031
- 5.1. Market Analysis, Insights and Forecast - by Channel
- 5.1.1. Omnichannel
- 5.1.2. Brick and Mortar
- 5.1.3. Pure-play Online Retailers
- 5.2. Market Analysis, Insights and Forecast - by Solution
- 5.2.1. Software
- 5.2.1.1. On Premise
- 5.2.1.2. Cloud
- 5.2.2. Service
- 5.2.1. Software
- 5.3. Market Analysis, Insights and Forecast - by Application
- 5.3.1. Apparel and Footwear
- 5.3.2. Food and Grocery
- 5.3.3. Electronics and Home Appliances
- 5.3.4. Home Improvement
- 5.3.5. Other Applications
- 5.4. Market Analysis, Insights and Forecast - by Technology
- 5.4.1. Machine Learning
- 5.4.2. Natural Language Processing
- 5.4.3. Chatbots
- 5.4.4. Image and Video Analytics
- 5.4.5. Swarm Intelligence
- 5.5. Market Analysis, Insights and Forecast - by Region
- 5.5.1. North America
- 5.5.2. South America
- 5.5.3. Europe
- 5.5.4. Middle East & Africa
- 5.5.5. Asia Pacific
- 5.1. Market Analysis, Insights and Forecast - by Channel
- 6. North America America AI in the Retail Market Analysis, Insights and Forecast, 2019-2031
- 6.1. Market Analysis, Insights and Forecast - by Channel
- 6.1.1. Omnichannel
- 6.1.2. Brick and Mortar
- 6.1.3. Pure-play Online Retailers
- 6.2. Market Analysis, Insights and Forecast - by Solution
- 6.2.1. Software
- 6.2.1.1. On Premise
- 6.2.1.2. Cloud
- 6.2.2. Service
- 6.2.1. Software
- 6.3. Market Analysis, Insights and Forecast - by Application
- 6.3.1. Apparel and Footwear
- 6.3.2. Food and Grocery
- 6.3.3. Electronics and Home Appliances
- 6.3.4. Home Improvement
- 6.3.5. Other Applications
- 6.4. Market Analysis, Insights and Forecast - by Technology
- 6.4.1. Machine Learning
- 6.4.2. Natural Language Processing
- 6.4.3. Chatbots
- 6.4.4. Image and Video Analytics
- 6.4.5. Swarm Intelligence
- 6.1. Market Analysis, Insights and Forecast - by Channel
- 7. South America America AI in the Retail Market Analysis, Insights and Forecast, 2019-2031
- 7.1. Market Analysis, Insights and Forecast - by Channel
- 7.1.1. Omnichannel
- 7.1.2. Brick and Mortar
- 7.1.3. Pure-play Online Retailers
- 7.2. Market Analysis, Insights and Forecast - by Solution
- 7.2.1. Software
- 7.2.1.1. On Premise
- 7.2.1.2. Cloud
- 7.2.2. Service
- 7.2.1. Software
- 7.3. Market Analysis, Insights and Forecast - by Application
- 7.3.1. Apparel and Footwear
- 7.3.2. Food and Grocery
- 7.3.3. Electronics and Home Appliances
- 7.3.4. Home Improvement
- 7.3.5. Other Applications
- 7.4. Market Analysis, Insights and Forecast - by Technology
- 7.4.1. Machine Learning
- 7.4.2. Natural Language Processing
- 7.4.3. Chatbots
- 7.4.4. Image and Video Analytics
- 7.4.5. Swarm Intelligence
- 7.1. Market Analysis, Insights and Forecast - by Channel
- 8. Europe America AI in the Retail Market Analysis, Insights and Forecast, 2019-2031
- 8.1. Market Analysis, Insights and Forecast - by Channel
- 8.1.1. Omnichannel
- 8.1.2. Brick and Mortar
- 8.1.3. Pure-play Online Retailers
- 8.2. Market Analysis, Insights and Forecast - by Solution
- 8.2.1. Software
- 8.2.1.1. On Premise
- 8.2.1.2. Cloud
- 8.2.2. Service
- 8.2.1. Software
- 8.3. Market Analysis, Insights and Forecast - by Application
- 8.3.1. Apparel and Footwear
- 8.3.2. Food and Grocery
- 8.3.3. Electronics and Home Appliances
- 8.3.4. Home Improvement
- 8.3.5. Other Applications
- 8.4. Market Analysis, Insights and Forecast - by Technology
- 8.4.1. Machine Learning
- 8.4.2. Natural Language Processing
- 8.4.3. Chatbots
- 8.4.4. Image and Video Analytics
- 8.4.5. Swarm Intelligence
- 8.1. Market Analysis, Insights and Forecast - by Channel
- 9. Middle East & Africa America AI in the Retail Market Analysis, Insights and Forecast, 2019-2031
- 9.1. Market Analysis, Insights and Forecast - by Channel
- 9.1.1. Omnichannel
- 9.1.2. Brick and Mortar
- 9.1.3. Pure-play Online Retailers
- 9.2. Market Analysis, Insights and Forecast - by Solution
- 9.2.1. Software
- 9.2.1.1. On Premise
- 9.2.1.2. Cloud
- 9.2.2. Service
- 9.2.1. Software
- 9.3. Market Analysis, Insights and Forecast - by Application
- 9.3.1. Apparel and Footwear
- 9.3.2. Food and Grocery
- 9.3.3. Electronics and Home Appliances
- 9.3.4. Home Improvement
- 9.3.5. Other Applications
- 9.4. Market Analysis, Insights and Forecast - by Technology
- 9.4.1. Machine Learning
- 9.4.2. Natural Language Processing
- 9.4.3. Chatbots
- 9.4.4. Image and Video Analytics
- 9.4.5. Swarm Intelligence
- 9.1. Market Analysis, Insights and Forecast - by Channel
- 10. Asia Pacific America AI in the Retail Market Analysis, Insights and Forecast, 2019-2031
- 10.1. Market Analysis, Insights and Forecast - by Channel
- 10.1.1. Omnichannel
- 10.1.2. Brick and Mortar
- 10.1.3. Pure-play Online Retailers
- 10.2. Market Analysis, Insights and Forecast - by Solution
- 10.2.1. Software
- 10.2.1.1. On Premise
- 10.2.1.2. Cloud
- 10.2.2. Service
- 10.2.1. Software
- 10.3. Market Analysis, Insights and Forecast - by Application
- 10.3.1. Apparel and Footwear
- 10.3.2. Food and Grocery
- 10.3.3. Electronics and Home Appliances
- 10.3.4. Home Improvement
- 10.3.5. Other Applications
- 10.4. Market Analysis, Insights and Forecast - by Technology
- 10.4.1. Machine Learning
- 10.4.2. Natural Language Processing
- 10.4.3. Chatbots
- 10.4.4. Image and Video Analytics
- 10.4.5. Swarm Intelligence
- 10.1. Market Analysis, Insights and Forecast - by Channel
- 11. North America America AI in the Retail Market Analysis, Insights and Forecast, 2019-2031
- 11.1. Market Analysis, Insights and Forecast - By Country/Sub-region
- 11.1.1.
- 12. Europe America AI in the Retail Market Analysis, Insights and Forecast, 2019-2031
- 12.1. Market Analysis, Insights and Forecast - By Country/Sub-region
- 12.1.1.
- 13. Asia Pacific America AI in the Retail Market Analysis, Insights and Forecast, 2019-2031
- 13.1. Market Analysis, Insights and Forecast - By Country/Sub-region
- 13.1.1.
- 14. Latin America America AI in the Retail Market Analysis, Insights and Forecast, 2019-2031
- 14.1. Market Analysis, Insights and Forecast - By Country/Sub-region
- 14.1.1.
- 15. Middle East and Africa America AI in the Retail Market Analysis, Insights and Forecast, 2019-2031
- 15.1. Market Analysis, Insights and Forecast - By Country/Sub-region
- 15.1.1.
- 16. Competitive Analysis
- 16.1. Global Market Share Analysis 2024
- 16.2. Company Profiles
- 16.2.1 ViSenze Pte Ltd
- 16.2.1.1. Overview
- 16.2.1.2. Products
- 16.2.1.3. SWOT Analysis
- 16.2.1.4. Recent Developments
- 16.2.1.5. Financials (Based on Availability)
- 16.2.2 IBM Corporation
- 16.2.2.1. Overview
- 16.2.2.2. Products
- 16.2.2.3. SWOT Analysis
- 16.2.2.4. Recent Developments
- 16.2.2.5. Financials (Based on Availability)
- 16.2.3 Sentient Technologies Holdings Limited
- 16.2.3.1. Overview
- 16.2.3.2. Products
- 16.2.3.3. SWOT Analysis
- 16.2.3.4. Recent Developments
- 16.2.3.5. Financials (Based on Availability)
- 16.2.4 Google LLC
- 16.2.4.1. Overview
- 16.2.4.2. Products
- 16.2.4.3. SWOT Analysis
- 16.2.4.4. Recent Developments
- 16.2.4.5. Financials (Based on Availability)
- 16.2.5 Salesforce com Inc
- 16.2.5.1. Overview
- 16.2.5.2. Products
- 16.2.5.3. SWOT Analysis
- 16.2.5.4. Recent Developments
- 16.2.5.5. Financials (Based on Availability)
- 16.2.6 Microsoft Corporation
- 16.2.6.1. Overview
- 16.2.6.2. Products
- 16.2.6.3. SWOT Analysis
- 16.2.6.4. Recent Developments
- 16.2.6.5. Financials (Based on Availability)
- 16.2.7 Amazon Web Services Inc
- 16.2.7.1. Overview
- 16.2.7.2. Products
- 16.2.7.3. SWOT Analysis
- 16.2.7.4. Recent Developments
- 16.2.7.5. Financials (Based on Availability)
- 16.2.8 Sophos Inc (Thoma Bravo)
- 16.2.8.1. Overview
- 16.2.8.2. Products
- 16.2.8.3. SWOT Analysis
- 16.2.8.4. Recent Developments
- 16.2.8.5. Financials (Based on Availability)
- 16.2.9 Oracle Corporation
- 16.2.9.1. Overview
- 16.2.9.2. Products
- 16.2.9.3. SWOT Analysis
- 16.2.9.4. Recent Developments
- 16.2.9.5. Financials (Based on Availability)
- 16.2.10 SAP SE
- 16.2.10.1. Overview
- 16.2.10.2. Products
- 16.2.10.3. SWOT Analysis
- 16.2.10.4. Recent Developments
- 16.2.10.5. Financials (Based on Availability)
- 16.2.1 ViSenze Pte Ltd
List of Figures
- Figure 1: Global America AI in the Retail Market Revenue Breakdown (Million, %) by Region 2024 & 2032
- Figure 2: Global America AI in the Retail Market Volume Breakdown (K Unit, %) by Region 2024 & 2032
- Figure 3: North America America AI in the Retail Market Revenue (Million), by Country 2024 & 2032
- Figure 4: North America America AI in the Retail Market Volume (K Unit), by Country 2024 & 2032
- Figure 5: North America America AI in the Retail Market Revenue Share (%), by Country 2024 & 2032
- Figure 6: North America America AI in the Retail Market Volume Share (%), by Country 2024 & 2032
- Figure 7: Europe America AI in the Retail Market Revenue (Million), by Country 2024 & 2032
- Figure 8: Europe America AI in the Retail Market Volume (K Unit), by Country 2024 & 2032
- Figure 9: Europe America AI in the Retail Market Revenue Share (%), by Country 2024 & 2032
- Figure 10: Europe America AI in the Retail Market Volume Share (%), by Country 2024 & 2032
- Figure 11: Asia Pacific America AI in the Retail Market Revenue (Million), by Country 2024 & 2032
- Figure 12: Asia Pacific America AI in the Retail Market Volume (K Unit), by Country 2024 & 2032
- Figure 13: Asia Pacific America AI in the Retail Market Revenue Share (%), by Country 2024 & 2032
- Figure 14: Asia Pacific America AI in the Retail Market Volume Share (%), by Country 2024 & 2032
- Figure 15: Latin America America AI in the Retail Market Revenue (Million), by Country 2024 & 2032
- Figure 16: Latin America America AI in the Retail Market Volume (K Unit), by Country 2024 & 2032
- Figure 17: Latin America America AI in the Retail Market Revenue Share (%), by Country 2024 & 2032
- Figure 18: Latin America America AI in the Retail Market Volume Share (%), by Country 2024 & 2032
- Figure 19: Middle East and Africa America AI in the Retail Market Revenue (Million), by Country 2024 & 2032
- Figure 20: Middle East and Africa America AI in the Retail Market Volume (K Unit), by Country 2024 & 2032
- Figure 21: Middle East and Africa America AI in the Retail Market Revenue Share (%), by Country 2024 & 2032
- Figure 22: Middle East and Africa America AI in the Retail Market Volume Share (%), by Country 2024 & 2032
- Figure 23: North America America AI in the Retail Market Revenue (Million), by Channel 2024 & 2032
- Figure 24: North America America AI in the Retail Market Volume (K Unit), by Channel 2024 & 2032
- Figure 25: North America America AI in the Retail Market Revenue Share (%), by Channel 2024 & 2032
- Figure 26: North America America AI in the Retail Market Volume Share (%), by Channel 2024 & 2032
- Figure 27: North America America AI in the Retail Market Revenue (Million), by Solution 2024 & 2032
- Figure 28: North America America AI in the Retail Market Volume (K Unit), by Solution 2024 & 2032
- Figure 29: North America America AI in the Retail Market Revenue Share (%), by Solution 2024 & 2032
- Figure 30: North America America AI in the Retail Market Volume Share (%), by Solution 2024 & 2032
- Figure 31: North America America AI in the Retail Market Revenue (Million), by Application 2024 & 2032
- Figure 32: North America America AI in the Retail Market Volume (K Unit), by Application 2024 & 2032
- Figure 33: North America America AI in the Retail Market Revenue Share (%), by Application 2024 & 2032
- Figure 34: North America America AI in the Retail Market Volume Share (%), by Application 2024 & 2032
- Figure 35: North America America AI in the Retail Market Revenue (Million), by Technology 2024 & 2032
- Figure 36: North America America AI in the Retail Market Volume (K Unit), by Technology 2024 & 2032
- Figure 37: North America America AI in the Retail Market Revenue Share (%), by Technology 2024 & 2032
- Figure 38: North America America AI in the Retail Market Volume Share (%), by Technology 2024 & 2032
- Figure 39: North America America AI in the Retail Market Revenue (Million), by Country 2024 & 2032
- Figure 40: North America America AI in the Retail Market Volume (K Unit), by Country 2024 & 2032
- Figure 41: North America America AI in the Retail Market Revenue Share (%), by Country 2024 & 2032
- Figure 42: North America America AI in the Retail Market Volume Share (%), by Country 2024 & 2032
- Figure 43: South America America AI in the Retail Market Revenue (Million), by Channel 2024 & 2032
- Figure 44: South America America AI in the Retail Market Volume (K Unit), by Channel 2024 & 2032
- Figure 45: South America America AI in the Retail Market Revenue Share (%), by Channel 2024 & 2032
- Figure 46: South America America AI in the Retail Market Volume Share (%), by Channel 2024 & 2032
- Figure 47: South America America AI in the Retail Market Revenue (Million), by Solution 2024 & 2032
- Figure 48: South America America AI in the Retail Market Volume (K Unit), by Solution 2024 & 2032
- Figure 49: South America America AI in the Retail Market Revenue Share (%), by Solution 2024 & 2032
- Figure 50: South America America AI in the Retail Market Volume Share (%), by Solution 2024 & 2032
- Figure 51: South America America AI in the Retail Market Revenue (Million), by Application 2024 & 2032
- Figure 52: South America America AI in the Retail Market Volume (K Unit), by Application 2024 & 2032
- Figure 53: South America America AI in the Retail Market Revenue Share (%), by Application 2024 & 2032
- Figure 54: South America America AI in the Retail Market Volume Share (%), by Application 2024 & 2032
- Figure 55: South America America AI in the Retail Market Revenue (Million), by Technology 2024 & 2032
- Figure 56: South America America AI in the Retail Market Volume (K Unit), by Technology 2024 & 2032
- Figure 57: South America America AI in the Retail Market Revenue Share (%), by Technology 2024 & 2032
- Figure 58: South America America AI in the Retail Market Volume Share (%), by Technology 2024 & 2032
- Figure 59: South America America AI in the Retail Market Revenue (Million), by Country 2024 & 2032
- Figure 60: South America America AI in the Retail Market Volume (K Unit), by Country 2024 & 2032
- Figure 61: South America America AI in the Retail Market Revenue Share (%), by Country 2024 & 2032
- Figure 62: South America America AI in the Retail Market Volume Share (%), by Country 2024 & 2032
- Figure 63: Europe America AI in the Retail Market Revenue (Million), by Channel 2024 & 2032
- Figure 64: Europe America AI in the Retail Market Volume (K Unit), by Channel 2024 & 2032
- Figure 65: Europe America AI in the Retail Market Revenue Share (%), by Channel 2024 & 2032
- Figure 66: Europe America AI in the Retail Market Volume Share (%), by Channel 2024 & 2032
- Figure 67: Europe America AI in the Retail Market Revenue (Million), by Solution 2024 & 2032
- Figure 68: Europe America AI in the Retail Market Volume (K Unit), by Solution 2024 & 2032
- Figure 69: Europe America AI in the Retail Market Revenue Share (%), by Solution 2024 & 2032
- Figure 70: Europe America AI in the Retail Market Volume Share (%), by Solution 2024 & 2032
- Figure 71: Europe America AI in the Retail Market Revenue (Million), by Application 2024 & 2032
- Figure 72: Europe America AI in the Retail Market Volume (K Unit), by Application 2024 & 2032
- Figure 73: Europe America AI in the Retail Market Revenue Share (%), by Application 2024 & 2032
- Figure 74: Europe America AI in the Retail Market Volume Share (%), by Application 2024 & 2032
- Figure 75: Europe America AI in the Retail Market Revenue (Million), by Technology 2024 & 2032
- Figure 76: Europe America AI in the Retail Market Volume (K Unit), by Technology 2024 & 2032
- Figure 77: Europe America AI in the Retail Market Revenue Share (%), by Technology 2024 & 2032
- Figure 78: Europe America AI in the Retail Market Volume Share (%), by Technology 2024 & 2032
- Figure 79: Europe America AI in the Retail Market Revenue (Million), by Country 2024 & 2032
- Figure 80: Europe America AI in the Retail Market Volume (K Unit), by Country 2024 & 2032
- Figure 81: Europe America AI in the Retail Market Revenue Share (%), by Country 2024 & 2032
- Figure 82: Europe America AI in the Retail Market Volume Share (%), by Country 2024 & 2032
- Figure 83: Middle East & Africa America AI in the Retail Market Revenue (Million), by Channel 2024 & 2032
- Figure 84: Middle East & Africa America AI in the Retail Market Volume (K Unit), by Channel 2024 & 2032
- Figure 85: Middle East & Africa America AI in the Retail Market Revenue Share (%), by Channel 2024 & 2032
- Figure 86: Middle East & Africa America AI in the Retail Market Volume Share (%), by Channel 2024 & 2032
- Figure 87: Middle East & Africa America AI in the Retail Market Revenue (Million), by Solution 2024 & 2032
- Figure 88: Middle East & Africa America AI in the Retail Market Volume (K Unit), by Solution 2024 & 2032
- Figure 89: Middle East & Africa America AI in the Retail Market Revenue Share (%), by Solution 2024 & 2032
- Figure 90: Middle East & Africa America AI in the Retail Market Volume Share (%), by Solution 2024 & 2032
- Figure 91: Middle East & Africa America AI in the Retail Market Revenue (Million), by Application 2024 & 2032
- Figure 92: Middle East & Africa America AI in the Retail Market Volume (K Unit), by Application 2024 & 2032
- Figure 93: Middle East & Africa America AI in the Retail Market Revenue Share (%), by Application 2024 & 2032
- Figure 94: Middle East & Africa America AI in the Retail Market Volume Share (%), by Application 2024 & 2032
- Figure 95: Middle East & Africa America AI in the Retail Market Revenue (Million), by Technology 2024 & 2032
- Figure 96: Middle East & Africa America AI in the Retail Market Volume (K Unit), by Technology 2024 & 2032
- Figure 97: Middle East & Africa America AI in the Retail Market Revenue Share (%), by Technology 2024 & 2032
- Figure 98: Middle East & Africa America AI in the Retail Market Volume Share (%), by Technology 2024 & 2032
- Figure 99: Middle East & Africa America AI in the Retail Market Revenue (Million), by Country 2024 & 2032
- Figure 100: Middle East & Africa America AI in the Retail Market Volume (K Unit), by Country 2024 & 2032
- Figure 101: Middle East & Africa America AI in the Retail Market Revenue Share (%), by Country 2024 & 2032
- Figure 102: Middle East & Africa America AI in the Retail Market Volume Share (%), by Country 2024 & 2032
- Figure 103: Asia Pacific America AI in the Retail Market Revenue (Million), by Channel 2024 & 2032
- Figure 104: Asia Pacific America AI in the Retail Market Volume (K Unit), by Channel 2024 & 2032
- Figure 105: Asia Pacific America AI in the Retail Market Revenue Share (%), by Channel 2024 & 2032
- Figure 106: Asia Pacific America AI in the Retail Market Volume Share (%), by Channel 2024 & 2032
- Figure 107: Asia Pacific America AI in the Retail Market Revenue (Million), by Solution 2024 & 2032
- Figure 108: Asia Pacific America AI in the Retail Market Volume (K Unit), by Solution 2024 & 2032
- Figure 109: Asia Pacific America AI in the Retail Market Revenue Share (%), by Solution 2024 & 2032
- Figure 110: Asia Pacific America AI in the Retail Market Volume Share (%), by Solution 2024 & 2032
- Figure 111: Asia Pacific America AI in the Retail Market Revenue (Million), by Application 2024 & 2032
- Figure 112: Asia Pacific America AI in the Retail Market Volume (K Unit), by Application 2024 & 2032
- Figure 113: Asia Pacific America AI in the Retail Market Revenue Share (%), by Application 2024 & 2032
- Figure 114: Asia Pacific America AI in the Retail Market Volume Share (%), by Application 2024 & 2032
- Figure 115: Asia Pacific America AI in the Retail Market Revenue (Million), by Technology 2024 & 2032
- Figure 116: Asia Pacific America AI in the Retail Market Volume (K Unit), by Technology 2024 & 2032
- Figure 117: Asia Pacific America AI in the Retail Market Revenue Share (%), by Technology 2024 & 2032
- Figure 118: Asia Pacific America AI in the Retail Market Volume Share (%), by Technology 2024 & 2032
- Figure 119: Asia Pacific America AI in the Retail Market Revenue (Million), by Country 2024 & 2032
- Figure 120: Asia Pacific America AI in the Retail Market Volume (K Unit), by Country 2024 & 2032
- Figure 121: Asia Pacific America AI in the Retail Market Revenue Share (%), by Country 2024 & 2032
- Figure 122: Asia Pacific America AI in the Retail Market Volume Share (%), by Country 2024 & 2032
List of Tables
- Table 1: Global America AI in the Retail Market Revenue Million Forecast, by Region 2019 & 2032
- Table 2: Global America AI in the Retail Market Volume K Unit Forecast, by Region 2019 & 2032
- Table 3: Global America AI in the Retail Market Revenue Million Forecast, by Channel 2019 & 2032
- Table 4: Global America AI in the Retail Market Volume K Unit Forecast, by Channel 2019 & 2032
- Table 5: Global America AI in the Retail Market Revenue Million Forecast, by Solution 2019 & 2032
- Table 6: Global America AI in the Retail Market Volume K Unit Forecast, by Solution 2019 & 2032
- Table 7: Global America AI in the Retail Market Revenue Million Forecast, by Application 2019 & 2032
- Table 8: Global America AI in the Retail Market Volume K Unit Forecast, by Application 2019 & 2032
- Table 9: Global America AI in the Retail Market Revenue Million Forecast, by Technology 2019 & 2032
- Table 10: Global America AI in the Retail Market Volume K Unit Forecast, by Technology 2019 & 2032
- Table 11: Global America AI in the Retail Market Revenue Million Forecast, by Region 2019 & 2032
- Table 12: Global America AI in the Retail Market Volume K Unit Forecast, by Region 2019 & 2032
- Table 13: Global America AI in the Retail Market Revenue Million Forecast, by Country 2019 & 2032
- Table 14: Global America AI in the Retail Market Volume K Unit Forecast, by Country 2019 & 2032
- Table 15: America AI in the Retail Market Revenue (Million) Forecast, by Application 2019 & 2032
- Table 16: America AI in the Retail Market Volume (K Unit) Forecast, by Application 2019 & 2032
- Table 17: Global America AI in the Retail Market Revenue Million Forecast, by Country 2019 & 2032
- Table 18: Global America AI in the Retail Market Volume K Unit Forecast, by Country 2019 & 2032
- Table 19: America AI in the Retail Market Revenue (Million) Forecast, by Application 2019 & 2032
- Table 20: America AI in the Retail Market Volume (K Unit) Forecast, by Application 2019 & 2032
- Table 21: Global America AI in the Retail Market Revenue Million Forecast, by Country 2019 & 2032
- Table 22: Global America AI in the Retail Market Volume K Unit Forecast, by Country 2019 & 2032
- Table 23: America AI in the Retail Market Revenue (Million) Forecast, by Application 2019 & 2032
- Table 24: America AI in the Retail Market Volume (K Unit) Forecast, by Application 2019 & 2032
- Table 25: Global America AI in the Retail Market Revenue Million Forecast, by Country 2019 & 2032
- Table 26: Global America AI in the Retail Market Volume K Unit Forecast, by Country 2019 & 2032
- Table 27: America AI in the Retail Market Revenue (Million) Forecast, by Application 2019 & 2032
- Table 28: America AI in the Retail Market Volume (K Unit) Forecast, by Application 2019 & 2032
- Table 29: Global America AI in the Retail Market Revenue Million Forecast, by Country 2019 & 2032
- Table 30: Global America AI in the Retail Market Volume K Unit Forecast, by Country 2019 & 2032
- Table 31: America AI in the Retail Market Revenue (Million) Forecast, by Application 2019 & 2032
- Table 32: America AI in the Retail Market Volume (K Unit) Forecast, by Application 2019 & 2032
- Table 33: Global America AI in the Retail Market Revenue Million Forecast, by Channel 2019 & 2032
- Table 34: Global America AI in the Retail Market Volume K Unit Forecast, by Channel 2019 & 2032
- Table 35: Global America AI in the Retail Market Revenue Million Forecast, by Solution 2019 & 2032
- Table 36: Global America AI in the Retail Market Volume K Unit Forecast, by Solution 2019 & 2032
- Table 37: Global America AI in the Retail Market Revenue Million Forecast, by Application 2019 & 2032
- Table 38: Global America AI in the Retail Market Volume K Unit Forecast, by Application 2019 & 2032
- Table 39: Global America AI in the Retail Market Revenue Million Forecast, by Technology 2019 & 2032
- Table 40: Global America AI in the Retail Market Volume K Unit Forecast, by Technology 2019 & 2032
- Table 41: Global America AI in the Retail Market Revenue Million Forecast, by Country 2019 & 2032
- Table 42: Global America AI in the Retail Market Volume K Unit Forecast, by Country 2019 & 2032
- Table 43: United States America AI in the Retail Market Revenue (Million) Forecast, by Application 2019 & 2032
- Table 44: United States America AI in the Retail Market Volume (K Unit) Forecast, by Application 2019 & 2032
- Table 45: Canada America AI in the Retail Market Revenue (Million) Forecast, by Application 2019 & 2032
- Table 46: Canada America AI in the Retail Market Volume (K Unit) Forecast, by Application 2019 & 2032
- Table 47: Mexico America AI in the Retail Market Revenue (Million) Forecast, by Application 2019 & 2032
- Table 48: Mexico America AI in the Retail Market Volume (K Unit) Forecast, by Application 2019 & 2032
- Table 49: Global America AI in the Retail Market Revenue Million Forecast, by Channel 2019 & 2032
- Table 50: Global America AI in the Retail Market Volume K Unit Forecast, by Channel 2019 & 2032
- Table 51: Global America AI in the Retail Market Revenue Million Forecast, by Solution 2019 & 2032
- Table 52: Global America AI in the Retail Market Volume K Unit Forecast, by Solution 2019 & 2032
- Table 53: Global America AI in the Retail Market Revenue Million Forecast, by Application 2019 & 2032
- Table 54: Global America AI in the Retail Market Volume K Unit Forecast, by Application 2019 & 2032
- Table 55: Global America AI in the Retail Market Revenue Million Forecast, by Technology 2019 & 2032
- Table 56: Global America AI in the Retail Market Volume K Unit Forecast, by Technology 2019 & 2032
- Table 57: Global America AI in the Retail Market Revenue Million Forecast, by Country 2019 & 2032
- Table 58: Global America AI in the Retail Market Volume K Unit Forecast, by Country 2019 & 2032
- Table 59: Brazil America AI in the Retail Market Revenue (Million) Forecast, by Application 2019 & 2032
- Table 60: Brazil America AI in the Retail Market Volume (K Unit) Forecast, by Application 2019 & 2032
- Table 61: Argentina America AI in the Retail Market Revenue (Million) Forecast, by Application 2019 & 2032
- Table 62: Argentina America AI in the Retail Market Volume (K Unit) Forecast, by Application 2019 & 2032
- Table 63: Rest of South America America AI in the Retail Market Revenue (Million) Forecast, by Application 2019 & 2032
- Table 64: Rest of South America America AI in the Retail Market Volume (K Unit) Forecast, by Application 2019 & 2032
- Table 65: Global America AI in the Retail Market Revenue Million Forecast, by Channel 2019 & 2032
- Table 66: Global America AI in the Retail Market Volume K Unit Forecast, by Channel 2019 & 2032
- Table 67: Global America AI in the Retail Market Revenue Million Forecast, by Solution 2019 & 2032
- Table 68: Global America AI in the Retail Market Volume K Unit Forecast, by Solution 2019 & 2032
- Table 69: Global America AI in the Retail Market Revenue Million Forecast, by Application 2019 & 2032
- Table 70: Global America AI in the Retail Market Volume K Unit Forecast, by Application 2019 & 2032
- Table 71: Global America AI in the Retail Market Revenue Million Forecast, by Technology 2019 & 2032
- Table 72: Global America AI in the Retail Market Volume K Unit Forecast, by Technology 2019 & 2032
- Table 73: Global America AI in the Retail Market Revenue Million Forecast, by Country 2019 & 2032
- Table 74: Global America AI in the Retail Market Volume K Unit Forecast, by Country 2019 & 2032
- Table 75: United Kingdom America AI in the Retail Market Revenue (Million) Forecast, by Application 2019 & 2032
- Table 76: United Kingdom America AI in the Retail Market Volume (K Unit) Forecast, by Application 2019 & 2032
- Table 77: Germany America AI in the Retail Market Revenue (Million) Forecast, by Application 2019 & 2032
- Table 78: Germany America AI in the Retail Market Volume (K Unit) Forecast, by Application 2019 & 2032
- Table 79: France America AI in the Retail Market Revenue (Million) Forecast, by Application 2019 & 2032
- Table 80: France America AI in the Retail Market Volume (K Unit) Forecast, by Application 2019 & 2032
- Table 81: Italy America AI in the Retail Market Revenue (Million) Forecast, by Application 2019 & 2032
- Table 82: Italy America AI in the Retail Market Volume (K Unit) Forecast, by Application 2019 & 2032
- Table 83: Spain America AI in the Retail Market Revenue (Million) Forecast, by Application 2019 & 2032
- Table 84: Spain America AI in the Retail Market Volume (K Unit) Forecast, by Application 2019 & 2032
- Table 85: Russia America AI in the Retail Market Revenue (Million) Forecast, by Application 2019 & 2032
- Table 86: Russia America AI in the Retail Market Volume (K Unit) Forecast, by Application 2019 & 2032
- Table 87: Benelux America AI in the Retail Market Revenue (Million) Forecast, by Application 2019 & 2032
- Table 88: Benelux America AI in the Retail Market Volume (K Unit) Forecast, by Application 2019 & 2032
- Table 89: Nordics America AI in the Retail Market Revenue (Million) Forecast, by Application 2019 & 2032
- Table 90: Nordics America AI in the Retail Market Volume (K Unit) Forecast, by Application 2019 & 2032
- Table 91: Rest of Europe America AI in the Retail Market Revenue (Million) Forecast, by Application 2019 & 2032
- Table 92: Rest of Europe America AI in the Retail Market Volume (K Unit) Forecast, by Application 2019 & 2032
- Table 93: Global America AI in the Retail Market Revenue Million Forecast, by Channel 2019 & 2032
- Table 94: Global America AI in the Retail Market Volume K Unit Forecast, by Channel 2019 & 2032
- Table 95: Global America AI in the Retail Market Revenue Million Forecast, by Solution 2019 & 2032
- Table 96: Global America AI in the Retail Market Volume K Unit Forecast, by Solution 2019 & 2032
- Table 97: Global America AI in the Retail Market Revenue Million Forecast, by Application 2019 & 2032
- Table 98: Global America AI in the Retail Market Volume K Unit Forecast, by Application 2019 & 2032
- Table 99: Global America AI in the Retail Market Revenue Million Forecast, by Technology 2019 & 2032
- Table 100: Global America AI in the Retail Market Volume K Unit Forecast, by Technology 2019 & 2032
- Table 101: Global America AI in the Retail Market Revenue Million Forecast, by Country 2019 & 2032
- Table 102: Global America AI in the Retail Market Volume K Unit Forecast, by Country 2019 & 2032
- Table 103: Turkey America AI in the Retail Market Revenue (Million) Forecast, by Application 2019 & 2032
- Table 104: Turkey America AI in the Retail Market Volume (K Unit) Forecast, by Application 2019 & 2032
- Table 105: Israel America AI in the Retail Market Revenue (Million) Forecast, by Application 2019 & 2032
- Table 106: Israel America AI in the Retail Market Volume (K Unit) Forecast, by Application 2019 & 2032
- Table 107: GCC America AI in the Retail Market Revenue (Million) Forecast, by Application 2019 & 2032
- Table 108: GCC America AI in the Retail Market Volume (K Unit) Forecast, by Application 2019 & 2032
- Table 109: North Africa America AI in the Retail Market Revenue (Million) Forecast, by Application 2019 & 2032
- Table 110: North Africa America AI in the Retail Market Volume (K Unit) Forecast, by Application 2019 & 2032
- Table 111: South Africa America AI in the Retail Market Revenue (Million) Forecast, by Application 2019 & 2032
- Table 112: South Africa America AI in the Retail Market Volume (K Unit) Forecast, by Application 2019 & 2032
- Table 113: Rest of Middle East & Africa America AI in the Retail Market Revenue (Million) Forecast, by Application 2019 & 2032
- Table 114: Rest of Middle East & Africa America AI in the Retail Market Volume (K Unit) Forecast, by Application 2019 & 2032
- Table 115: Global America AI in the Retail Market Revenue Million Forecast, by Channel 2019 & 2032
- Table 116: Global America AI in the Retail Market Volume K Unit Forecast, by Channel 2019 & 2032
- Table 117: Global America AI in the Retail Market Revenue Million Forecast, by Solution 2019 & 2032
- Table 118: Global America AI in the Retail Market Volume K Unit Forecast, by Solution 2019 & 2032
- Table 119: Global America AI in the Retail Market Revenue Million Forecast, by Application 2019 & 2032
- Table 120: Global America AI in the Retail Market Volume K Unit Forecast, by Application 2019 & 2032
- Table 121: Global America AI in the Retail Market Revenue Million Forecast, by Technology 2019 & 2032
- Table 122: Global America AI in the Retail Market Volume K Unit Forecast, by Technology 2019 & 2032
- Table 123: Global America AI in the Retail Market Revenue Million Forecast, by Country 2019 & 2032
- Table 124: Global America AI in the Retail Market Volume K Unit Forecast, by Country 2019 & 2032
- Table 125: China America AI in the Retail Market Revenue (Million) Forecast, by Application 2019 & 2032
- Table 126: China America AI in the Retail Market Volume (K Unit) Forecast, by Application 2019 & 2032
- Table 127: India America AI in the Retail Market Revenue (Million) Forecast, by Application 2019 & 2032
- Table 128: India America AI in the Retail Market Volume (K Unit) Forecast, by Application 2019 & 2032
- Table 129: Japan America AI in the Retail Market Revenue (Million) Forecast, by Application 2019 & 2032
- Table 130: Japan America AI in the Retail Market Volume (K Unit) Forecast, by Application 2019 & 2032
- Table 131: South Korea America AI in the Retail Market Revenue (Million) Forecast, by Application 2019 & 2032
- Table 132: South Korea America AI in the Retail Market Volume (K Unit) Forecast, by Application 2019 & 2032
- Table 133: ASEAN America AI in the Retail Market Revenue (Million) Forecast, by Application 2019 & 2032
- Table 134: ASEAN America AI in the Retail Market Volume (K Unit) Forecast, by Application 2019 & 2032
- Table 135: Oceania America AI in the Retail Market Revenue (Million) Forecast, by Application 2019 & 2032
- Table 136: Oceania America AI in the Retail Market Volume (K Unit) Forecast, by Application 2019 & 2032
- Table 137: Rest of Asia Pacific America AI in the Retail Market Revenue (Million) Forecast, by Application 2019 & 2032
- Table 138: Rest of Asia Pacific America AI in the Retail Market Volume (K Unit) Forecast, by Application 2019 & 2032
Frequently Asked Questions
1. What is the projected Compound Annual Growth Rate (CAGR) of the America AI in the Retail Market?
The projected CAGR is approximately 30.00%.
2. Which companies are prominent players in the America AI in the Retail Market?
Key companies in the market include ViSenze Pte Ltd, IBM Corporation, Sentient Technologies Holdings Limited, Google LLC, Salesforce com Inc, Microsoft Corporation, Amazon Web Services Inc, Sophos Inc (Thoma Bravo), Oracle Corporation, SAP SE.
3. What are the main segments of the America AI in the Retail Market?
The market segments include Channel, Solution, Application, Technology.
4. Can you provide details about the market size?
The market size is estimated to be USD XX Million as of 2022.
5. What are some drivers contributing to market growth?
; Hardware Advancement Acting as a Key Enabler for AI in Retail; Disruptive Developments in Retail. including AR. VR. IOT. and New Metrics; Rise of AI First Organizations; Need for Efficiency in Supply Chain Optimization.
6. What are the notable trends driving market growth?
Machine Learning Technology is Expected to Grow Siginificantly.
7. Are there any restraints impacting market growth?
; Lack of Professionals. as well as In-house Knowledge for Cultural Readiness.
8. Can you provide examples of recent developments in the market?
N/A
9. What pricing options are available for accessing the report?
Pricing options include single-user, multi-user, and enterprise licenses priced at USD 3800, USD 4500, and USD 5800 respectively.
10. Is the market size provided in terms of value or volume?
The market size is provided in terms of value, measured in Million and volume, measured in K Unit.
11. Are there any specific market keywords associated with the report?
Yes, the market keyword associated with the report is "America AI in the Retail Market," which aids in identifying and referencing the specific market segment covered.
12. How do I determine which pricing option suits my needs best?
The pricing options vary based on user requirements and access needs. Individual users may opt for single-user licenses, while businesses requiring broader access may choose multi-user or enterprise licenses for cost-effective access to the report.
13. Are there any additional resources or data provided in the America AI in the Retail Market report?
While the report offers comprehensive insights, it's advisable to review the specific contents or supplementary materials provided to ascertain if additional resources or data are available.
14. How can I stay updated on further developments or reports in the America AI in the Retail Market?
To stay informed about further developments, trends, and reports in the America AI in the Retail Market, consider subscribing to industry newsletters, following relevant companies and organizations, or regularly checking reputable industry news sources and publications.
Methodology
Step 1 - Identification of Relevant Samples Size from Population Database


Step 2 - Approaches for Defining Global Market Size (Value, Volume* & Price*)

Note*: In applicable scenarios
Step 3 - Data Sources
Primary Research
- Web Analytics
- Survey Reports
- Research Institute
- Latest Research Reports
- Opinion Leaders
Secondary Research
- Annual Reports
- White Paper
- Latest Press Release
- Industry Association
- Paid Database
- Investor Presentations

Step 4 - Data Triangulation
Involves using different sources of information in order to increase the validity of a study
These sources are likely to be stakeholders in a program - participants, other researchers, program staff, other community members, and so on.
Then we put all data in single framework & apply various statistical tools to find out the dynamic on the market.
During the analysis stage, feedback from the stakeholder groups would be compared to determine areas of agreement as well as areas of divergence
