

Key Insights
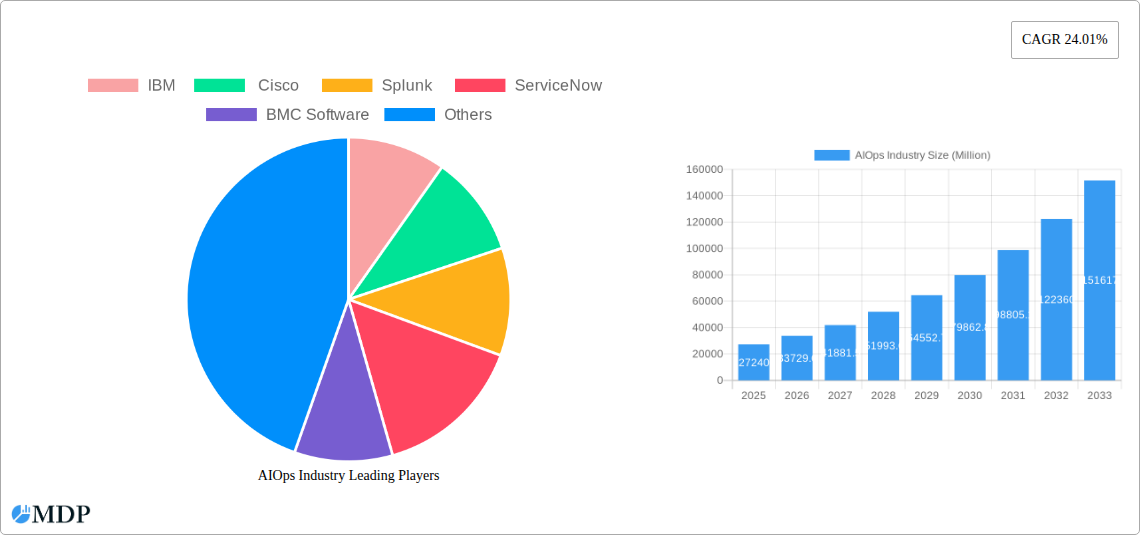
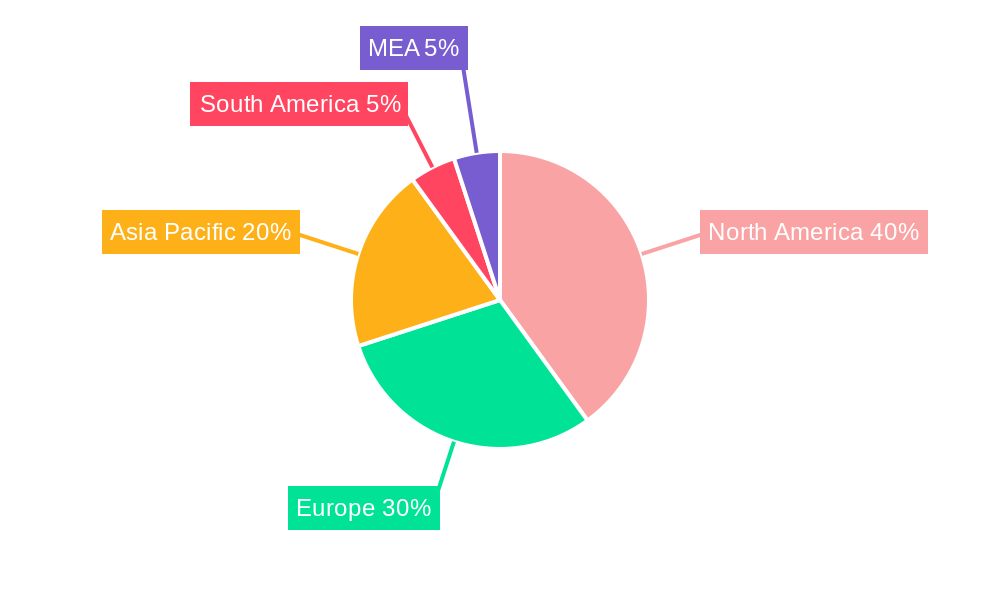
The AIOps market is experiencing robust growth, projected to reach $27.24 billion in 2025 and exhibiting a remarkable Compound Annual Growth Rate (CAGR) of 24.01%. This expansion is fueled by several key factors. Firstly, the increasing complexity of IT infrastructure, driven by cloud adoption, digital transformation initiatives, and the explosion of data, necessitates intelligent automation for efficient management and proactive issue resolution. Secondly, the demand for enhanced IT operational efficiency and reduced operational costs is a significant driver. AIOps solutions provide valuable insights into IT operations, enabling faster incident resolution, improved performance monitoring, and optimized resource allocation. Thirdly, the growing adoption of DevOps practices and the need for seamless integration across development and operations teams are fueling the demand for AIOps platforms. The market is segmented across deployment models (on-premise and cloud/SaaS), end-user industries (Media & Entertainment, IT & Telecom, Retail, Healthcare, BFSI, and others), and organization types (SMEs and large enterprises). The cloud/SaaS deployment model is witnessing accelerated growth, driven by its scalability, flexibility, and cost-effectiveness. Large enterprises currently dominate the market due to their higher budgets and complex IT infrastructures. However, SMEs are increasingly adopting AIOps solutions to streamline their operations and improve efficiency. Geographically, North America currently holds a significant market share, followed by Europe and Asia Pacific. However, emerging economies in Asia Pacific and South America are expected to witness significant growth in the coming years, driven by increased IT spending and digital transformation initiatives. Competitive landscape is characterized by established players like IBM, Cisco, Splunk, ServiceNow, and BMC Software offering a range of AIOps solutions, fostering innovation and further market expansion.
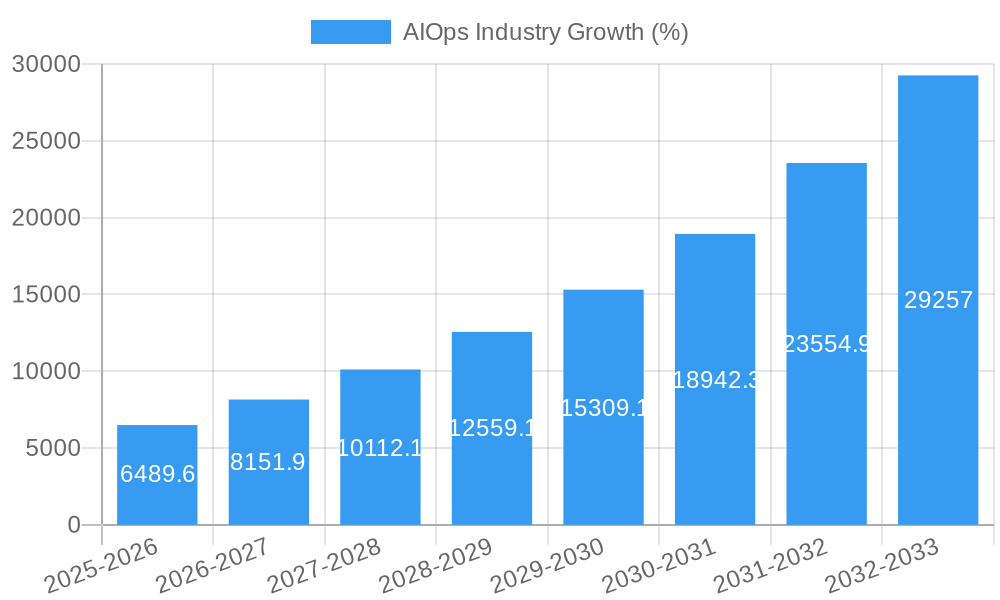
The forecast period (2025-2033) anticipates continued strong growth, driven by ongoing digital transformation, increased adoption of cloud-native architectures, and the burgeoning need for proactive IT operations management. Further market segmentation will likely emerge based on specific functionalities like anomaly detection, predictive analytics, and automation capabilities. The increasing focus on security and compliance will also drive the adoption of AIOps solutions with enhanced security features and data privacy capabilities. Key challenges include the integration complexities with existing IT systems, the need for skilled professionals to effectively utilize AIOps platforms, and concerns related to data security and privacy. However, the overall market outlook for AIOps remains incredibly positive, driven by the continuing need for intelligent automation to manage increasingly complex IT environments.
AIOps Industry Market Report: 2019-2033 - A Comprehensive Analysis
Unlocking the potential of Artificial Intelligence for IT Operations (AIOps): This comprehensive report provides an in-depth analysis of the AIOps market, forecasting explosive growth from $xx Million in 2025 to $xx Million by 2033, representing a robust CAGR of xx%. This report covers key market dynamics, industry trends, leading players (including IBM, Cisco, Splunk, ServiceNow, and BMC Software), and emerging opportunities, offering invaluable insights for stakeholders across the value chain. The study period covers 2019-2033, with 2025 serving as the base and estimated year.
AIOps Industry Market Dynamics & Concentration
The AIOps market is characterized by a dynamic interplay of factors influencing its growth and concentration. Market concentration is currently [Insert Market Concentration Metric, e.g., moderately high, with the top 5 players holding xx% market share in 2025]. Innovation is a key driver, fueled by advancements in artificial intelligence, machine learning, and big data analytics. Regulatory frameworks, while still evolving, are beginning to shape data privacy and security aspects of AIOps deployments. The emergence of cloud-based solutions presents a significant substitute to on-premise deployments, driving market shifts. End-user trends favor automated IT operations and predictive analytics capabilities, pushing demand for sophisticated AIOps platforms. Mergers and acquisitions (M&A) activity is [Insert description of M&A activity, e.g., moderate], with [Insert Number] deals recorded during the historical period (2019-2024). This activity is expected to increase as larger players seek to expand their market share and capabilities.
- Market Share (2025): IBM: xx%, Cisco: xx%, Splunk: xx%, ServiceNow: xx%, BMC Software: xx%, Others: xx%
- M&A Deal Count (2019-2024): xx
AIOps Industry Industry Trends & Analysis
The AIOps market is experiencing phenomenal growth, driven by several key factors. The increasing complexity of IT infrastructure, coupled with the need for improved operational efficiency and reduced costs, is creating strong demand for AI-powered solutions. Technological disruptions, such as the rise of cloud computing and the proliferation of IoT devices, are further accelerating market expansion. Consumer preferences are shifting towards more proactive and intelligent IT management, placing a premium on AIOps capabilities. Competitive dynamics are intense, with established players and new entrants vying for market share through innovation, strategic partnerships, and acquisitions. The market is expected to witness a significant increase in the adoption of AI-driven automation in IT operations, leading to cost optimization and increased operational efficiency. This trend, coupled with the increasing demand for real-time insights and proactive issue resolution, is expected to fuel the market growth. The global AIOps market size is projected to reach $xx Million by 2033, exhibiting a CAGR of xx% during the forecast period (2025-2033). Market penetration is currently at xx% and is expected to reach xx% by 2033.
Leading Markets & Segments in AIOps Industry
The North American region dominates the AIOps market, driven by robust IT infrastructure, high adoption of cloud technologies, and a strong focus on digital transformation. Within the segments, the Cloud/SaaS deployment model exhibits faster growth compared to on-premise solutions due to its scalability, flexibility, and cost-effectiveness. The large enterprise segment is the largest consumer of AIOps solutions, while the SME segment shows promising growth potential. In terms of end-user industries, the IT and Telecom sector is a significant adopter, followed by BFSI and Healthcare.
Key Drivers for North American Dominance:
- Mature IT infrastructure
- High adoption of cloud technologies
- Strong focus on digital transformation
- Significant investment in R&D
High Growth Segments:
- Deployment: Cloud/SaaS
- End-User Industry: IT & Telecom, BFSI
- Organization Type: Large Enterprises, with increasing adoption in SMEs.
AIOps Industry Product Developments
Recent product innovations focus on enhancing AI capabilities for improved anomaly detection, root cause analysis, and predictive maintenance. Applications are expanding beyond IT operations to encompass areas like cybersecurity, network management, and business process automation. The competitive advantage lies in offering comprehensive platforms with advanced analytics, seamless integration capabilities, and user-friendly interfaces. Technological trends like edge AI and serverless computing are shaping the next generation of AIOps solutions, emphasizing real-time insights and improved scalability.
Key Drivers of AIOps Industry Growth
Several factors are driving the growth of the AIOps market. Firstly, the increasing complexity of IT systems is creating a demand for automated solutions to manage and optimize performance. Secondly, the rising adoption of cloud computing and big data analytics provides the infrastructure for advanced AIOps platforms. Lastly, the regulatory focus on data security and compliance is driving investments in AIOps to strengthen IT security posture.
Challenges in the AIOps Industry Market
Challenges include the high cost of implementation, the need for skilled professionals, and the integration complexities of AIOps solutions with existing IT infrastructure. The market faces integration challenges with legacy systems and the need for skilled professionals to manage and maintain AIOps platforms. Data security and privacy concerns also represent a notable challenge, requiring robust compliance measures and data governance frameworks.
Emerging Opportunities in AIOps Industry
Emerging opportunities include the integration of AIOps with other technologies such as IoT and blockchain, creating novel applications and value propositions. Strategic partnerships and collaborations between AIOps vendors and technology providers will be crucial for expanding market reach and accelerating adoption. Expansion into new markets and industry verticals presents further growth potential. The development of specialized AIOps solutions for specific industry needs will also be a key driver of future growth.
Leading Players in the AIOps Industry Sector
Key Milestones in AIOps Industry Industry
- October 2022: IBM announced version 3.5 availability of the IBM Cloud Pak for Watson AIOps, enhancing business context data and prioritization capabilities.
- September 2022: Fortinet announced improved AIOps capabilities across its networking portfolio, including AI-based network services management for 5G/LTE gateways.
- March 2022: Deloitte launched AIOPS.D, a plug-and-play modular services platform powered by AI for autonomous business process management.
Strategic Outlook for AIOps Industry Market
The AIOps market is poised for continued strong growth, driven by technological advancements, increasing adoption across various industries, and the rising need for efficient IT operations. Strategic partnerships, investments in R&D, and expansion into new markets will be crucial for realizing the long-term potential of AIOps and creating substantial value. The focus on AI-driven automation and proactive issue resolution will continue to shape the future of the AIOps market, enabling organizations to enhance efficiency, optimize resource allocation, and achieve significant cost savings.
AIOps Industry Segmentation
-
1. Organization Type
- 1.1. Small and Medium Enterprises
- 1.2. Large Enterprise
-
2. Deployment
- 2.1. On-Premise
- 2.2. Cloud/SaaS
-
3. End-User Industry
- 3.1. Media and Entertainment
- 3.2. IT and Telecom
- 3.3. Retail
- 3.4. Healthcare
- 3.5. BFSI
- 3.6. Other End-User Industries
AIOps Industry Segmentation By Geography
- 1. North America
- 2. Europe
- 3. Asia Pacific
- 4. Latin America
- 5. Middle East and Africa
AIOps Industry REPORT HIGHLIGHTS
| Aspects | Details |
|---|---|
| Study Period | 2019-2033 |
| Base Year | 2024 |
| Estimated Year | 2025 |
| Forecast Period | 2025-2033 |
| Historical Period | 2019-2024 |
| Growth Rate | CAGR of 24.01% from 2019-2033 |
| Segmentation |
|
Table of Contents
- 1. Introduction
- 1.1. Research Scope
- 1.2. Market Segmentation
- 1.3. Research Methodology
- 1.4. Definitions and Assumptions
- 2. Executive Summary
- 2.1. Introduction
- 3. Market Dynamics
- 3.1. Introduction
- 3.2. Market Drivers
- 3.2.1. Growing demand for AI-based services in IT operations; Increasing end-to-end business application assurance and uptime
- 3.3. Market Restrains
- 3.3.1. Increasing number of changes in IT operations
- 3.4. Market Trends
- 3.4.1. BFSI is Expected to Hold Significant Share
- 4. Market Factor Analysis
- 4.1. Porters Five Forces
- 4.2. Supply/Value Chain
- 4.3. PESTEL analysis
- 4.4. Market Entropy
- 4.5. Patent/Trademark Analysis
- 5. Global AIOps Industry Analysis, Insights and Forecast, 2019-2031
- 5.1. Market Analysis, Insights and Forecast - by Organization Type
- 5.1.1. Small and Medium Enterprises
- 5.1.2. Large Enterprise
- 5.2. Market Analysis, Insights and Forecast - by Deployment
- 5.2.1. On-Premise
- 5.2.2. Cloud/SaaS
- 5.3. Market Analysis, Insights and Forecast - by End-User Industry
- 5.3.1. Media and Entertainment
- 5.3.2. IT and Telecom
- 5.3.3. Retail
- 5.3.4. Healthcare
- 5.3.5. BFSI
- 5.3.6. Other End-User Industries
- 5.4. Market Analysis, Insights and Forecast - by Region
- 5.4.1. North America
- 5.4.2. Europe
- 5.4.3. Asia Pacific
- 5.4.4. Latin America
- 5.4.5. Middle East and Africa
- 5.1. Market Analysis, Insights and Forecast - by Organization Type
- 6. North America AIOps Industry Analysis, Insights and Forecast, 2019-2031
- 6.1. Market Analysis, Insights and Forecast - by Organization Type
- 6.1.1. Small and Medium Enterprises
- 6.1.2. Large Enterprise
- 6.2. Market Analysis, Insights and Forecast - by Deployment
- 6.2.1. On-Premise
- 6.2.2. Cloud/SaaS
- 6.3. Market Analysis, Insights and Forecast - by End-User Industry
- 6.3.1. Media and Entertainment
- 6.3.2. IT and Telecom
- 6.3.3. Retail
- 6.3.4. Healthcare
- 6.3.5. BFSI
- 6.3.6. Other End-User Industries
- 6.1. Market Analysis, Insights and Forecast - by Organization Type
- 7. Europe AIOps Industry Analysis, Insights and Forecast, 2019-2031
- 7.1. Market Analysis, Insights and Forecast - by Organization Type
- 7.1.1. Small and Medium Enterprises
- 7.1.2. Large Enterprise
- 7.2. Market Analysis, Insights and Forecast - by Deployment
- 7.2.1. On-Premise
- 7.2.2. Cloud/SaaS
- 7.3. Market Analysis, Insights and Forecast - by End-User Industry
- 7.3.1. Media and Entertainment
- 7.3.2. IT and Telecom
- 7.3.3. Retail
- 7.3.4. Healthcare
- 7.3.5. BFSI
- 7.3.6. Other End-User Industries
- 7.1. Market Analysis, Insights and Forecast - by Organization Type
- 8. Asia Pacific AIOps Industry Analysis, Insights and Forecast, 2019-2031
- 8.1. Market Analysis, Insights and Forecast - by Organization Type
- 8.1.1. Small and Medium Enterprises
- 8.1.2. Large Enterprise
- 8.2. Market Analysis, Insights and Forecast - by Deployment
- 8.2.1. On-Premise
- 8.2.2. Cloud/SaaS
- 8.3. Market Analysis, Insights and Forecast - by End-User Industry
- 8.3.1. Media and Entertainment
- 8.3.2. IT and Telecom
- 8.3.3. Retail
- 8.3.4. Healthcare
- 8.3.5. BFSI
- 8.3.6. Other End-User Industries
- 8.1. Market Analysis, Insights and Forecast - by Organization Type
- 9. Latin America AIOps Industry Analysis, Insights and Forecast, 2019-2031
- 9.1. Market Analysis, Insights and Forecast - by Organization Type
- 9.1.1. Small and Medium Enterprises
- 9.1.2. Large Enterprise
- 9.2. Market Analysis, Insights and Forecast - by Deployment
- 9.2.1. On-Premise
- 9.2.2. Cloud/SaaS
- 9.3. Market Analysis, Insights and Forecast - by End-User Industry
- 9.3.1. Media and Entertainment
- 9.3.2. IT and Telecom
- 9.3.3. Retail
- 9.3.4. Healthcare
- 9.3.5. BFSI
- 9.3.6. Other End-User Industries
- 9.1. Market Analysis, Insights and Forecast - by Organization Type
- 10. Middle East and Africa AIOps Industry Analysis, Insights and Forecast, 2019-2031
- 10.1. Market Analysis, Insights and Forecast - by Organization Type
- 10.1.1. Small and Medium Enterprises
- 10.1.2. Large Enterprise
- 10.2. Market Analysis, Insights and Forecast - by Deployment
- 10.2.1. On-Premise
- 10.2.2. Cloud/SaaS
- 10.3. Market Analysis, Insights and Forecast - by End-User Industry
- 10.3.1. Media and Entertainment
- 10.3.2. IT and Telecom
- 10.3.3. Retail
- 10.3.4. Healthcare
- 10.3.5. BFSI
- 10.3.6. Other End-User Industries
- 10.1. Market Analysis, Insights and Forecast - by Organization Type
- 11. North America AIOps Industry Analysis, Insights and Forecast, 2019-2031
- 11.1. Market Analysis, Insights and Forecast - By Country/Sub-region
- 11.1.1 United States
- 11.1.2 Canada
- 11.1.3 Mexico
- 12. Europe AIOps Industry Analysis, Insights and Forecast, 2019-2031
- 12.1. Market Analysis, Insights and Forecast - By Country/Sub-region
- 12.1.1 Germany
- 12.1.2 United Kingdom
- 12.1.3 France
- 12.1.4 Spain
- 12.1.5 Italy
- 12.1.6 Spain
- 12.1.7 Belgium
- 12.1.8 Netherland
- 12.1.9 Nordics
- 12.1.10 Rest of Europe
- 13. Asia Pacific AIOps Industry Analysis, Insights and Forecast, 2019-2031
- 13.1. Market Analysis, Insights and Forecast - By Country/Sub-region
- 13.1.1 China
- 13.1.2 Japan
- 13.1.3 India
- 13.1.4 South Korea
- 13.1.5 Southeast Asia
- 13.1.6 Australia
- 13.1.7 Indonesia
- 13.1.8 Phillipes
- 13.1.9 Singapore
- 13.1.10 Thailandc
- 13.1.11 Rest of Asia Pacific
- 14. South America AIOps Industry Analysis, Insights and Forecast, 2019-2031
- 14.1. Market Analysis, Insights and Forecast - By Country/Sub-region
- 14.1.1 Brazil
- 14.1.2 Argentina
- 14.1.3 Peru
- 14.1.4 Chile
- 14.1.5 Colombia
- 14.1.6 Ecuador
- 14.1.7 Venezuela
- 14.1.8 Rest of South America
- 15. MEA AIOps Industry Analysis, Insights and Forecast, 2019-2031
- 15.1. Market Analysis, Insights and Forecast - By Country/Sub-region
- 15.1.1 United Arab Emirates
- 15.1.2 Saudi Arabia
- 15.1.3 South Africa
- 15.1.4 Rest of Middle East and Africa
- 16. Competitive Analysis
- 16.1. Global Market Share Analysis 2024
- 16.2. Company Profiles
- 16.2.1 IBM
- 16.2.1.1. Overview
- 16.2.1.2. Products
- 16.2.1.3. SWOT Analysis
- 16.2.1.4. Recent Developments
- 16.2.1.5. Financials (Based on Availability)
- 16.2.2 Cisco
- 16.2.2.1. Overview
- 16.2.2.2. Products
- 16.2.2.3. SWOT Analysis
- 16.2.2.4. Recent Developments
- 16.2.2.5. Financials (Based on Availability)
- 16.2.3 Splunk
- 16.2.3.1. Overview
- 16.2.3.2. Products
- 16.2.3.3. SWOT Analysis
- 16.2.3.4. Recent Developments
- 16.2.3.5. Financials (Based on Availability)
- 16.2.4 ServiceNow
- 16.2.4.1. Overview
- 16.2.4.2. Products
- 16.2.4.3. SWOT Analysis
- 16.2.4.4. Recent Developments
- 16.2.4.5. Financials (Based on Availability)
- 16.2.5 BMC Software
- 16.2.5.1. Overview
- 16.2.5.2. Products
- 16.2.5.3. SWOT Analysis
- 16.2.5.4. Recent Developments
- 16.2.5.5. Financials (Based on Availability)
- 16.2.1 IBM
List of Figures
- Figure 1: Global AIOps Industry Revenue Breakdown (Million, %) by Region 2024 & 2032
- Figure 2: North America AIOps Industry Revenue (Million), by Country 2024 & 2032
- Figure 3: North America AIOps Industry Revenue Share (%), by Country 2024 & 2032
- Figure 4: Europe AIOps Industry Revenue (Million), by Country 2024 & 2032
- Figure 5: Europe AIOps Industry Revenue Share (%), by Country 2024 & 2032
- Figure 6: Asia Pacific AIOps Industry Revenue (Million), by Country 2024 & 2032
- Figure 7: Asia Pacific AIOps Industry Revenue Share (%), by Country 2024 & 2032
- Figure 8: South America AIOps Industry Revenue (Million), by Country 2024 & 2032
- Figure 9: South America AIOps Industry Revenue Share (%), by Country 2024 & 2032
- Figure 10: MEA AIOps Industry Revenue (Million), by Country 2024 & 2032
- Figure 11: MEA AIOps Industry Revenue Share (%), by Country 2024 & 2032
- Figure 12: North America AIOps Industry Revenue (Million), by Organization Type 2024 & 2032
- Figure 13: North America AIOps Industry Revenue Share (%), by Organization Type 2024 & 2032
- Figure 14: North America AIOps Industry Revenue (Million), by Deployment 2024 & 2032
- Figure 15: North America AIOps Industry Revenue Share (%), by Deployment 2024 & 2032
- Figure 16: North America AIOps Industry Revenue (Million), by End-User Industry 2024 & 2032
- Figure 17: North America AIOps Industry Revenue Share (%), by End-User Industry 2024 & 2032
- Figure 18: North America AIOps Industry Revenue (Million), by Country 2024 & 2032
- Figure 19: North America AIOps Industry Revenue Share (%), by Country 2024 & 2032
- Figure 20: Europe AIOps Industry Revenue (Million), by Organization Type 2024 & 2032
- Figure 21: Europe AIOps Industry Revenue Share (%), by Organization Type 2024 & 2032
- Figure 22: Europe AIOps Industry Revenue (Million), by Deployment 2024 & 2032
- Figure 23: Europe AIOps Industry Revenue Share (%), by Deployment 2024 & 2032
- Figure 24: Europe AIOps Industry Revenue (Million), by End-User Industry 2024 & 2032
- Figure 25: Europe AIOps Industry Revenue Share (%), by End-User Industry 2024 & 2032
- Figure 26: Europe AIOps Industry Revenue (Million), by Country 2024 & 2032
- Figure 27: Europe AIOps Industry Revenue Share (%), by Country 2024 & 2032
- Figure 28: Asia Pacific AIOps Industry Revenue (Million), by Organization Type 2024 & 2032
- Figure 29: Asia Pacific AIOps Industry Revenue Share (%), by Organization Type 2024 & 2032
- Figure 30: Asia Pacific AIOps Industry Revenue (Million), by Deployment 2024 & 2032
- Figure 31: Asia Pacific AIOps Industry Revenue Share (%), by Deployment 2024 & 2032
- Figure 32: Asia Pacific AIOps Industry Revenue (Million), by End-User Industry 2024 & 2032
- Figure 33: Asia Pacific AIOps Industry Revenue Share (%), by End-User Industry 2024 & 2032
- Figure 34: Asia Pacific AIOps Industry Revenue (Million), by Country 2024 & 2032
- Figure 35: Asia Pacific AIOps Industry Revenue Share (%), by Country 2024 & 2032
- Figure 36: Latin America AIOps Industry Revenue (Million), by Organization Type 2024 & 2032
- Figure 37: Latin America AIOps Industry Revenue Share (%), by Organization Type 2024 & 2032
- Figure 38: Latin America AIOps Industry Revenue (Million), by Deployment 2024 & 2032
- Figure 39: Latin America AIOps Industry Revenue Share (%), by Deployment 2024 & 2032
- Figure 40: Latin America AIOps Industry Revenue (Million), by End-User Industry 2024 & 2032
- Figure 41: Latin America AIOps Industry Revenue Share (%), by End-User Industry 2024 & 2032
- Figure 42: Latin America AIOps Industry Revenue (Million), by Country 2024 & 2032
- Figure 43: Latin America AIOps Industry Revenue Share (%), by Country 2024 & 2032
- Figure 44: Middle East and Africa AIOps Industry Revenue (Million), by Organization Type 2024 & 2032
- Figure 45: Middle East and Africa AIOps Industry Revenue Share (%), by Organization Type 2024 & 2032
- Figure 46: Middle East and Africa AIOps Industry Revenue (Million), by Deployment 2024 & 2032
- Figure 47: Middle East and Africa AIOps Industry Revenue Share (%), by Deployment 2024 & 2032
- Figure 48: Middle East and Africa AIOps Industry Revenue (Million), by End-User Industry 2024 & 2032
- Figure 49: Middle East and Africa AIOps Industry Revenue Share (%), by End-User Industry 2024 & 2032
- Figure 50: Middle East and Africa AIOps Industry Revenue (Million), by Country 2024 & 2032
- Figure 51: Middle East and Africa AIOps Industry Revenue Share (%), by Country 2024 & 2032
List of Tables
- Table 1: Global AIOps Industry Revenue Million Forecast, by Region 2019 & 2032
- Table 2: Global AIOps Industry Revenue Million Forecast, by Organization Type 2019 & 2032
- Table 3: Global AIOps Industry Revenue Million Forecast, by Deployment 2019 & 2032
- Table 4: Global AIOps Industry Revenue Million Forecast, by End-User Industry 2019 & 2032
- Table 5: Global AIOps Industry Revenue Million Forecast, by Region 2019 & 2032
- Table 6: Global AIOps Industry Revenue Million Forecast, by Country 2019 & 2032
- Table 7: United States AIOps Industry Revenue (Million) Forecast, by Application 2019 & 2032
- Table 8: Canada AIOps Industry Revenue (Million) Forecast, by Application 2019 & 2032
- Table 9: Mexico AIOps Industry Revenue (Million) Forecast, by Application 2019 & 2032
- Table 10: Global AIOps Industry Revenue Million Forecast, by Country 2019 & 2032
- Table 11: Germany AIOps Industry Revenue (Million) Forecast, by Application 2019 & 2032
- Table 12: United Kingdom AIOps Industry Revenue (Million) Forecast, by Application 2019 & 2032
- Table 13: France AIOps Industry Revenue (Million) Forecast, by Application 2019 & 2032
- Table 14: Spain AIOps Industry Revenue (Million) Forecast, by Application 2019 & 2032
- Table 15: Italy AIOps Industry Revenue (Million) Forecast, by Application 2019 & 2032
- Table 16: Spain AIOps Industry Revenue (Million) Forecast, by Application 2019 & 2032
- Table 17: Belgium AIOps Industry Revenue (Million) Forecast, by Application 2019 & 2032
- Table 18: Netherland AIOps Industry Revenue (Million) Forecast, by Application 2019 & 2032
- Table 19: Nordics AIOps Industry Revenue (Million) Forecast, by Application 2019 & 2032
- Table 20: Rest of Europe AIOps Industry Revenue (Million) Forecast, by Application 2019 & 2032
- Table 21: Global AIOps Industry Revenue Million Forecast, by Country 2019 & 2032
- Table 22: China AIOps Industry Revenue (Million) Forecast, by Application 2019 & 2032
- Table 23: Japan AIOps Industry Revenue (Million) Forecast, by Application 2019 & 2032
- Table 24: India AIOps Industry Revenue (Million) Forecast, by Application 2019 & 2032
- Table 25: South Korea AIOps Industry Revenue (Million) Forecast, by Application 2019 & 2032
- Table 26: Southeast Asia AIOps Industry Revenue (Million) Forecast, by Application 2019 & 2032
- Table 27: Australia AIOps Industry Revenue (Million) Forecast, by Application 2019 & 2032
- Table 28: Indonesia AIOps Industry Revenue (Million) Forecast, by Application 2019 & 2032
- Table 29: Phillipes AIOps Industry Revenue (Million) Forecast, by Application 2019 & 2032
- Table 30: Singapore AIOps Industry Revenue (Million) Forecast, by Application 2019 & 2032
- Table 31: Thailandc AIOps Industry Revenue (Million) Forecast, by Application 2019 & 2032
- Table 32: Rest of Asia Pacific AIOps Industry Revenue (Million) Forecast, by Application 2019 & 2032
- Table 33: Global AIOps Industry Revenue Million Forecast, by Country 2019 & 2032
- Table 34: Brazil AIOps Industry Revenue (Million) Forecast, by Application 2019 & 2032
- Table 35: Argentina AIOps Industry Revenue (Million) Forecast, by Application 2019 & 2032
- Table 36: Peru AIOps Industry Revenue (Million) Forecast, by Application 2019 & 2032
- Table 37: Chile AIOps Industry Revenue (Million) Forecast, by Application 2019 & 2032
- Table 38: Colombia AIOps Industry Revenue (Million) Forecast, by Application 2019 & 2032
- Table 39: Ecuador AIOps Industry Revenue (Million) Forecast, by Application 2019 & 2032
- Table 40: Venezuela AIOps Industry Revenue (Million) Forecast, by Application 2019 & 2032
- Table 41: Rest of South America AIOps Industry Revenue (Million) Forecast, by Application 2019 & 2032
- Table 42: Global AIOps Industry Revenue Million Forecast, by Country 2019 & 2032
- Table 43: United Arab Emirates AIOps Industry Revenue (Million) Forecast, by Application 2019 & 2032
- Table 44: Saudi Arabia AIOps Industry Revenue (Million) Forecast, by Application 2019 & 2032
- Table 45: South Africa AIOps Industry Revenue (Million) Forecast, by Application 2019 & 2032
- Table 46: Rest of Middle East and Africa AIOps Industry Revenue (Million) Forecast, by Application 2019 & 2032
- Table 47: Global AIOps Industry Revenue Million Forecast, by Organization Type 2019 & 2032
- Table 48: Global AIOps Industry Revenue Million Forecast, by Deployment 2019 & 2032
- Table 49: Global AIOps Industry Revenue Million Forecast, by End-User Industry 2019 & 2032
- Table 50: Global AIOps Industry Revenue Million Forecast, by Country 2019 & 2032
- Table 51: Global AIOps Industry Revenue Million Forecast, by Organization Type 2019 & 2032
- Table 52: Global AIOps Industry Revenue Million Forecast, by Deployment 2019 & 2032
- Table 53: Global AIOps Industry Revenue Million Forecast, by End-User Industry 2019 & 2032
- Table 54: Global AIOps Industry Revenue Million Forecast, by Country 2019 & 2032
- Table 55: Global AIOps Industry Revenue Million Forecast, by Organization Type 2019 & 2032
- Table 56: Global AIOps Industry Revenue Million Forecast, by Deployment 2019 & 2032
- Table 57: Global AIOps Industry Revenue Million Forecast, by End-User Industry 2019 & 2032
- Table 58: Global AIOps Industry Revenue Million Forecast, by Country 2019 & 2032
- Table 59: Global AIOps Industry Revenue Million Forecast, by Organization Type 2019 & 2032
- Table 60: Global AIOps Industry Revenue Million Forecast, by Deployment 2019 & 2032
- Table 61: Global AIOps Industry Revenue Million Forecast, by End-User Industry 2019 & 2032
- Table 62: Global AIOps Industry Revenue Million Forecast, by Country 2019 & 2032
- Table 63: Global AIOps Industry Revenue Million Forecast, by Organization Type 2019 & 2032
- Table 64: Global AIOps Industry Revenue Million Forecast, by Deployment 2019 & 2032
- Table 65: Global AIOps Industry Revenue Million Forecast, by End-User Industry 2019 & 2032
- Table 66: Global AIOps Industry Revenue Million Forecast, by Country 2019 & 2032
Frequently Asked Questions
1. What is the projected Compound Annual Growth Rate (CAGR) of the AIOps Industry?
The projected CAGR is approximately 24.01%.
2. Which companies are prominent players in the AIOps Industry?
Key companies in the market include IBM , Cisco , Splunk , ServiceNow , BMC Software.
3. What are the main segments of the AIOps Industry?
The market segments include Organization Type, Deployment, End-User Industry.
4. Can you provide details about the market size?
The market size is estimated to be USD 27.24 Million as of 2022.
5. What are some drivers contributing to market growth?
Growing demand for AI-based services in IT operations; Increasing end-to-end business application assurance and uptime.
6. What are the notable trends driving market growth?
BFSI is Expected to Hold Significant Share.
7. Are there any restraints impacting market growth?
Increasing number of changes in IT operations.
8. Can you provide examples of recent developments in the market?
October 2022- IBM announced version 3.5 availability of the IBM Cloud Pak for Watson AIOps. With an emphasis on the capability to assist the users in understanding priorities among all IT stories in the context of a business line or service, IBM Cloud Pak for Watson AIOps v3.5 seeks to close this gap. Business context data is made available on an AIOps Insights Dashboard by Cloud Pak for Watson AIOps v3.5, a new offering feature in this release. It provides an illustration of the buyer context for the stakeholders to link business key performance indicators (KPIs) to application problems and rank repair options according to their potential effect.
9. What pricing options are available for accessing the report?
Pricing options include single-user, multi-user, and enterprise licenses priced at USD 4750, USD 5250, and USD 8750 respectively.
10. Is the market size provided in terms of value or volume?
The market size is provided in terms of value, measured in Million.
11. Are there any specific market keywords associated with the report?
Yes, the market keyword associated with the report is "AIOps Industry," which aids in identifying and referencing the specific market segment covered.
12. How do I determine which pricing option suits my needs best?
The pricing options vary based on user requirements and access needs. Individual users may opt for single-user licenses, while businesses requiring broader access may choose multi-user or enterprise licenses for cost-effective access to the report.
13. Are there any additional resources or data provided in the AIOps Industry report?
While the report offers comprehensive insights, it's advisable to review the specific contents or supplementary materials provided to ascertain if additional resources or data are available.
14. How can I stay updated on further developments or reports in the AIOps Industry?
To stay informed about further developments, trends, and reports in the AIOps Industry, consider subscribing to industry newsletters, following relevant companies and organizations, or regularly checking reputable industry news sources and publications.
Methodology
Step 1 - Identification of Relevant Samples Size from Population Database


Step 2 - Approaches for Defining Global Market Size (Value, Volume* & Price*)

Note*: In applicable scenarios
Step 3 - Data Sources
Primary Research
- Web Analytics
- Survey Reports
- Research Institute
- Latest Research Reports
- Opinion Leaders
Secondary Research
- Annual Reports
- White Paper
- Latest Press Release
- Industry Association
- Paid Database
- Investor Presentations

Step 4 - Data Triangulation
Involves using different sources of information in order to increase the validity of a study
These sources are likely to be stakeholders in a program - participants, other researchers, program staff, other community members, and so on.
Then we put all data in single framework & apply various statistical tools to find out the dynamic on the market.
During the analysis stage, feedback from the stakeholder groups would be compared to determine areas of agreement as well as areas of divergence
