

Key Insights
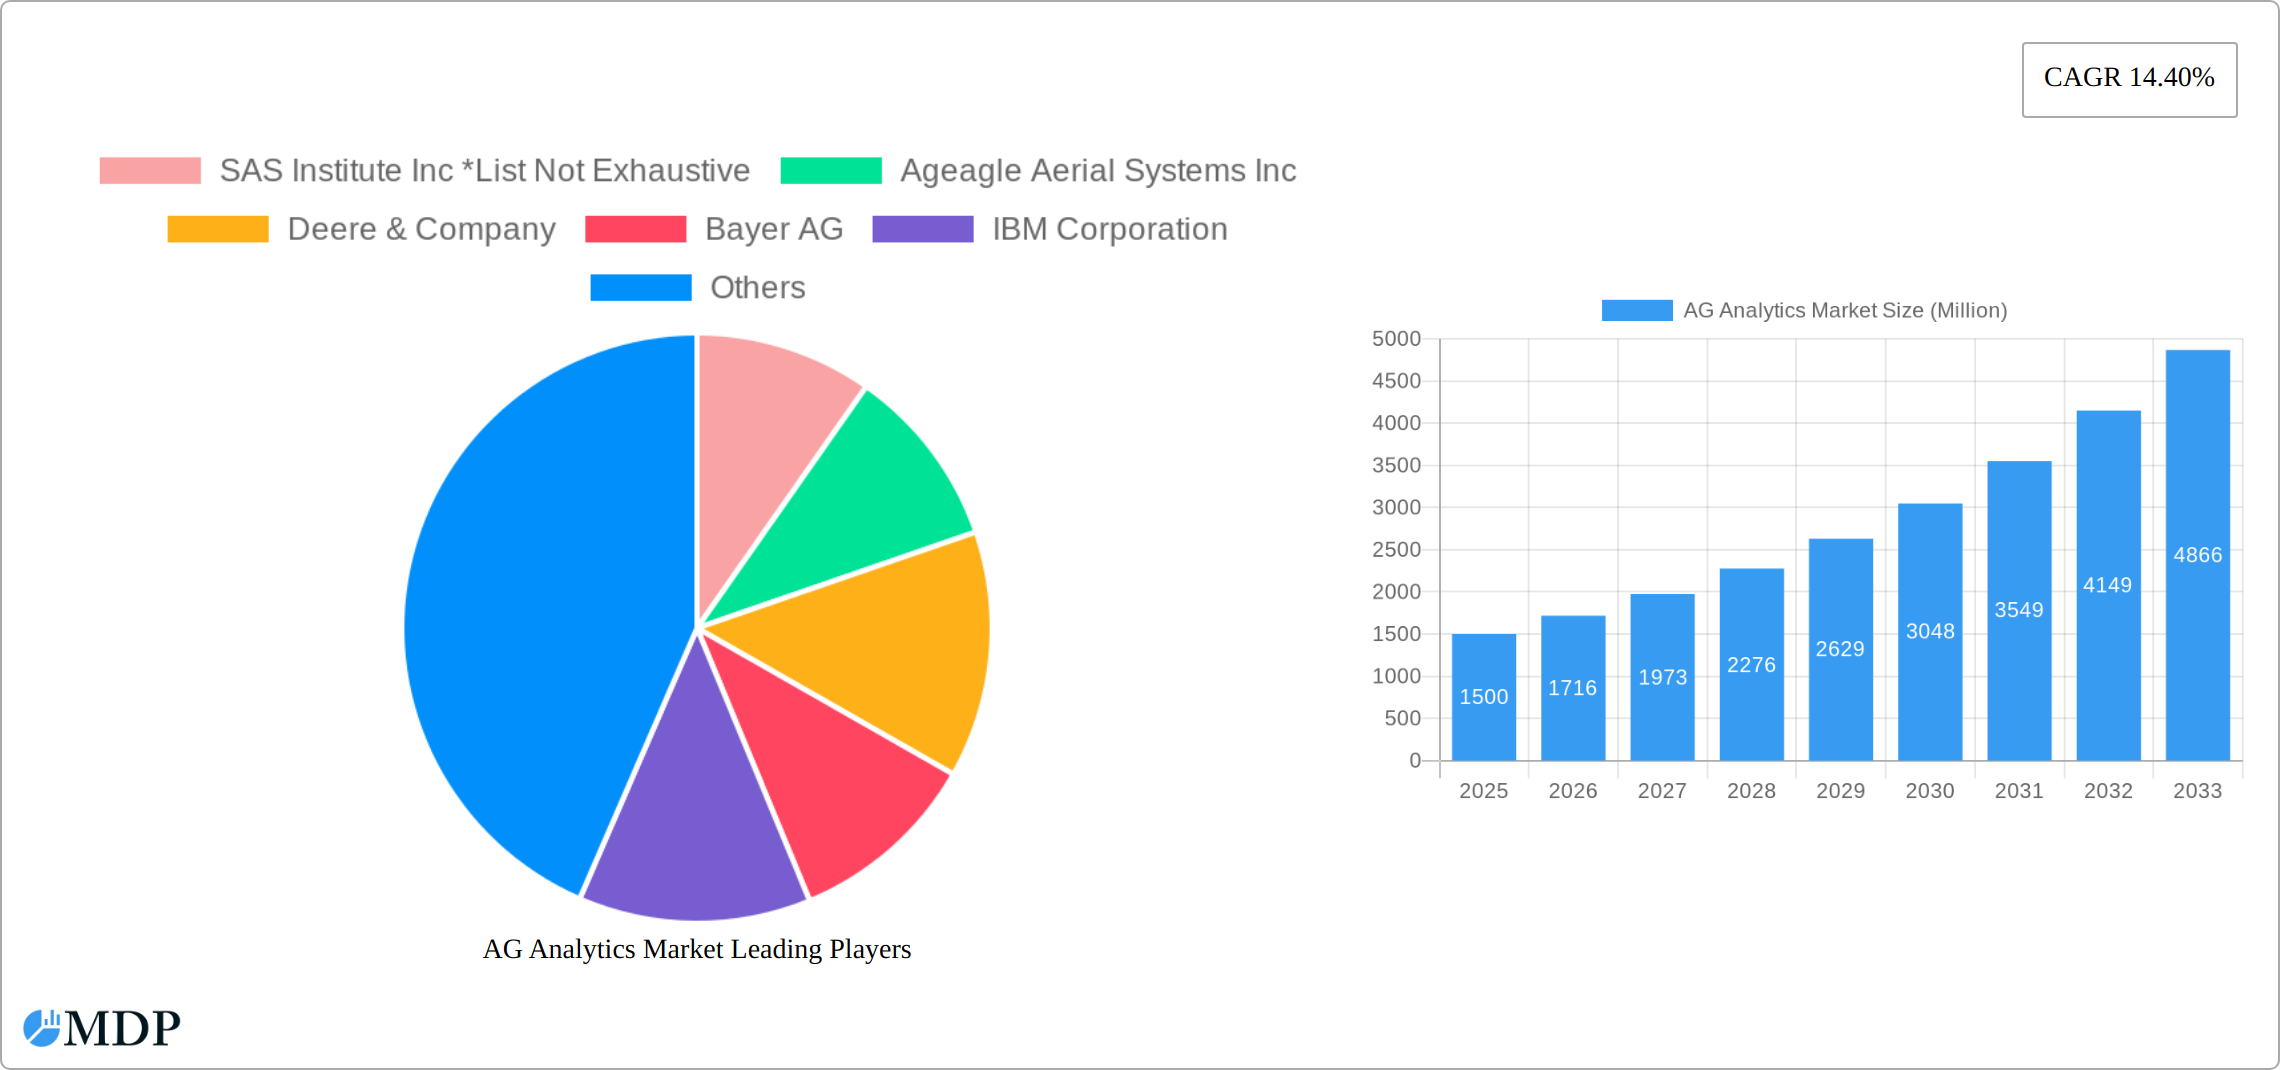
The global agricultural analytics market is experiencing robust growth, projected to reach a substantial size by 2033, driven by the increasing adoption of precision agriculture techniques and the rising demand for improved farm efficiency and yields. A compound annual growth rate (CAGR) of 14.40% from 2025 to 2033 indicates a significant market expansion. Key drivers include the growing need for data-driven decision-making in farming, advancements in sensor technologies, and the increasing availability of affordable cloud-based solutions. The market is segmented by deployment type (on-premise and cloud), farm size (small and medium farms, large farms), component type (solutions and services), and analytics type (farm analytics and livestock analytics). The cloud-based segment is expected to witness faster growth due to its scalability and accessibility. Large farms are anticipated to contribute significantly to the market revenue due to their higher adoption rate of advanced technologies. Solutions, encompassing software and hardware, represent a larger market share compared to services, reflecting the initial investment required for implementing agricultural analytics. While data privacy concerns and high initial investment costs pose certain restraints, the overall market outlook remains positive, fueled by government initiatives promoting technological adoption in agriculture and the growing awareness among farmers about the benefits of data-driven farming.
The competitive landscape is characterized by a mix of established players and emerging technology providers. Companies such as SAS Institute Inc., Deere & Company, Bayer AG, IBM Corporation, and Trimble Inc., are leveraging their existing expertise and market presence to offer comprehensive agricultural analytics solutions. Smaller, specialized companies are focusing on niche segments like drone-based data acquisition and specific software solutions. The market's geographical distribution reveals a strong presence in North America and Europe, driven by early adoption of precision agriculture. However, the Asia-Pacific region is expected to witness significant growth in the coming years due to the expanding agricultural sector and increasing investments in agricultural technologies. This growth is likely to be fueled by the increasing adoption of precision agriculture in developing countries within the region, leading to overall global market expansion.
Unlock the Potential of the AG Analytics Market: A Comprehensive Report (2019-2033)
This comprehensive report provides an in-depth analysis of the global AG Analytics Market, offering invaluable insights for stakeholders across the agricultural technology landscape. From market dynamics and leading players to emerging opportunities and future growth projections, this report equips you with the knowledge to navigate this rapidly evolving sector. The market is projected to reach xx Million by 2033, showcasing substantial growth potential. Our analysis covers the period from 2019 to 2033, with a focus on the estimated year 2025 and a forecast period spanning 2025-2033.
AG Analytics Market Market Dynamics & Concentration
The AG Analytics market is characterized by a moderately consolidated landscape, with key players like SAS Institute Inc., Deere & Company, and IBM Corporation holding significant market share. However, the market also features numerous smaller, specialized companies driving innovation and competition. The market's concentration ratio (CR4) is estimated to be around xx%, indicating a competitive yet concentrated environment. Several factors influence market dynamics:
- Innovation Drivers: Advancements in AI, machine learning, and sensor technologies are fueling the development of sophisticated analytics solutions, leading to increased efficiency and yield optimization in agriculture.
- Regulatory Frameworks: Government regulations concerning data privacy and the use of agricultural data are shaping market practices and influencing adoption rates.
- Product Substitutes: Traditional farming methods and simpler data management systems pose a competitive challenge to sophisticated AG analytics solutions.
- End-User Trends: Growing awareness of precision agriculture techniques and the need for data-driven decision-making are key drivers of market growth. Large farms are currently leading the adoption, but increasing accessibility is driving growth within small and medium farms.
- M&A Activities: The number of mergers and acquisitions in the sector has increased in recent years, reaching xx deals in 2024, indicating consolidation and strategic expansion among players. This is expected to continue to consolidate market share amongst major players.
AG Analytics Market Industry Trends & Analysis
The AG Analytics market exhibits strong growth potential, with a projected Compound Annual Growth Rate (CAGR) of xx% during the forecast period (2025-2033). This growth is fueled by multiple factors:
- Market Growth Drivers: Rising demand for increased crop yields, efficient resource management, and optimized farm operations are driving the adoption of AG analytics. The increasing penetration of IoT devices and the availability of affordable high-speed internet in rural areas are also key contributors.
- Technological Disruptions: The continuous integration of artificial intelligence (AI), machine learning (ML), and advanced sensor technologies within AG analytics solutions is revolutionizing farm management practices. Drone technology is accelerating progress and reducing the need for physical intervention within fields.
- Consumer Preferences: Farmers are increasingly seeking data-driven insights to improve productivity and profitability. This preference for precision agriculture is driving demand for sophisticated analytics solutions.
- Competitive Dynamics: The market is characterized by both intense competition and strategic collaborations. Established players are expanding their product portfolios, while new entrants are disrupting the market with innovative solutions. Market penetration rates are gradually increasing across all segments. In 2025 the market penetration rate for large farms is projected to reach xx%, with small to medium farms showing a slower penetration rate of xx%.

Leading Markets & Segments in AG Analytics Market
The North American region currently dominates the AG Analytics market, driven by technological advancements, early adoption of precision agriculture techniques, and the presence of established players. However, the Asia-Pacific region is expected to experience significant growth in the coming years. Key segment analysis reveals the following:
- Deployment Type: The cloud-based deployment model is gaining traction, primarily due to its scalability, accessibility, and cost-effectiveness compared to on-premise solutions.
- Farm Size: Large farms currently represent the largest segment, owing to higher investment capabilities and greater returns on investment. However, the small and medium farm segment demonstrates significant growth potential as technology becomes more accessible and affordable.
- Component Type: Solutions dominate the market, with services playing a crucial role in supporting the implementation and utilization of these solutions.
- Type: Farm analytics currently holds a larger market share compared to livestock analytics. This is driven by factors like higher adoption rates and the availability of more mature solutions. Livestock analytics is expected to show faster growth in future years.
Key Drivers for Dominance:
- North America: Strong technological infrastructure, early adoption of precision agriculture, and the presence of major AG technology players.
- Large Farms: Higher investment capabilities, potential for significant returns on investment from data-driven decisions, and established data management infrastructure.
- Solutions: The comprehensive nature of solutions provides greater value and caters to the need for end-to-end farm management.
AG Analytics Market Product Developments
Recent product innovations in the AG Analytics market focus on integrating AI and machine learning capabilities to enhance predictive analytics, automate decision-making, and improve the accuracy of yield forecasts. Advanced sensor technologies coupled with drone imagery enable real-time monitoring of crop health, soil conditions, and livestock behavior. These technological advancements are improving market fit by streamlining operations and offering higher ROI for end-users.
Key Drivers of AG Analytics Market Growth
Several key factors are propelling the growth of the AG Analytics market:
- Technological Advancements: The integration of AI, ML, IoT, and remote sensing technologies is enabling the creation of more efficient, accurate, and user-friendly solutions.
- Economic Factors: The increasing demand for food security, coupled with rising labor costs, incentivizes farmers to adopt AG analytics for optimized resource allocation and improved productivity.
- Regulatory Support: Government initiatives promoting the adoption of precision agriculture and technological innovation in the agricultural sector are driving market growth.
Challenges in the AG Analytics Market Market
Despite its growth potential, the AG Analytics market faces certain challenges:
- Data Privacy Concerns: The handling of sensitive farm data raises concerns about privacy and security, potentially hindering adoption in some regions.
- High Initial Investment Costs: The cost of implementing AG analytics solutions can be prohibitive for some farmers, particularly those with limited resources.
- Integration complexities: Integrating various AG analytics tools and data sources can be complex, impacting adoption rates.
Emerging Opportunities in AG Analytics Market
The long-term growth of the AG Analytics market is promising due to several emerging opportunities:
- Expansion into Developing Countries: The growing adoption of precision agriculture techniques in developing countries with large agricultural sectors presents significant market expansion potential.
- Development of specialized solutions: Solutions catering to specific crops or livestock types create niche markets and drive the development of new technologies.
- Strategic Partnerships and Collaborations: Synergies between AG technology companies, agricultural research institutions, and farmers foster innovation and widespread adoption.
Leading Players in the AG Analytics Market Sector
- SAS Institute Inc
- Ageagle Aerial Systems Inc
- Deere & Company
- Bayer AG
- IBM Corporation
- Conservis Corporation
- PrecisionHawk Inc
- Trimble Inc
- Vistex Inc
- Iteris Inc
- Agrivi
Key Milestones in AG Analytics Market Industry
- 2020: Increased adoption of cloud-based AG analytics solutions.
- 2021: Launch of several AI-powered precision agriculture platforms.
- 2022: Significant investments in agricultural technology startups.
- 2023: Growing integration of drone technology for data collection.
- 2024: Several major mergers and acquisitions within the AG Analytics sector.
Strategic Outlook for AG Analytics Market Market
The AG Analytics market is poised for continued growth, driven by technological advancements, rising demand for efficient farming practices, and supportive regulatory frameworks. Strategic opportunities lie in expanding into underserved markets, developing specialized solutions, and fostering partnerships to accelerate market penetration. The future of agriculture is undeniably data-driven, and the AG Analytics market is at the forefront of this transformation.
AG Analytics Market Segmentation
-
1. Component Type
- 1.1. Solutions
- 1.2. Services
-
2. Type
- 2.1. Farm Analytics
- 2.2. Livestock Analytics
-
3. Deployment Type
- 3.1. On-Premise
- 3.2. Cloud
-
4. Farm Size
- 4.1. Small and Medium Farms
- 4.2. Large Farms
AG Analytics Market Segmentation By Geography
- 1. North America
- 2. Europe
- 3. Asia Pacific
- 4. Latin America
- 5. Middle East and Africa

AG Analytics Market REPORT HIGHLIGHTS
| Aspects | Details |
|---|---|
| Study Period | 2019-2033 |
| Base Year | 2024 |
| Estimated Year | 2025 |
| Forecast Period | 2025-2033 |
| Historical Period | 2019-2024 |
| Growth Rate | CAGR of 14.40% from 2019-2033 |
| Segmentation |
|
Table of Contents
- 1. Introduction
- 1.1. Research Scope
- 1.2. Market Segmentation
- 1.3. Research Methodology
- 1.4. Definitions and Assumptions
- 2. Executive Summary
- 2.1. Introduction
- 3. Market Dynamics
- 3.1. Introduction
- 3.2. Market Drivers
- 3.2.1. ; Rising Usage of Cutting-edge Technology-based Solutions for Farming
- 3.3. Market Restrains
- 3.3.1. ; High Capital Cost and Complexity Regarding System Upgrades
- 3.4. Market Trends
- 3.4.1. Farm Analytics is Expected to Grow at a Significant Rate Over the Forecast Period
- 4. Market Factor Analysis
- 4.1. Porters Five Forces
- 4.2. Supply/Value Chain
- 4.3. PESTEL analysis
- 4.4. Market Entropy
- 4.5. Patent/Trademark Analysis
- 5. Global AG Analytics Market Analysis, Insights and Forecast, 2019-2031
- 5.1. Market Analysis, Insights and Forecast - by Component Type
- 5.1.1. Solutions
- 5.1.2. Services
- 5.2. Market Analysis, Insights and Forecast - by Type
- 5.2.1. Farm Analytics
- 5.2.2. Livestock Analytics
- 5.3. Market Analysis, Insights and Forecast - by Deployment Type
- 5.3.1. On-Premise
- 5.3.2. Cloud
- 5.4. Market Analysis, Insights and Forecast - by Farm Size
- 5.4.1. Small and Medium Farms
- 5.4.2. Large Farms
- 5.5. Market Analysis, Insights and Forecast - by Region
- 5.5.1. North America
- 5.5.2. Europe
- 5.5.3. Asia Pacific
- 5.5.4. Latin America
- 5.5.5. Middle East and Africa
- 5.1. Market Analysis, Insights and Forecast - by Component Type
- 6. North America AG Analytics Market Analysis, Insights and Forecast, 2019-2031
- 6.1. Market Analysis, Insights and Forecast - by Component Type
- 6.1.1. Solutions
- 6.1.2. Services
- 6.2. Market Analysis, Insights and Forecast - by Type
- 6.2.1. Farm Analytics
- 6.2.2. Livestock Analytics
- 6.3. Market Analysis, Insights and Forecast - by Deployment Type
- 6.3.1. On-Premise
- 6.3.2. Cloud
- 6.4. Market Analysis, Insights and Forecast - by Farm Size
- 6.4.1. Small and Medium Farms
- 6.4.2. Large Farms
- 6.1. Market Analysis, Insights and Forecast - by Component Type
- 7. Europe AG Analytics Market Analysis, Insights and Forecast, 2019-2031
- 7.1. Market Analysis, Insights and Forecast - by Component Type
- 7.1.1. Solutions
- 7.1.2. Services
- 7.2. Market Analysis, Insights and Forecast - by Type
- 7.2.1. Farm Analytics
- 7.2.2. Livestock Analytics
- 7.3. Market Analysis, Insights and Forecast - by Deployment Type
- 7.3.1. On-Premise
- 7.3.2. Cloud
- 7.4. Market Analysis, Insights and Forecast - by Farm Size
- 7.4.1. Small and Medium Farms
- 7.4.2. Large Farms
- 7.1. Market Analysis, Insights and Forecast - by Component Type
- 8. Asia Pacific AG Analytics Market Analysis, Insights and Forecast, 2019-2031
- 8.1. Market Analysis, Insights and Forecast - by Component Type
- 8.1.1. Solutions
- 8.1.2. Services
- 8.2. Market Analysis, Insights and Forecast - by Type
- 8.2.1. Farm Analytics
- 8.2.2. Livestock Analytics
- 8.3. Market Analysis, Insights and Forecast - by Deployment Type
- 8.3.1. On-Premise
- 8.3.2. Cloud
- 8.4. Market Analysis, Insights and Forecast - by Farm Size
- 8.4.1. Small and Medium Farms
- 8.4.2. Large Farms
- 8.1. Market Analysis, Insights and Forecast - by Component Type
- 9. Latin America AG Analytics Market Analysis, Insights and Forecast, 2019-2031
- 9.1. Market Analysis, Insights and Forecast - by Component Type
- 9.1.1. Solutions
- 9.1.2. Services
- 9.2. Market Analysis, Insights and Forecast - by Type
- 9.2.1. Farm Analytics
- 9.2.2. Livestock Analytics
- 9.3. Market Analysis, Insights and Forecast - by Deployment Type
- 9.3.1. On-Premise
- 9.3.2. Cloud
- 9.4. Market Analysis, Insights and Forecast - by Farm Size
- 9.4.1. Small and Medium Farms
- 9.4.2. Large Farms
- 9.1. Market Analysis, Insights and Forecast - by Component Type
- 10. Middle East and Africa AG Analytics Market Analysis, Insights and Forecast, 2019-2031
- 10.1. Market Analysis, Insights and Forecast - by Component Type
- 10.1.1. Solutions
- 10.1.2. Services
- 10.2. Market Analysis, Insights and Forecast - by Type
- 10.2.1. Farm Analytics
- 10.2.2. Livestock Analytics
- 10.3. Market Analysis, Insights and Forecast - by Deployment Type
- 10.3.1. On-Premise
- 10.3.2. Cloud
- 10.4. Market Analysis, Insights and Forecast - by Farm Size
- 10.4.1. Small and Medium Farms
- 10.4.2. Large Farms
- 10.1. Market Analysis, Insights and Forecast - by Component Type
- 11. North America AG Analytics Market Analysis, Insights and Forecast, 2019-2031
- 11.1. Market Analysis, Insights and Forecast - By Country/Sub-region
- 11.1.1.
- 12. Europe AG Analytics Market Analysis, Insights and Forecast, 2019-2031
- 12.1. Market Analysis, Insights and Forecast - By Country/Sub-region
- 12.1.1.
- 13. Asia Pacific AG Analytics Market Analysis, Insights and Forecast, 2019-2031
- 13.1. Market Analysis, Insights and Forecast - By Country/Sub-region
- 13.1.1.
- 14. Latin America AG Analytics Market Analysis, Insights and Forecast, 2019-2031
- 14.1. Market Analysis, Insights and Forecast - By Country/Sub-region
- 14.1.1.
- 15. Middle East and Africa AG Analytics Market Analysis, Insights and Forecast, 2019-2031
- 15.1. Market Analysis, Insights and Forecast - By Country/Sub-region
- 15.1.1.
- 16. Competitive Analysis
- 16.1. Global Market Share Analysis 2024
- 16.2. Company Profiles
- 16.2.1 SAS Institute Inc *List Not Exhaustive
- 16.2.1.1. Overview
- 16.2.1.2. Products
- 16.2.1.3. SWOT Analysis
- 16.2.1.4. Recent Developments
- 16.2.1.5. Financials (Based on Availability)
- 16.2.2 Ageagle Aerial Systems Inc
- 16.2.2.1. Overview
- 16.2.2.2. Products
- 16.2.2.3. SWOT Analysis
- 16.2.2.4. Recent Developments
- 16.2.2.5. Financials (Based on Availability)
- 16.2.3 Deere & Company
- 16.2.3.1. Overview
- 16.2.3.2. Products
- 16.2.3.3. SWOT Analysis
- 16.2.3.4. Recent Developments
- 16.2.3.5. Financials (Based on Availability)
- 16.2.4 Bayer AG
- 16.2.4.1. Overview
- 16.2.4.2. Products
- 16.2.4.3. SWOT Analysis
- 16.2.4.4. Recent Developments
- 16.2.4.5. Financials (Based on Availability)
- 16.2.5 IBM Corporation
- 16.2.5.1. Overview
- 16.2.5.2. Products
- 16.2.5.3. SWOT Analysis
- 16.2.5.4. Recent Developments
- 16.2.5.5. Financials (Based on Availability)
- 16.2.6 Conservis Corporation
- 16.2.6.1. Overview
- 16.2.6.2. Products
- 16.2.6.3. SWOT Analysis
- 16.2.6.4. Recent Developments
- 16.2.6.5. Financials (Based on Availability)
- 16.2.7 PrecisionHawk Inc
- 16.2.7.1. Overview
- 16.2.7.2. Products
- 16.2.7.3. SWOT Analysis
- 16.2.7.4. Recent Developments
- 16.2.7.5. Financials (Based on Availability)
- 16.2.8 Trimble Inc
- 16.2.8.1. Overview
- 16.2.8.2. Products
- 16.2.8.3. SWOT Analysis
- 16.2.8.4. Recent Developments
- 16.2.8.5. Financials (Based on Availability)
- 16.2.9 Vistex Inc
- 16.2.9.1. Overview
- 16.2.9.2. Products
- 16.2.9.3. SWOT Analysis
- 16.2.9.4. Recent Developments
- 16.2.9.5. Financials (Based on Availability)
- 16.2.10 Iteris Inc
- 16.2.10.1. Overview
- 16.2.10.2. Products
- 16.2.10.3. SWOT Analysis
- 16.2.10.4. Recent Developments
- 16.2.10.5. Financials (Based on Availability)
- 16.2.11 Agrivi
- 16.2.11.1. Overview
- 16.2.11.2. Products
- 16.2.11.3. SWOT Analysis
- 16.2.11.4. Recent Developments
- 16.2.11.5. Financials (Based on Availability)
- 16.2.1 SAS Institute Inc *List Not Exhaustive
List of Figures
- Figure 1: Global AG Analytics Market Revenue Breakdown (Million, %) by Region 2024 & 2032
- Figure 2: North America AG Analytics Market Revenue (Million), by Country 2024 & 2032
- Figure 3: North America AG Analytics Market Revenue Share (%), by Country 2024 & 2032
- Figure 4: Europe AG Analytics Market Revenue (Million), by Country 2024 & 2032
- Figure 5: Europe AG Analytics Market Revenue Share (%), by Country 2024 & 2032
- Figure 6: Asia Pacific AG Analytics Market Revenue (Million), by Country 2024 & 2032
- Figure 7: Asia Pacific AG Analytics Market Revenue Share (%), by Country 2024 & 2032
- Figure 8: Latin America AG Analytics Market Revenue (Million), by Country 2024 & 2032
- Figure 9: Latin America AG Analytics Market Revenue Share (%), by Country 2024 & 2032
- Figure 10: Middle East and Africa AG Analytics Market Revenue (Million), by Country 2024 & 2032
- Figure 11: Middle East and Africa AG Analytics Market Revenue Share (%), by Country 2024 & 2032
- Figure 12: North America AG Analytics Market Revenue (Million), by Component Type 2024 & 2032
- Figure 13: North America AG Analytics Market Revenue Share (%), by Component Type 2024 & 2032
- Figure 14: North America AG Analytics Market Revenue (Million), by Type 2024 & 2032
- Figure 15: North America AG Analytics Market Revenue Share (%), by Type 2024 & 2032
- Figure 16: North America AG Analytics Market Revenue (Million), by Deployment Type 2024 & 2032
- Figure 17: North America AG Analytics Market Revenue Share (%), by Deployment Type 2024 & 2032
- Figure 18: North America AG Analytics Market Revenue (Million), by Farm Size 2024 & 2032
- Figure 19: North America AG Analytics Market Revenue Share (%), by Farm Size 2024 & 2032
- Figure 20: North America AG Analytics Market Revenue (Million), by Country 2024 & 2032
- Figure 21: North America AG Analytics Market Revenue Share (%), by Country 2024 & 2032
- Figure 22: Europe AG Analytics Market Revenue (Million), by Component Type 2024 & 2032
- Figure 23: Europe AG Analytics Market Revenue Share (%), by Component Type 2024 & 2032
- Figure 24: Europe AG Analytics Market Revenue (Million), by Type 2024 & 2032
- Figure 25: Europe AG Analytics Market Revenue Share (%), by Type 2024 & 2032
- Figure 26: Europe AG Analytics Market Revenue (Million), by Deployment Type 2024 & 2032
- Figure 27: Europe AG Analytics Market Revenue Share (%), by Deployment Type 2024 & 2032
- Figure 28: Europe AG Analytics Market Revenue (Million), by Farm Size 2024 & 2032
- Figure 29: Europe AG Analytics Market Revenue Share (%), by Farm Size 2024 & 2032
- Figure 30: Europe AG Analytics Market Revenue (Million), by Country 2024 & 2032
- Figure 31: Europe AG Analytics Market Revenue Share (%), by Country 2024 & 2032
- Figure 32: Asia Pacific AG Analytics Market Revenue (Million), by Component Type 2024 & 2032
- Figure 33: Asia Pacific AG Analytics Market Revenue Share (%), by Component Type 2024 & 2032
- Figure 34: Asia Pacific AG Analytics Market Revenue (Million), by Type 2024 & 2032
- Figure 35: Asia Pacific AG Analytics Market Revenue Share (%), by Type 2024 & 2032
- Figure 36: Asia Pacific AG Analytics Market Revenue (Million), by Deployment Type 2024 & 2032
- Figure 37: Asia Pacific AG Analytics Market Revenue Share (%), by Deployment Type 2024 & 2032
- Figure 38: Asia Pacific AG Analytics Market Revenue (Million), by Farm Size 2024 & 2032
- Figure 39: Asia Pacific AG Analytics Market Revenue Share (%), by Farm Size 2024 & 2032
- Figure 40: Asia Pacific AG Analytics Market Revenue (Million), by Country 2024 & 2032
- Figure 41: Asia Pacific AG Analytics Market Revenue Share (%), by Country 2024 & 2032
- Figure 42: Latin America AG Analytics Market Revenue (Million), by Component Type 2024 & 2032
- Figure 43: Latin America AG Analytics Market Revenue Share (%), by Component Type 2024 & 2032
- Figure 44: Latin America AG Analytics Market Revenue (Million), by Type 2024 & 2032
- Figure 45: Latin America AG Analytics Market Revenue Share (%), by Type 2024 & 2032
- Figure 46: Latin America AG Analytics Market Revenue (Million), by Deployment Type 2024 & 2032
- Figure 47: Latin America AG Analytics Market Revenue Share (%), by Deployment Type 2024 & 2032
- Figure 48: Latin America AG Analytics Market Revenue (Million), by Farm Size 2024 & 2032
- Figure 49: Latin America AG Analytics Market Revenue Share (%), by Farm Size 2024 & 2032
- Figure 50: Latin America AG Analytics Market Revenue (Million), by Country 2024 & 2032
- Figure 51: Latin America AG Analytics Market Revenue Share (%), by Country 2024 & 2032
- Figure 52: Middle East and Africa AG Analytics Market Revenue (Million), by Component Type 2024 & 2032
- Figure 53: Middle East and Africa AG Analytics Market Revenue Share (%), by Component Type 2024 & 2032
- Figure 54: Middle East and Africa AG Analytics Market Revenue (Million), by Type 2024 & 2032
- Figure 55: Middle East and Africa AG Analytics Market Revenue Share (%), by Type 2024 & 2032
- Figure 56: Middle East and Africa AG Analytics Market Revenue (Million), by Deployment Type 2024 & 2032
- Figure 57: Middle East and Africa AG Analytics Market Revenue Share (%), by Deployment Type 2024 & 2032
- Figure 58: Middle East and Africa AG Analytics Market Revenue (Million), by Farm Size 2024 & 2032
- Figure 59: Middle East and Africa AG Analytics Market Revenue Share (%), by Farm Size 2024 & 2032
- Figure 60: Middle East and Africa AG Analytics Market Revenue (Million), by Country 2024 & 2032
- Figure 61: Middle East and Africa AG Analytics Market Revenue Share (%), by Country 2024 & 2032
List of Tables
- Table 1: Global AG Analytics Market Revenue Million Forecast, by Region 2019 & 2032
- Table 2: Global AG Analytics Market Revenue Million Forecast, by Component Type 2019 & 2032
- Table 3: Global AG Analytics Market Revenue Million Forecast, by Type 2019 & 2032
- Table 4: Global AG Analytics Market Revenue Million Forecast, by Deployment Type 2019 & 2032
- Table 5: Global AG Analytics Market Revenue Million Forecast, by Farm Size 2019 & 2032
- Table 6: Global AG Analytics Market Revenue Million Forecast, by Region 2019 & 2032
- Table 7: Global AG Analytics Market Revenue Million Forecast, by Country 2019 & 2032
- Table 8: AG Analytics Market Revenue (Million) Forecast, by Application 2019 & 2032
- Table 9: Global AG Analytics Market Revenue Million Forecast, by Country 2019 & 2032
- Table 10: AG Analytics Market Revenue (Million) Forecast, by Application 2019 & 2032
- Table 11: Global AG Analytics Market Revenue Million Forecast, by Country 2019 & 2032
- Table 12: AG Analytics Market Revenue (Million) Forecast, by Application 2019 & 2032
- Table 13: Global AG Analytics Market Revenue Million Forecast, by Country 2019 & 2032
- Table 14: AG Analytics Market Revenue (Million) Forecast, by Application 2019 & 2032
- Table 15: Global AG Analytics Market Revenue Million Forecast, by Country 2019 & 2032
- Table 16: AG Analytics Market Revenue (Million) Forecast, by Application 2019 & 2032
- Table 17: Global AG Analytics Market Revenue Million Forecast, by Component Type 2019 & 2032
- Table 18: Global AG Analytics Market Revenue Million Forecast, by Type 2019 & 2032
- Table 19: Global AG Analytics Market Revenue Million Forecast, by Deployment Type 2019 & 2032
- Table 20: Global AG Analytics Market Revenue Million Forecast, by Farm Size 2019 & 2032
- Table 21: Global AG Analytics Market Revenue Million Forecast, by Country 2019 & 2032
- Table 22: Global AG Analytics Market Revenue Million Forecast, by Component Type 2019 & 2032
- Table 23: Global AG Analytics Market Revenue Million Forecast, by Type 2019 & 2032
- Table 24: Global AG Analytics Market Revenue Million Forecast, by Deployment Type 2019 & 2032
- Table 25: Global AG Analytics Market Revenue Million Forecast, by Farm Size 2019 & 2032
- Table 26: Global AG Analytics Market Revenue Million Forecast, by Country 2019 & 2032
- Table 27: Global AG Analytics Market Revenue Million Forecast, by Component Type 2019 & 2032
- Table 28: Global AG Analytics Market Revenue Million Forecast, by Type 2019 & 2032
- Table 29: Global AG Analytics Market Revenue Million Forecast, by Deployment Type 2019 & 2032
- Table 30: Global AG Analytics Market Revenue Million Forecast, by Farm Size 2019 & 2032
- Table 31: Global AG Analytics Market Revenue Million Forecast, by Country 2019 & 2032
- Table 32: Global AG Analytics Market Revenue Million Forecast, by Component Type 2019 & 2032
- Table 33: Global AG Analytics Market Revenue Million Forecast, by Type 2019 & 2032
- Table 34: Global AG Analytics Market Revenue Million Forecast, by Deployment Type 2019 & 2032
- Table 35: Global AG Analytics Market Revenue Million Forecast, by Farm Size 2019 & 2032
- Table 36: Global AG Analytics Market Revenue Million Forecast, by Country 2019 & 2032
- Table 37: Global AG Analytics Market Revenue Million Forecast, by Component Type 2019 & 2032
- Table 38: Global AG Analytics Market Revenue Million Forecast, by Type 2019 & 2032
- Table 39: Global AG Analytics Market Revenue Million Forecast, by Deployment Type 2019 & 2032
- Table 40: Global AG Analytics Market Revenue Million Forecast, by Farm Size 2019 & 2032
- Table 41: Global AG Analytics Market Revenue Million Forecast, by Country 2019 & 2032
Frequently Asked Questions
1. What is the projected Compound Annual Growth Rate (CAGR) of the AG Analytics Market?
The projected CAGR is approximately 14.40%.
2. Which companies are prominent players in the AG Analytics Market?
Key companies in the market include SAS Institute Inc *List Not Exhaustive, Ageagle Aerial Systems Inc, Deere & Company, Bayer AG, IBM Corporation, Conservis Corporation, PrecisionHawk Inc, Trimble Inc, Vistex Inc, Iteris Inc, Agrivi.
3. What are the main segments of the AG Analytics Market?
The market segments include Component Type, Type, Deployment Type, Farm Size.
4. Can you provide details about the market size?
The market size is estimated to be USD XX Million as of 2022.
5. What are some drivers contributing to market growth?
; Rising Usage of Cutting-edge Technology-based Solutions for Farming.
6. What are the notable trends driving market growth?
Farm Analytics is Expected to Grow at a Significant Rate Over the Forecast Period.
7. Are there any restraints impacting market growth?
; High Capital Cost and Complexity Regarding System Upgrades.
8. Can you provide examples of recent developments in the market?
N/A
9. What pricing options are available for accessing the report?
Pricing options include single-user, multi-user, and enterprise licenses priced at USD 4750, USD 5250, and USD 8750 respectively.
10. Is the market size provided in terms of value or volume?
The market size is provided in terms of value, measured in Million.
11. Are there any specific market keywords associated with the report?
Yes, the market keyword associated with the report is "AG Analytics Market," which aids in identifying and referencing the specific market segment covered.
12. How do I determine which pricing option suits my needs best?
The pricing options vary based on user requirements and access needs. Individual users may opt for single-user licenses, while businesses requiring broader access may choose multi-user or enterprise licenses for cost-effective access to the report.
13. Are there any additional resources or data provided in the AG Analytics Market report?
While the report offers comprehensive insights, it's advisable to review the specific contents or supplementary materials provided to ascertain if additional resources or data are available.
14. How can I stay updated on further developments or reports in the AG Analytics Market?
To stay informed about further developments, trends, and reports in the AG Analytics Market, consider subscribing to industry newsletters, following relevant companies and organizations, or regularly checking reputable industry news sources and publications.
Methodology
Step 1 - Identification of Relevant Samples Size from Population Database


Step 2 - Approaches for Defining Global Market Size (Value, Volume* & Price*)

Note*: In applicable scenarios
Step 3 - Data Sources
Primary Research
- Web Analytics
- Survey Reports
- Research Institute
- Latest Research Reports
- Opinion Leaders
Secondary Research
- Annual Reports
- White Paper
- Latest Press Release
- Industry Association
- Paid Database
- Investor Presentations

Step 4 - Data Triangulation
Involves using different sources of information in order to increase the validity of a study
These sources are likely to be stakeholders in a program - participants, other researchers, program staff, other community members, and so on.
Then we put all data in single framework & apply various statistical tools to find out the dynamic on the market.
During the analysis stage, feedback from the stakeholder groups would be compared to determine areas of agreement as well as areas of divergence
