

Key Insights
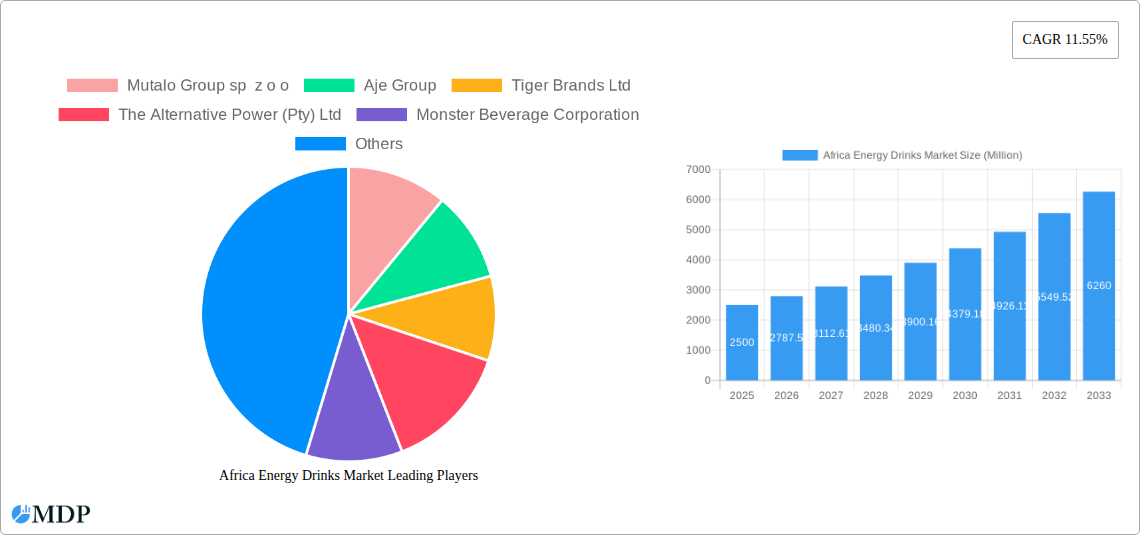
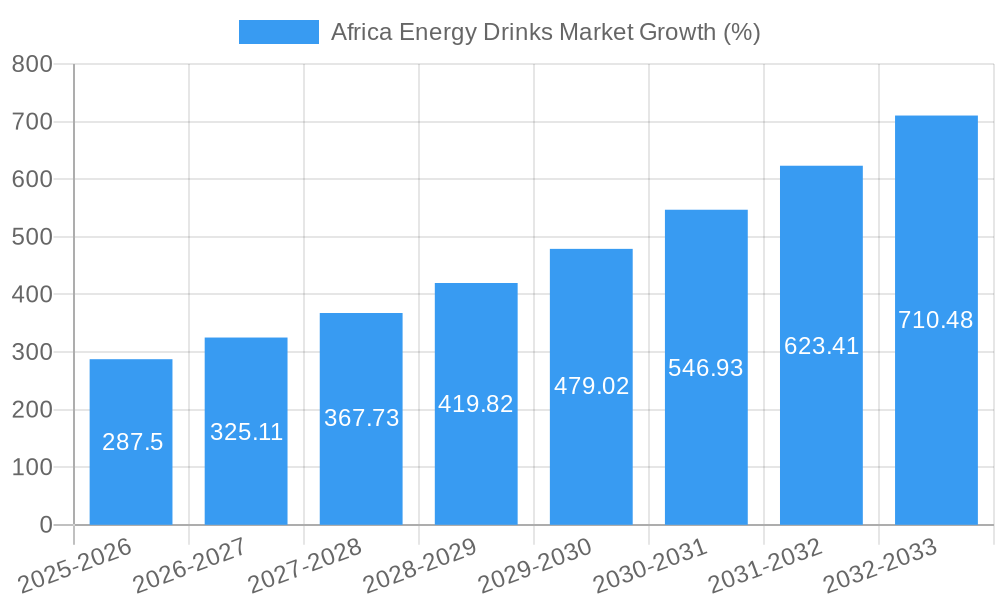
The African energy drinks market, valued at approximately $XX million in 2025, is poised for robust growth, exhibiting a Compound Annual Growth Rate (CAGR) of 11.55% from 2025 to 2033. This expansion is driven by several key factors. Rising disposable incomes, particularly among young adults in rapidly urbanizing regions like South Africa, Nigeria, and Egypt, are fueling demand for convenient and stimulating beverages. A burgeoning youth population, coupled with increasing exposure to Western lifestyles and consumption patterns, further contributes to market growth. The proliferation of health and wellness trends is also evident, with increasing demand for sugar-free and low-calorie options alongside the continued popularity of traditional energy drinks. Successful marketing campaigns highlighting energy boosts and enhanced performance are contributing to market penetration. However, challenges exist, including fluctuating raw material prices and concerns regarding the long-term health effects of excessive energy drink consumption, which may act as restraints on market growth. The market is segmented by packaging type (glass bottles, metal cans, PET bottles), distribution channel (off-trade, on-trade), and soft drink type (energy shots, natural/organic, sugar-free/low-calorie, traditional, others). Competition is fierce, with both international giants like Coca-Cola and Red Bull vying for market share alongside established regional players like Aje Group and Mutalo Group. South Africa holds the largest market share within Africa, followed by Nigeria and Egypt, reflecting the higher economic activity and consumption patterns in these key markets. Future growth will likely be influenced by the success of tailored marketing strategies to different consumer segments across the diverse African landscape, and innovative product development to meet evolving consumer preferences.
The competitive landscape is characterized by a blend of multinational corporations and local players. International brands leverage their established brand recognition and extensive distribution networks to maintain a strong presence. However, local companies are successfully capitalizing on regional preferences and adapting their offerings to specific market needs. This dynamic competition fosters innovation and product diversification, ensuring the availability of diverse options to meet the evolving tastes of the African consumer. The market's trajectory is strongly linked to economic growth, urbanization, and changing lifestyle preferences within the African continent. Continued economic expansion, alongside increased access to information and global trends, is projected to further fuel market expansion in the years to come. This growth, however, will depend on navigating challenges such as addressing health concerns, ensuring sustainable sourcing of raw materials, and adapting product strategies to cater to the diverse cultural and economic contexts across different African nations.
Africa Energy Drinks Market: A Comprehensive Report (2019-2033)
This comprehensive report provides an in-depth analysis of the burgeoning Africa energy drinks market, offering invaluable insights for industry stakeholders, investors, and strategic decision-makers. With a study period spanning 2019-2033, a base year of 2025, and a forecast period of 2025-2033, this report illuminates market dynamics, trends, and opportunities across key segments and countries. The report covers a market projected to reach xx Million by 2033.
Africa Energy Drinks Market Market Dynamics & Concentration
This section analyzes the competitive landscape, innovation drivers, and regulatory influences shaping the African energy drinks market. The market exhibits a moderately concentrated structure, with key players holding significant market share. However, the entry of smaller, agile brands and increased consumer demand for diverse product offerings is fostering competition.
- Market Concentration: The top five players account for approximately xx% of the market share in 2025, indicating a moderately concentrated market. This is expected to slightly decrease to xx% by 2033 due to increased competition.
- Innovation Drivers: Health-conscious trends are driving innovation in low-sugar and natural energy drink formulations. Technological advancements in packaging and distribution further fuel market growth.
- Regulatory Frameworks: Varying regulatory landscapes across African nations influence product formulations and marketing strategies. Stringent regulations on sugar content and labeling are impacting product development.
- Product Substitutes: Other beverages, including sports drinks and functional beverages, pose competitive pressure, leading to increased diversification and product innovation within the energy drink sector.
- End-User Trends: Rising disposable incomes, changing lifestyles, and a growing youth population are key drivers of market expansion. Demand for convenient, on-the-go energy solutions fuels market growth.
- M&A Activities: The number of mergers and acquisitions in the sector has averaged xx deals annually during the historical period (2019-2024), with a projected increase to xx deals annually during the forecast period (2025-2033).
Africa Energy Drinks Market Industry Trends & Analysis
The Africa energy drinks market is experiencing robust growth, propelled by several key factors. The Compound Annual Growth Rate (CAGR) is estimated at xx% during the forecast period (2025-2033). Market penetration remains relatively low compared to other regions, signifying substantial untapped potential. Consumer preferences are shifting towards healthier options, driving innovation in sugar-free and natural energy drinks. Technological advancements in production, packaging, and distribution contribute to efficiency gains and improved product availability. The competitive landscape is dynamic, with both established multinational corporations and local brands vying for market share. Increased online retail channels are increasing convenience and reach for consumers.
Leading Markets & Segments in Africa Energy Drinks Market
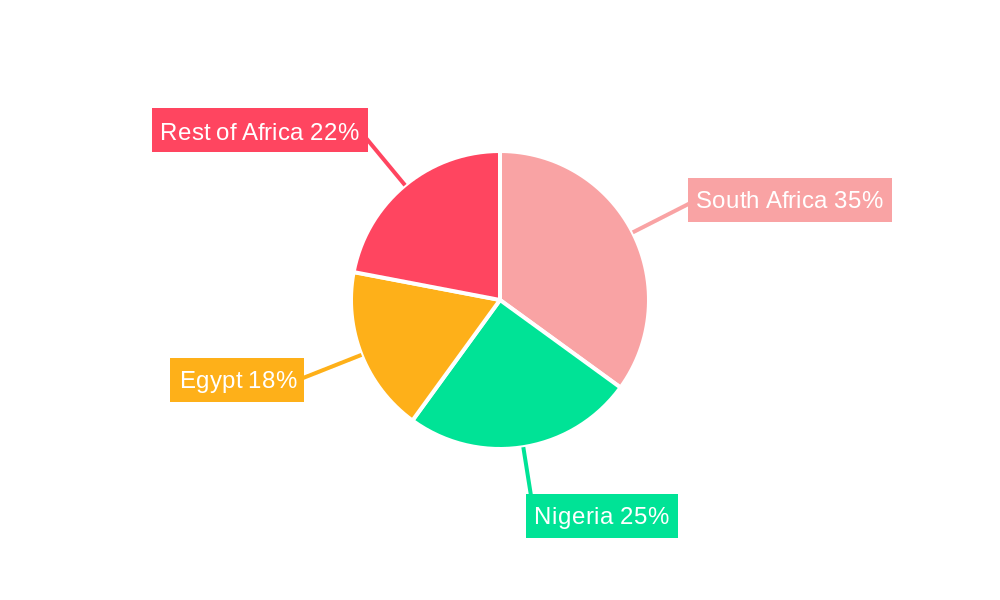
Nigeria and South Africa currently dominate the African energy drinks market, driven by their large populations, higher disposable incomes, and developed infrastructure. However, Egypt and the Rest of Africa show promising growth potential.
Leading Countries:
- Nigeria: High population density and increasing urbanization drive significant demand.
- South Africa: Established infrastructure, strong retail networks, and high consumer spending contribute to market leadership.
- Egypt: Rapid economic growth and increasing consumer awareness of energy drinks are fueling market expansion.
- Rest of Africa: This region presents substantial untapped potential with growing economies and increasing urbanization driving future growth.
Leading Segments:
- Packaging Type: PET bottles dominate due to affordability and convenience.
- Distribution Channel: Off-trade channels (retail stores, supermarkets) hold the largest market share, but on-trade channels (restaurants, cafes) are showing promising growth.
- Soft Drink Type: Traditional energy drinks currently hold the largest market share, although sugar-free/low-calorie and natural/organic options are experiencing the fastest growth rates.
Key Drivers:
- Economic Growth: Rising disposable incomes across several African nations fuel consumer spending on discretionary products, including energy drinks.
- Urbanization: Increasing urbanization leads to higher exposure to Western lifestyle trends, boosting demand for energy drinks.
- Improved Infrastructure: Better transportation and distribution networks enable wider product reach.
Africa Energy Drinks Market Product Developments
Recent product innovations include the introduction of low-sugar and natural energy drinks to cater to health-conscious consumers. Functional energy drinks with added vitamins and minerals are also gaining traction. Companies are leveraging sustainable packaging options and efficient distribution strategies to enhance competitiveness. Technological advancements in flavor creation and formulation improve product appeal.
Key Drivers of Africa Energy Drinks Market Growth
The African energy drinks market is driven by several factors. The rising youth population and the increasing urbanization in many African countries have led to a significant increase in demand for energy drinks. Furthermore, rising disposable incomes are enabling consumers to purchase more discretionary products, further boosting the market. Finally, growing health consciousness is pushing innovation within the market, with the introduction of new healthier options.
Challenges in the Africa Energy Drinks Market Market
Challenges include inconsistent regulatory environments across different African nations, supply chain complexities, and intense competition. The high cost of imported ingredients also impacts profitability. Fluctuations in currency exchange rates can affect pricing and profitability. Competition from established beverage giants presents a continuous challenge for smaller players.
Emerging Opportunities in Africa Energy Drinks Market
The market presents opportunities for expansion into less-penetrated regions, particularly in sub-Saharan Africa. Strategic partnerships with local distributors can improve market access. The development of innovative products tailored to local tastes and preferences will further drive growth. Investment in sustainable packaging and eco-friendly production processes caters to environmentally conscious consumers.
Leading Players in the Africa Energy Drinks Market Sector
- Mutalo Group sp z o o
- Aje Group
- Tiger Brands Ltd
- The Alternative Power (Pty) Ltd
- Monster Beverage Corporation
- PepsiCo Inc
- Mofaya Beverage Company (PTY) Ltd
- S Spitz GmbH
- Suntory Holdings Limited
- Red Bull GmbH
- Halewood International South Africa (Pty) Ltd
- The Coca-Cola Company
Key Milestones in Africa Energy Drinks Market Industry
- September 2023: Switch Energy Drink launched a limited-edition flavor celebrating South African Heritage Day.
- October 2023: Switch Energy Drink introduced three new limited-edition flavors (Sour Worms, Naartjie & Grape, and Kiwi, Mango & Strawberry) across the African region.
- October 2023: Miss South Africa Natasha Joubert launched a Berry Queen-flavored energy drink under the MoFaya brand.
Strategic Outlook for Africa Energy Drinks Market Market
The Africa energy drinks market exhibits significant long-term growth potential. Strategic investments in product innovation, targeted marketing campaigns, and expansion into underserved markets will be crucial for success. Companies that effectively adapt to evolving consumer preferences and leverage technological advancements will secure a competitive edge. Focusing on sustainability and ethical sourcing will also resonate with the growing number of environmentally and socially conscious consumers.
Africa Energy Drinks Market Segmentation
-
1. Soft Drink Type
- 1.1. Energy Shots
- 1.2. Natural/Organic Energy Drinks
- 1.3. Sugar-free or Low-calories Energy Drinks
- 1.4. Traditional Energy Drinks
- 1.5. Other Energy Drinks
-
2. Packaging Type
- 2.1. Glass Bottles
- 2.2. Metal Can
- 2.3. PET Bottles
-
3. Distribution Channel
-
3.1. Off-trade
- 3.1.1. Convenience Stores
- 3.1.2. Online Retail
- 3.1.3. Supermarket/Hypermarket
- 3.1.4. Others
- 3.2. On-trade
-
3.1. Off-trade
Africa Energy Drinks Market Segmentation By Geography
-
1. Africa
- 1.1. Nigeria
- 1.2. South Africa
- 1.3. Egypt
- 1.4. Kenya
- 1.5. Ethiopia
- 1.6. Morocco
- 1.7. Ghana
- 1.8. Algeria
- 1.9. Tanzania
- 1.10. Ivory Coast
Africa Energy Drinks Market REPORT HIGHLIGHTS
| Aspects | Details |
|---|---|
| Study Period | 2019-2033 |
| Base Year | 2024 |
| Estimated Year | 2025 |
| Forecast Period | 2025-2033 |
| Historical Period | 2019-2024 |
| Growth Rate | CAGR of 11.55% from 2019-2033 |
| Segmentation |
|
Table of Contents
- 1. Introduction
- 1.1. Research Scope
- 1.2. Market Segmentation
- 1.3. Research Methodology
- 1.4. Definitions and Assumptions
- 2. Executive Summary
- 2.1. Introduction
- 3. Market Dynamics
- 3.1. Introduction
- 3.2. Market Drivers
- 3.2.1. Increasing Demand for Protein-Rich Food; Increasing Demand for Plant-Based and Organic Ingredients
- 3.3. Market Restrains
- 3.3.1. Presence of Counterfeit Products
- 3.4. Market Trends
- 3.4.1. OTHER KEY INDUSTRY TRENDS COVERED IN THE REPORT
- 4. Market Factor Analysis
- 4.1. Porters Five Forces
- 4.2. Supply/Value Chain
- 4.3. PESTEL analysis
- 4.4. Market Entropy
- 4.5. Patent/Trademark Analysis
- 5. Africa Energy Drinks Market Analysis, Insights and Forecast, 2019-2031
- 5.1. Market Analysis, Insights and Forecast - by Soft Drink Type
- 5.1.1. Energy Shots
- 5.1.2. Natural/Organic Energy Drinks
- 5.1.3. Sugar-free or Low-calories Energy Drinks
- 5.1.4. Traditional Energy Drinks
- 5.1.5. Other Energy Drinks
- 5.2. Market Analysis, Insights and Forecast - by Packaging Type
- 5.2.1. Glass Bottles
- 5.2.2. Metal Can
- 5.2.3. PET Bottles
- 5.3. Market Analysis, Insights and Forecast - by Distribution Channel
- 5.3.1. Off-trade
- 5.3.1.1. Convenience Stores
- 5.3.1.2. Online Retail
- 5.3.1.3. Supermarket/Hypermarket
- 5.3.1.4. Others
- 5.3.2. On-trade
- 5.3.1. Off-trade
- 5.4. Market Analysis, Insights and Forecast - by Region
- 5.4.1. Africa
- 5.1. Market Analysis, Insights and Forecast - by Soft Drink Type
- 6. South Africa Africa Energy Drinks Market Analysis, Insights and Forecast, 2019-2031
- 7. Sudan Africa Energy Drinks Market Analysis, Insights and Forecast, 2019-2031
- 8. Uganda Africa Energy Drinks Market Analysis, Insights and Forecast, 2019-2031
- 9. Tanzania Africa Energy Drinks Market Analysis, Insights and Forecast, 2019-2031
- 10. Kenya Africa Energy Drinks Market Analysis, Insights and Forecast, 2019-2031
- 11. Rest of Africa Africa Energy Drinks Market Analysis, Insights and Forecast, 2019-2031
- 12. Competitive Analysis
- 12.1. Market Share Analysis 2024
- 12.2. Company Profiles
- 12.2.1 Mutalo Group sp z o o
- 12.2.1.1. Overview
- 12.2.1.2. Products
- 12.2.1.3. SWOT Analysis
- 12.2.1.4. Recent Developments
- 12.2.1.5. Financials (Based on Availability)
- 12.2.2 Aje Group
- 12.2.2.1. Overview
- 12.2.2.2. Products
- 12.2.2.3. SWOT Analysis
- 12.2.2.4. Recent Developments
- 12.2.2.5. Financials (Based on Availability)
- 12.2.3 Tiger Brands Ltd
- 12.2.3.1. Overview
- 12.2.3.2. Products
- 12.2.3.3. SWOT Analysis
- 12.2.3.4. Recent Developments
- 12.2.3.5. Financials (Based on Availability)
- 12.2.4 The Alternative Power (Pty) Ltd
- 12.2.4.1. Overview
- 12.2.4.2. Products
- 12.2.4.3. SWOT Analysis
- 12.2.4.4. Recent Developments
- 12.2.4.5. Financials (Based on Availability)
- 12.2.5 Monster Beverage Corporation
- 12.2.5.1. Overview
- 12.2.5.2. Products
- 12.2.5.3. SWOT Analysis
- 12.2.5.4. Recent Developments
- 12.2.5.5. Financials (Based on Availability)
- 12.2.6 PepsiCo Inc
- 12.2.6.1. Overview
- 12.2.6.2. Products
- 12.2.6.3. SWOT Analysis
- 12.2.6.4. Recent Developments
- 12.2.6.5. Financials (Based on Availability)
- 12.2.7 Mofaya Beverage Company (PTY) Ltd
- 12.2.7.1. Overview
- 12.2.7.2. Products
- 12.2.7.3. SWOT Analysis
- 12.2.7.4. Recent Developments
- 12.2.7.5. Financials (Based on Availability)
- 12.2.8 S Spitz GmbH
- 12.2.8.1. Overview
- 12.2.8.2. Products
- 12.2.8.3. SWOT Analysis
- 12.2.8.4. Recent Developments
- 12.2.8.5. Financials (Based on Availability)
- 12.2.9 Suntory Holdings Limited
- 12.2.9.1. Overview
- 12.2.9.2. Products
- 12.2.9.3. SWOT Analysis
- 12.2.9.4. Recent Developments
- 12.2.9.5. Financials (Based on Availability)
- 12.2.10 Red Bull GmbH
- 12.2.10.1. Overview
- 12.2.10.2. Products
- 12.2.10.3. SWOT Analysis
- 12.2.10.4. Recent Developments
- 12.2.10.5. Financials (Based on Availability)
- 12.2.11 Halewood International South Africa (Pty) Ltd
- 12.2.11.1. Overview
- 12.2.11.2. Products
- 12.2.11.3. SWOT Analysis
- 12.2.11.4. Recent Developments
- 12.2.11.5. Financials (Based on Availability)
- 12.2.12 The Coca-Cola Company
- 12.2.12.1. Overview
- 12.2.12.2. Products
- 12.2.12.3. SWOT Analysis
- 12.2.12.4. Recent Developments
- 12.2.12.5. Financials (Based on Availability)
- 12.2.1 Mutalo Group sp z o o
List of Figures
- Figure 1: Africa Energy Drinks Market Revenue Breakdown (Million, %) by Product 2024 & 2032
- Figure 2: Africa Energy Drinks Market Share (%) by Company 2024
List of Tables
- Table 1: Africa Energy Drinks Market Revenue Million Forecast, by Region 2019 & 2032
- Table 2: Africa Energy Drinks Market Volume K Tons Forecast, by Region 2019 & 2032
- Table 3: Africa Energy Drinks Market Revenue Million Forecast, by Soft Drink Type 2019 & 2032
- Table 4: Africa Energy Drinks Market Volume K Tons Forecast, by Soft Drink Type 2019 & 2032
- Table 5: Africa Energy Drinks Market Revenue Million Forecast, by Packaging Type 2019 & 2032
- Table 6: Africa Energy Drinks Market Volume K Tons Forecast, by Packaging Type 2019 & 2032
- Table 7: Africa Energy Drinks Market Revenue Million Forecast, by Distribution Channel 2019 & 2032
- Table 8: Africa Energy Drinks Market Volume K Tons Forecast, by Distribution Channel 2019 & 2032
- Table 9: Africa Energy Drinks Market Revenue Million Forecast, by Region 2019 & 2032
- Table 10: Africa Energy Drinks Market Volume K Tons Forecast, by Region 2019 & 2032
- Table 11: Africa Energy Drinks Market Revenue Million Forecast, by Country 2019 & 2032
- Table 12: Africa Energy Drinks Market Volume K Tons Forecast, by Country 2019 & 2032
- Table 13: South Africa Africa Energy Drinks Market Revenue (Million) Forecast, by Application 2019 & 2032
- Table 14: South Africa Africa Energy Drinks Market Volume (K Tons) Forecast, by Application 2019 & 2032
- Table 15: Sudan Africa Energy Drinks Market Revenue (Million) Forecast, by Application 2019 & 2032
- Table 16: Sudan Africa Energy Drinks Market Volume (K Tons) Forecast, by Application 2019 & 2032
- Table 17: Uganda Africa Energy Drinks Market Revenue (Million) Forecast, by Application 2019 & 2032
- Table 18: Uganda Africa Energy Drinks Market Volume (K Tons) Forecast, by Application 2019 & 2032
- Table 19: Tanzania Africa Energy Drinks Market Revenue (Million) Forecast, by Application 2019 & 2032
- Table 20: Tanzania Africa Energy Drinks Market Volume (K Tons) Forecast, by Application 2019 & 2032
- Table 21: Kenya Africa Energy Drinks Market Revenue (Million) Forecast, by Application 2019 & 2032
- Table 22: Kenya Africa Energy Drinks Market Volume (K Tons) Forecast, by Application 2019 & 2032
- Table 23: Rest of Africa Africa Energy Drinks Market Revenue (Million) Forecast, by Application 2019 & 2032
- Table 24: Rest of Africa Africa Energy Drinks Market Volume (K Tons) Forecast, by Application 2019 & 2032
- Table 25: Africa Energy Drinks Market Revenue Million Forecast, by Soft Drink Type 2019 & 2032
- Table 26: Africa Energy Drinks Market Volume K Tons Forecast, by Soft Drink Type 2019 & 2032
- Table 27: Africa Energy Drinks Market Revenue Million Forecast, by Packaging Type 2019 & 2032
- Table 28: Africa Energy Drinks Market Volume K Tons Forecast, by Packaging Type 2019 & 2032
- Table 29: Africa Energy Drinks Market Revenue Million Forecast, by Distribution Channel 2019 & 2032
- Table 30: Africa Energy Drinks Market Volume K Tons Forecast, by Distribution Channel 2019 & 2032
- Table 31: Africa Energy Drinks Market Revenue Million Forecast, by Country 2019 & 2032
- Table 32: Africa Energy Drinks Market Volume K Tons Forecast, by Country 2019 & 2032
- Table 33: Nigeria Africa Energy Drinks Market Revenue (Million) Forecast, by Application 2019 & 2032
- Table 34: Nigeria Africa Energy Drinks Market Volume (K Tons) Forecast, by Application 2019 & 2032
- Table 35: South Africa Africa Energy Drinks Market Revenue (Million) Forecast, by Application 2019 & 2032
- Table 36: South Africa Africa Energy Drinks Market Volume (K Tons) Forecast, by Application 2019 & 2032
- Table 37: Egypt Africa Energy Drinks Market Revenue (Million) Forecast, by Application 2019 & 2032
- Table 38: Egypt Africa Energy Drinks Market Volume (K Tons) Forecast, by Application 2019 & 2032
- Table 39: Kenya Africa Energy Drinks Market Revenue (Million) Forecast, by Application 2019 & 2032
- Table 40: Kenya Africa Energy Drinks Market Volume (K Tons) Forecast, by Application 2019 & 2032
- Table 41: Ethiopia Africa Energy Drinks Market Revenue (Million) Forecast, by Application 2019 & 2032
- Table 42: Ethiopia Africa Energy Drinks Market Volume (K Tons) Forecast, by Application 2019 & 2032
- Table 43: Morocco Africa Energy Drinks Market Revenue (Million) Forecast, by Application 2019 & 2032
- Table 44: Morocco Africa Energy Drinks Market Volume (K Tons) Forecast, by Application 2019 & 2032
- Table 45: Ghana Africa Energy Drinks Market Revenue (Million) Forecast, by Application 2019 & 2032
- Table 46: Ghana Africa Energy Drinks Market Volume (K Tons) Forecast, by Application 2019 & 2032
- Table 47: Algeria Africa Energy Drinks Market Revenue (Million) Forecast, by Application 2019 & 2032
- Table 48: Algeria Africa Energy Drinks Market Volume (K Tons) Forecast, by Application 2019 & 2032
- Table 49: Tanzania Africa Energy Drinks Market Revenue (Million) Forecast, by Application 2019 & 2032
- Table 50: Tanzania Africa Energy Drinks Market Volume (K Tons) Forecast, by Application 2019 & 2032
- Table 51: Ivory Coast Africa Energy Drinks Market Revenue (Million) Forecast, by Application 2019 & 2032
- Table 52: Ivory Coast Africa Energy Drinks Market Volume (K Tons) Forecast, by Application 2019 & 2032
Frequently Asked Questions
1. What is the projected Compound Annual Growth Rate (CAGR) of the Africa Energy Drinks Market?
The projected CAGR is approximately 11.55%.
2. Which companies are prominent players in the Africa Energy Drinks Market?
Key companies in the market include Mutalo Group sp z o o, Aje Group, Tiger Brands Ltd, The Alternative Power (Pty) Ltd, Monster Beverage Corporation, PepsiCo Inc, Mofaya Beverage Company (PTY) Ltd, S Spitz GmbH, Suntory Holdings Limited, Red Bull GmbH, Halewood International South Africa (Pty) Ltd, The Coca-Cola Company.
3. What are the main segments of the Africa Energy Drinks Market?
The market segments include Soft Drink Type, Packaging Type, Distribution Channel.
4. Can you provide details about the market size?
The market size is estimated to be USD XX Million as of 2022.
5. What are some drivers contributing to market growth?
Increasing Demand for Protein-Rich Food; Increasing Demand for Plant-Based and Organic Ingredients.
6. What are the notable trends driving market growth?
OTHER KEY INDUSTRY TRENDS COVERED IN THE REPORT.
7. Are there any restraints impacting market growth?
Presence of Counterfeit Products.
8. Can you provide examples of recent developments in the market?
October 2023: Miss South Africa Natasha Joubert has expanded her business venture by collaborating with the MoFaya energy drink business. Joubert has launched the Berry Queen-flavoured energy drink under the MoFaya energy drink brand.October 2023: Switch Energy Drink introduced 3 new flavors in the African region. The three new limited-edition flavors are Sour Worms, Naartjie & Grape, and Kiwi, Mango & Strawberry.September 2023: Switch Energy Drink launched a special limited-edition flavor in celebration of South African Heritage Day. As a brand deeply rooted in the South African spirit, Switch Energy Drink is excited to contribute to the festivities with this special edition.
9. What pricing options are available for accessing the report?
Pricing options include single-user, multi-user, and enterprise licenses priced at USD 3800, USD 4500, and USD 5800 respectively.
10. Is the market size provided in terms of value or volume?
The market size is provided in terms of value, measured in Million and volume, measured in K Tons.
11. Are there any specific market keywords associated with the report?
Yes, the market keyword associated with the report is "Africa Energy Drinks Market," which aids in identifying and referencing the specific market segment covered.
12. How do I determine which pricing option suits my needs best?
The pricing options vary based on user requirements and access needs. Individual users may opt for single-user licenses, while businesses requiring broader access may choose multi-user or enterprise licenses for cost-effective access to the report.
13. Are there any additional resources or data provided in the Africa Energy Drinks Market report?
While the report offers comprehensive insights, it's advisable to review the specific contents or supplementary materials provided to ascertain if additional resources or data are available.
14. How can I stay updated on further developments or reports in the Africa Energy Drinks Market?
To stay informed about further developments, trends, and reports in the Africa Energy Drinks Market, consider subscribing to industry newsletters, following relevant companies and organizations, or regularly checking reputable industry news sources and publications.
Methodology
Step 1 - Identification of Relevant Samples Size from Population Database


Step 2 - Approaches for Defining Global Market Size (Value, Volume* & Price*)

Note*: In applicable scenarios
Step 3 - Data Sources
Primary Research
- Web Analytics
- Survey Reports
- Research Institute
- Latest Research Reports
- Opinion Leaders
Secondary Research
- Annual Reports
- White Paper
- Latest Press Release
- Industry Association
- Paid Database
- Investor Presentations

Step 4 - Data Triangulation
Involves using different sources of information in order to increase the validity of a study
These sources are likely to be stakeholders in a program - participants, other researchers, program staff, other community members, and so on.
Then we put all data in single framework & apply various statistical tools to find out the dynamic on the market.
During the analysis stage, feedback from the stakeholder groups would be compared to determine areas of agreement as well as areas of divergence
