

Key Insights
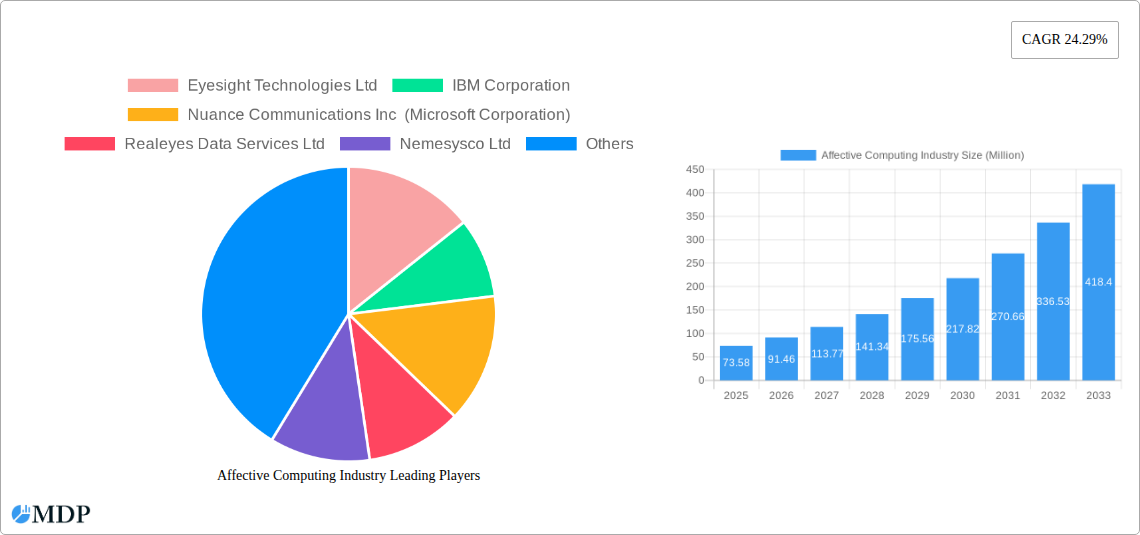
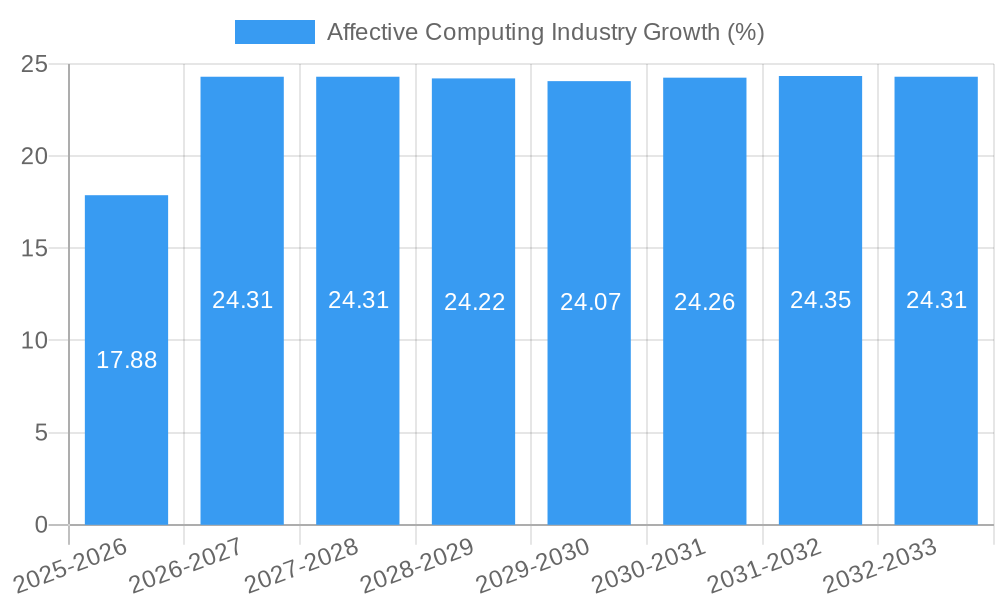
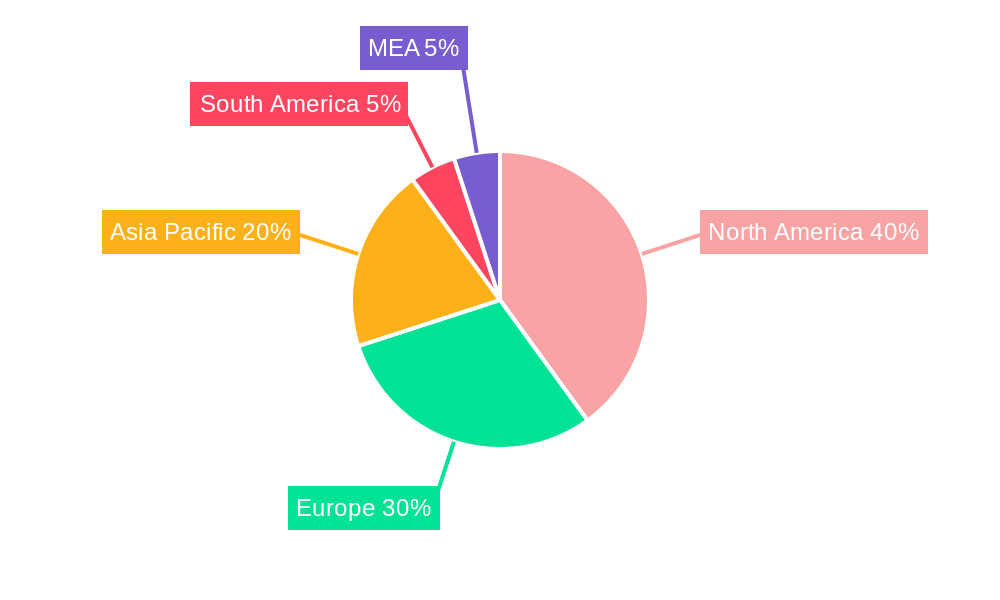
The affective computing market, valued at $73.58 million in 2025, is experiencing robust growth, projected to expand at a Compound Annual Growth Rate (CAGR) of 24.29% from 2025 to 2033. This surge is driven by several key factors. The increasing adoption of AI and machine learning across various sectors, particularly healthcare (patient monitoring, mental health assessment), automotive (driver monitoring systems, in-car personalization), and retail (customer experience enhancement, personalized marketing), fuels market expansion. Furthermore, advancements in sensor technology, enabling more accurate emotion recognition, and the growing demand for personalized and emotionally intelligent experiences are significant contributors to this growth trajectory. The market is segmented by component (hardware and software) and end-user industry, reflecting the diverse applications of affective computing. Leading companies such as IBM, Microsoft (through Nuance), and Amazon Web Services are actively investing in this space, further accelerating its development and market penetration. While data privacy and ethical concerns present potential restraints, the overall market outlook remains positive, anticipating significant growth across all major geographical regions, with North America and Asia Pacific expected to be leading markets.
The competitive landscape is dynamic, with established tech giants and specialized startups vying for market share. Companies like Eyesight Technologies and Affectiva are focusing on providing advanced emotion recognition solutions, while others, such as Emotibot Technologies and Kairos AR, are developing innovative applications in areas like virtual and augmented reality. The future of affective computing hinges on overcoming challenges related to data security, algorithm bias, and ensuring ethical implementation. However, continuous innovation in areas such as deep learning and improved sensor technology is expected to drive wider adoption and lead to the development of even more sophisticated and accurate emotional intelligence technologies across diverse industries. The substantial growth forecast suggests a promising future for this market, with continued expansion fueled by technological advancements and increasing demand for emotionally intelligent systems.
Affective Computing Industry Report: 2019-2033 Forecast
This comprehensive report provides an in-depth analysis of the Affective Computing industry, projecting a market valuation exceeding $XX Million by 2033. Leveraging data from 2019-2024 (Historical Period), with 2025 as the Base and Estimated Year, this report forecasts market trends through 2033 (Forecast Period). Gain actionable insights into market dynamics, leading players, technological advancements, and future opportunities within this rapidly expanding sector. Maximize your strategic advantage with this essential resource.
Affective Computing Industry Market Dynamics & Concentration
The Affective Computing market is experiencing robust growth, driven by increasing demand across healthcare, automotive, and retail sectors. Market concentration is moderate, with several key players holding significant shares, but a considerable number of smaller, specialized companies also contributing. Innovation is a key driver, with ongoing advancements in AI, machine learning, and sensor technologies constantly pushing the boundaries of emotion recognition and response.
Regulatory frameworks vary across regions, impacting data privacy and ethical considerations, creating both opportunities and challenges. Product substitutes, such as traditional methods of user feedback, remain present but are gradually being replaced by the more efficient and nuanced data provided by Affective Computing solutions. End-user trends show a clear preference for personalized and intuitive experiences, fueling demand for affective computing applications. M&A activity is significant, with an estimated xx deals concluded annually in the past five years, resulting in increased market consolidation. Major players are focusing on strategic acquisitions to expand their product portfolios and geographic reach. Market share is fragmented, with the top five companies accounting for approximately xx% of the market in 2024.
Affective Computing Industry Industry Trends & Analysis
The Affective Computing market is characterized by a Compound Annual Growth Rate (CAGR) of xx% during the forecast period (2025-2033). This robust growth is fueled by several key factors. Technological advancements, particularly in AI and machine learning, are continuously improving the accuracy and efficiency of emotion recognition. The increasing adoption of AI-powered solutions across various sectors is driving demand for affective computing technologies. Consumer preference for personalized experiences is further accelerating market growth, as businesses seek to understand and cater to customer emotions better.
Competitive dynamics are intense, with both established players and emerging startups vying for market share. Market penetration is increasing across diverse sectors, particularly in healthcare, where affective computing is used in mental health assessments and patient monitoring. The automotive industry is witnessing significant growth, driven by the need for enhanced driver safety and autonomous driving features. The retail sector is adopting affective computing to improve customer experience and personalize marketing campaigns.
Leading Markets & Segments in Affective Computing Industry
The North American market currently dominates the Affective Computing landscape, driven by strong technological advancements, early adoption of new technologies, and a large base of established players. However, the Asia-Pacific region is anticipated to showcase the fastest growth during the forecast period, propelled by rapid economic expansion and a growing population.
By Component: The software segment currently dominates, reflecting the software-driven nature of Affective Computing solutions; however, the hardware segment is expected to experience significant growth, particularly with the development of advanced sensors.
By End-user Industry: Healthcare, Automotive, and Retail are the leading end-user industries, although other sectors such as education and entertainment are demonstrating significant growth potential.
Key Drivers: Strong technological infrastructure, supportive government policies encouraging AI development, and rising consumer demand for AI-powered applications.
Affective Computing Industry Product Developments
Recent product innovations center on enhanced accuracy and efficiency in emotion recognition, driven by the development of more sophisticated algorithms and sensors. Applications range from personalized healthcare solutions and improved driver safety systems to enhanced customer experience in retail and marketing. The competitive advantages lie in the accuracy of emotion detection, the integration of affective computing with other technologies (e.g., IoT), and the development of user-friendly interfaces.
Key Drivers of Affective Computing Industry Growth
Technological advancements in AI, machine learning, and sensor technology are the primary drivers of industry growth. Economic factors, such as increasing investment in AI-related research and development, further propel market expansion. Supportive government regulations and initiatives focused on promoting AI adoption are also playing a crucial role. Examples include the increasing use of affective computing in healthcare applications, such as mental health assessment tools and patient monitoring systems.
Challenges in the Affective Computing Industry Market
Data privacy and ethical concerns present significant challenges, particularly around the collection and use of sensitive emotional data. Supply chain disruptions can impact the availability of essential components for hardware solutions. Intense competition from established technology giants and numerous emerging players creates pricing pressure and restricts profit margins. These issues lead to a xx% reduction in projected revenue in certain segments.
Emerging Opportunities in Affective Computing Industry
The integration of affective computing with other emerging technologies, such as virtual and augmented reality, presents significant opportunities for growth. Strategic partnerships between technology companies and end-user industries facilitate innovation and market penetration. Expansion into new and emerging markets, particularly in developing economies, offers substantial growth potential. The development of new applications in various sectors, such as education and the metaverse, further contributes to market expansion.
Leading Players in the Affective Computing Industry Sector
- Eyesight Technologies Ltd
- IBM Corporation
- Nuance Communications Inc (Microsoft Corporation)
- Realeyes Data Services Ltd
- Nemesysco Ltd
- Kairos AR Inc
- Affectiva Inc
- Amazon Web Services Inc
- audEERING GmbH
- Emotibot Technologies Limited
- Element Human Ltd
- Gesturetek Inc
Key Milestones in Affective Computing Industry Industry
September 2022: Nuance Communications, Inc. announced expanded use of Nuance Dragon TV, enhancing accessibility for visually impaired users. This highlights the growing focus on inclusive technology and market expansion within the accessibility sector.
August 2022: CallMiner's integration with Genesys Cloud CX and Amazon Connect accelerated real-time analytics capabilities in contact centers, improving customer service efficiency. This signifies the integration of affective computing with existing contact center technologies to enhance customer interactions.
May 2022: A workshop on Affective Computing and Social Robots in Autism rehabilitation showcased the technology's potential in specialized healthcare applications. This underscores the expansion of affective computing into niche healthcare sectors with significant growth opportunities.
Strategic Outlook for Affective Computing Industry Market
The Affective Computing market is poised for sustained growth, driven by technological innovation, increased investment, and growing adoption across diverse sectors. Strategic opportunities lie in developing innovative applications, forging strategic partnerships, and expanding into new geographical markets. Focusing on data privacy and ethical considerations will be crucial for building trust and ensuring long-term market success. The future holds immense potential for this transformative technology to revolutionize how humans interact with machines and each other.
Affective Computing Industry Segmentation
-
1. Component
-
1.1. Hardware
- 1.1.1. Sensors
- 1.1.2. Cameras
- 1.1.3. Storage Devices and Processors
- 1.1.4. Other Components
-
1.2. Software
- 1.2.1. Analytics Software
- 1.2.2. Enterprise Software
- 1.2.3. Facial Recognition
- 1.2.4. Gesture Recognition
- 1.2.5. Speech Recognition
-
1.1. Hardware
-
2. End-user Industry
- 2.1. Healthcare
- 2.2. Automotive
- 2.3. Retail
- 2.4. Other End-user Industries
Affective Computing Industry Segmentation By Geography
- 1. North America
- 2. Europe
- 3. Asia
- 4. Latin America
- 5. Middle East and Africa
Affective Computing Industry REPORT HIGHLIGHTS
| Aspects | Details |
|---|---|
| Study Period | 2019-2033 |
| Base Year | 2024 |
| Estimated Year | 2025 |
| Forecast Period | 2025-2033 |
| Historical Period | 2019-2024 |
| Growth Rate | CAGR of 24.29% from 2019-2033 |
| Segmentation |
|
Table of Contents
- 1. Introduction
- 1.1. Research Scope
- 1.2. Market Segmentation
- 1.3. Research Methodology
- 1.4. Definitions and Assumptions
- 2. Executive Summary
- 2.1. Introduction
- 3. Market Dynamics
- 3.1. Introduction
- 3.2. Market Drivers
- 3.2.1. Increased Automation in Contact Centers; Increasing Adoption of Cloud-based Solutions and Online Solutions; Rising Technology Adoptions in Various Industries such as Automotive
- 3.3. Market Restrains
- 3.3.1. ; High Cost of RF Power
- 3.4. Market Trends
- 3.4.1. Rising Technology Adoptions in Various Industries such as Automotive
- 4. Market Factor Analysis
- 4.1. Porters Five Forces
- 4.2. Supply/Value Chain
- 4.3. PESTEL analysis
- 4.4. Market Entropy
- 4.5. Patent/Trademark Analysis
- 5. Global Affective Computing Industry Analysis, Insights and Forecast, 2019-2031
- 5.1. Market Analysis, Insights and Forecast - by Component
- 5.1.1. Hardware
- 5.1.1.1. Sensors
- 5.1.1.2. Cameras
- 5.1.1.3. Storage Devices and Processors
- 5.1.1.4. Other Components
- 5.1.2. Software
- 5.1.2.1. Analytics Software
- 5.1.2.2. Enterprise Software
- 5.1.2.3. Facial Recognition
- 5.1.2.4. Gesture Recognition
- 5.1.2.5. Speech Recognition
- 5.1.1. Hardware
- 5.2. Market Analysis, Insights and Forecast - by End-user Industry
- 5.2.1. Healthcare
- 5.2.2. Automotive
- 5.2.3. Retail
- 5.2.4. Other End-user Industries
- 5.3. Market Analysis, Insights and Forecast - by Region
- 5.3.1. North America
- 5.3.2. Europe
- 5.3.3. Asia
- 5.3.4. Latin America
- 5.3.5. Middle East and Africa
- 5.1. Market Analysis, Insights and Forecast - by Component
- 6. North America Affective Computing Industry Analysis, Insights and Forecast, 2019-2031
- 6.1. Market Analysis, Insights and Forecast - by Component
- 6.1.1. Hardware
- 6.1.1.1. Sensors
- 6.1.1.2. Cameras
- 6.1.1.3. Storage Devices and Processors
- 6.1.1.4. Other Components
- 6.1.2. Software
- 6.1.2.1. Analytics Software
- 6.1.2.2. Enterprise Software
- 6.1.2.3. Facial Recognition
- 6.1.2.4. Gesture Recognition
- 6.1.2.5. Speech Recognition
- 6.1.1. Hardware
- 6.2. Market Analysis, Insights and Forecast - by End-user Industry
- 6.2.1. Healthcare
- 6.2.2. Automotive
- 6.2.3. Retail
- 6.2.4. Other End-user Industries
- 6.1. Market Analysis, Insights and Forecast - by Component
- 7. Europe Affective Computing Industry Analysis, Insights and Forecast, 2019-2031
- 7.1. Market Analysis, Insights and Forecast - by Component
- 7.1.1. Hardware
- 7.1.1.1. Sensors
- 7.1.1.2. Cameras
- 7.1.1.3. Storage Devices and Processors
- 7.1.1.4. Other Components
- 7.1.2. Software
- 7.1.2.1. Analytics Software
- 7.1.2.2. Enterprise Software
- 7.1.2.3. Facial Recognition
- 7.1.2.4. Gesture Recognition
- 7.1.2.5. Speech Recognition
- 7.1.1. Hardware
- 7.2. Market Analysis, Insights and Forecast - by End-user Industry
- 7.2.1. Healthcare
- 7.2.2. Automotive
- 7.2.3. Retail
- 7.2.4. Other End-user Industries
- 7.1. Market Analysis, Insights and Forecast - by Component
- 8. Asia Affective Computing Industry Analysis, Insights and Forecast, 2019-2031
- 8.1. Market Analysis, Insights and Forecast - by Component
- 8.1.1. Hardware
- 8.1.1.1. Sensors
- 8.1.1.2. Cameras
- 8.1.1.3. Storage Devices and Processors
- 8.1.1.4. Other Components
- 8.1.2. Software
- 8.1.2.1. Analytics Software
- 8.1.2.2. Enterprise Software
- 8.1.2.3. Facial Recognition
- 8.1.2.4. Gesture Recognition
- 8.1.2.5. Speech Recognition
- 8.1.1. Hardware
- 8.2. Market Analysis, Insights and Forecast - by End-user Industry
- 8.2.1. Healthcare
- 8.2.2. Automotive
- 8.2.3. Retail
- 8.2.4. Other End-user Industries
- 8.1. Market Analysis, Insights and Forecast - by Component
- 9. Latin America Affective Computing Industry Analysis, Insights and Forecast, 2019-2031
- 9.1. Market Analysis, Insights and Forecast - by Component
- 9.1.1. Hardware
- 9.1.1.1. Sensors
- 9.1.1.2. Cameras
- 9.1.1.3. Storage Devices and Processors
- 9.1.1.4. Other Components
- 9.1.2. Software
- 9.1.2.1. Analytics Software
- 9.1.2.2. Enterprise Software
- 9.1.2.3. Facial Recognition
- 9.1.2.4. Gesture Recognition
- 9.1.2.5. Speech Recognition
- 9.1.1. Hardware
- 9.2. Market Analysis, Insights and Forecast - by End-user Industry
- 9.2.1. Healthcare
- 9.2.2. Automotive
- 9.2.3. Retail
- 9.2.4. Other End-user Industries
- 9.1. Market Analysis, Insights and Forecast - by Component
- 10. Middle East and Africa Affective Computing Industry Analysis, Insights and Forecast, 2019-2031
- 10.1. Market Analysis, Insights and Forecast - by Component
- 10.1.1. Hardware
- 10.1.1.1. Sensors
- 10.1.1.2. Cameras
- 10.1.1.3. Storage Devices and Processors
- 10.1.1.4. Other Components
- 10.1.2. Software
- 10.1.2.1. Analytics Software
- 10.1.2.2. Enterprise Software
- 10.1.2.3. Facial Recognition
- 10.1.2.4. Gesture Recognition
- 10.1.2.5. Speech Recognition
- 10.1.1. Hardware
- 10.2. Market Analysis, Insights and Forecast - by End-user Industry
- 10.2.1. Healthcare
- 10.2.2. Automotive
- 10.2.3. Retail
- 10.2.4. Other End-user Industries
- 10.1. Market Analysis, Insights and Forecast - by Component
- 11. North America Affective Computing Industry Analysis, Insights and Forecast, 2019-2031
- 11.1. Market Analysis, Insights and Forecast - By Country/Sub-region
- 11.1.1 United States
- 11.1.2 Canada
- 11.1.3 Mexico
- 12. Europe Affective Computing Industry Analysis, Insights and Forecast, 2019-2031
- 12.1. Market Analysis, Insights and Forecast - By Country/Sub-region
- 12.1.1 Germany
- 12.1.2 United Kingdom
- 12.1.3 France
- 12.1.4 Spain
- 12.1.5 Italy
- 12.1.6 Spain
- 12.1.7 Belgium
- 12.1.8 Netherland
- 12.1.9 Nordics
- 12.1.10 Rest of Europe
- 13. Asia Pacific Affective Computing Industry Analysis, Insights and Forecast, 2019-2031
- 13.1. Market Analysis, Insights and Forecast - By Country/Sub-region
- 13.1.1 China
- 13.1.2 Japan
- 13.1.3 India
- 13.1.4 South Korea
- 13.1.5 Southeast Asia
- 13.1.6 Australia
- 13.1.7 Indonesia
- 13.1.8 Phillipes
- 13.1.9 Singapore
- 13.1.10 Thailandc
- 13.1.11 Rest of Asia Pacific
- 14. South America Affective Computing Industry Analysis, Insights and Forecast, 2019-2031
- 14.1. Market Analysis, Insights and Forecast - By Country/Sub-region
- 14.1.1 Brazil
- 14.1.2 Argentina
- 14.1.3 Peru
- 14.1.4 Chile
- 14.1.5 Colombia
- 14.1.6 Ecuador
- 14.1.7 Venezuela
- 14.1.8 Rest of South America
- 15. North America Affective Computing Industry Analysis, Insights and Forecast, 2019-2031
- 15.1. Market Analysis, Insights and Forecast - By Country/Sub-region
- 15.1.1 United States
- 15.1.2 Canada
- 15.1.3 Mexico
- 16. MEA Affective Computing Industry Analysis, Insights and Forecast, 2019-2031
- 16.1. Market Analysis, Insights and Forecast - By Country/Sub-region
- 16.1.1 United Arab Emirates
- 16.1.2 Saudi Arabia
- 16.1.3 South Africa
- 16.1.4 Rest of Middle East and Africa
- 17. Competitive Analysis
- 17.1. Global Market Share Analysis 2024
- 17.2. Company Profiles
- 17.2.1 Eyesight Technologies Ltd
- 17.2.1.1. Overview
- 17.2.1.2. Products
- 17.2.1.3. SWOT Analysis
- 17.2.1.4. Recent Developments
- 17.2.1.5. Financials (Based on Availability)
- 17.2.2 IBM Corporation
- 17.2.2.1. Overview
- 17.2.2.2. Products
- 17.2.2.3. SWOT Analysis
- 17.2.2.4. Recent Developments
- 17.2.2.5. Financials (Based on Availability)
- 17.2.3 Nuance Communications Inc (Microsoft Corporation)
- 17.2.3.1. Overview
- 17.2.3.2. Products
- 17.2.3.3. SWOT Analysis
- 17.2.3.4. Recent Developments
- 17.2.3.5. Financials (Based on Availability)
- 17.2.4 Realeyes Data Services Ltd
- 17.2.4.1. Overview
- 17.2.4.2. Products
- 17.2.4.3. SWOT Analysis
- 17.2.4.4. Recent Developments
- 17.2.4.5. Financials (Based on Availability)
- 17.2.5 Nemesysco Ltd
- 17.2.5.1. Overview
- 17.2.5.2. Products
- 17.2.5.3. SWOT Analysis
- 17.2.5.4. Recent Developments
- 17.2.5.5. Financials (Based on Availability)
- 17.2.6 Kairos AR Inc
- 17.2.6.1. Overview
- 17.2.6.2. Products
- 17.2.6.3. SWOT Analysis
- 17.2.6.4. Recent Developments
- 17.2.6.5. Financials (Based on Availability)
- 17.2.7 Affectiva Inc
- 17.2.7.1. Overview
- 17.2.7.2. Products
- 17.2.7.3. SWOT Analysis
- 17.2.7.4. Recent Developments
- 17.2.7.5. Financials (Based on Availability)
- 17.2.8 Amazon Web Services Inc
- 17.2.8.1. Overview
- 17.2.8.2. Products
- 17.2.8.3. SWOT Analysis
- 17.2.8.4. Recent Developments
- 17.2.8.5. Financials (Based on Availability)
- 17.2.9 audEERING GmbH
- 17.2.9.1. Overview
- 17.2.9.2. Products
- 17.2.9.3. SWOT Analysis
- 17.2.9.4. Recent Developments
- 17.2.9.5. Financials (Based on Availability)
- 17.2.10 Emotibot Technologies Limited
- 17.2.10.1. Overview
- 17.2.10.2. Products
- 17.2.10.3. SWOT Analysis
- 17.2.10.4. Recent Developments
- 17.2.10.5. Financials (Based on Availability)
- 17.2.11 Element Human Ltd
- 17.2.11.1. Overview
- 17.2.11.2. Products
- 17.2.11.3. SWOT Analysis
- 17.2.11.4. Recent Developments
- 17.2.11.5. Financials (Based on Availability)
- 17.2.12 Gesturetek Inc
- 17.2.12.1. Overview
- 17.2.12.2. Products
- 17.2.12.3. SWOT Analysis
- 17.2.12.4. Recent Developments
- 17.2.12.5. Financials (Based on Availability)
- 17.2.1 Eyesight Technologies Ltd
List of Figures
- Figure 1: Global Affective Computing Industry Revenue Breakdown (Million, %) by Region 2024 & 2032
- Figure 2: Global Affective Computing Industry Volume Breakdown (K Unit, %) by Region 2024 & 2032
- Figure 3: North America Affective Computing Industry Revenue (Million), by Country 2024 & 2032
- Figure 4: North America Affective Computing Industry Volume (K Unit), by Country 2024 & 2032
- Figure 5: North America Affective Computing Industry Revenue Share (%), by Country 2024 & 2032
- Figure 6: North America Affective Computing Industry Volume Share (%), by Country 2024 & 2032
- Figure 7: Europe Affective Computing Industry Revenue (Million), by Country 2024 & 2032
- Figure 8: Europe Affective Computing Industry Volume (K Unit), by Country 2024 & 2032
- Figure 9: Europe Affective Computing Industry Revenue Share (%), by Country 2024 & 2032
- Figure 10: Europe Affective Computing Industry Volume Share (%), by Country 2024 & 2032
- Figure 11: Asia Pacific Affective Computing Industry Revenue (Million), by Country 2024 & 2032
- Figure 12: Asia Pacific Affective Computing Industry Volume (K Unit), by Country 2024 & 2032
- Figure 13: Asia Pacific Affective Computing Industry Revenue Share (%), by Country 2024 & 2032
- Figure 14: Asia Pacific Affective Computing Industry Volume Share (%), by Country 2024 & 2032
- Figure 15: South America Affective Computing Industry Revenue (Million), by Country 2024 & 2032
- Figure 16: South America Affective Computing Industry Volume (K Unit), by Country 2024 & 2032
- Figure 17: South America Affective Computing Industry Revenue Share (%), by Country 2024 & 2032
- Figure 18: South America Affective Computing Industry Volume Share (%), by Country 2024 & 2032
- Figure 19: North America Affective Computing Industry Revenue (Million), by Country 2024 & 2032
- Figure 20: North America Affective Computing Industry Volume (K Unit), by Country 2024 & 2032
- Figure 21: North America Affective Computing Industry Revenue Share (%), by Country 2024 & 2032
- Figure 22: North America Affective Computing Industry Volume Share (%), by Country 2024 & 2032
- Figure 23: MEA Affective Computing Industry Revenue (Million), by Country 2024 & 2032
- Figure 24: MEA Affective Computing Industry Volume (K Unit), by Country 2024 & 2032
- Figure 25: MEA Affective Computing Industry Revenue Share (%), by Country 2024 & 2032
- Figure 26: MEA Affective Computing Industry Volume Share (%), by Country 2024 & 2032
- Figure 27: North America Affective Computing Industry Revenue (Million), by Component 2024 & 2032
- Figure 28: North America Affective Computing Industry Volume (K Unit), by Component 2024 & 2032
- Figure 29: North America Affective Computing Industry Revenue Share (%), by Component 2024 & 2032
- Figure 30: North America Affective Computing Industry Volume Share (%), by Component 2024 & 2032
- Figure 31: North America Affective Computing Industry Revenue (Million), by End-user Industry 2024 & 2032
- Figure 32: North America Affective Computing Industry Volume (K Unit), by End-user Industry 2024 & 2032
- Figure 33: North America Affective Computing Industry Revenue Share (%), by End-user Industry 2024 & 2032
- Figure 34: North America Affective Computing Industry Volume Share (%), by End-user Industry 2024 & 2032
- Figure 35: North America Affective Computing Industry Revenue (Million), by Country 2024 & 2032
- Figure 36: North America Affective Computing Industry Volume (K Unit), by Country 2024 & 2032
- Figure 37: North America Affective Computing Industry Revenue Share (%), by Country 2024 & 2032
- Figure 38: North America Affective Computing Industry Volume Share (%), by Country 2024 & 2032
- Figure 39: Europe Affective Computing Industry Revenue (Million), by Component 2024 & 2032
- Figure 40: Europe Affective Computing Industry Volume (K Unit), by Component 2024 & 2032
- Figure 41: Europe Affective Computing Industry Revenue Share (%), by Component 2024 & 2032
- Figure 42: Europe Affective Computing Industry Volume Share (%), by Component 2024 & 2032
- Figure 43: Europe Affective Computing Industry Revenue (Million), by End-user Industry 2024 & 2032
- Figure 44: Europe Affective Computing Industry Volume (K Unit), by End-user Industry 2024 & 2032
- Figure 45: Europe Affective Computing Industry Revenue Share (%), by End-user Industry 2024 & 2032
- Figure 46: Europe Affective Computing Industry Volume Share (%), by End-user Industry 2024 & 2032
- Figure 47: Europe Affective Computing Industry Revenue (Million), by Country 2024 & 2032
- Figure 48: Europe Affective Computing Industry Volume (K Unit), by Country 2024 & 2032
- Figure 49: Europe Affective Computing Industry Revenue Share (%), by Country 2024 & 2032
- Figure 50: Europe Affective Computing Industry Volume Share (%), by Country 2024 & 2032
- Figure 51: Asia Affective Computing Industry Revenue (Million), by Component 2024 & 2032
- Figure 52: Asia Affective Computing Industry Volume (K Unit), by Component 2024 & 2032
- Figure 53: Asia Affective Computing Industry Revenue Share (%), by Component 2024 & 2032
- Figure 54: Asia Affective Computing Industry Volume Share (%), by Component 2024 & 2032
- Figure 55: Asia Affective Computing Industry Revenue (Million), by End-user Industry 2024 & 2032
- Figure 56: Asia Affective Computing Industry Volume (K Unit), by End-user Industry 2024 & 2032
- Figure 57: Asia Affective Computing Industry Revenue Share (%), by End-user Industry 2024 & 2032
- Figure 58: Asia Affective Computing Industry Volume Share (%), by End-user Industry 2024 & 2032
- Figure 59: Asia Affective Computing Industry Revenue (Million), by Country 2024 & 2032
- Figure 60: Asia Affective Computing Industry Volume (K Unit), by Country 2024 & 2032
- Figure 61: Asia Affective Computing Industry Revenue Share (%), by Country 2024 & 2032
- Figure 62: Asia Affective Computing Industry Volume Share (%), by Country 2024 & 2032
- Figure 63: Latin America Affective Computing Industry Revenue (Million), by Component 2024 & 2032
- Figure 64: Latin America Affective Computing Industry Volume (K Unit), by Component 2024 & 2032
- Figure 65: Latin America Affective Computing Industry Revenue Share (%), by Component 2024 & 2032
- Figure 66: Latin America Affective Computing Industry Volume Share (%), by Component 2024 & 2032
- Figure 67: Latin America Affective Computing Industry Revenue (Million), by End-user Industry 2024 & 2032
- Figure 68: Latin America Affective Computing Industry Volume (K Unit), by End-user Industry 2024 & 2032
- Figure 69: Latin America Affective Computing Industry Revenue Share (%), by End-user Industry 2024 & 2032
- Figure 70: Latin America Affective Computing Industry Volume Share (%), by End-user Industry 2024 & 2032
- Figure 71: Latin America Affective Computing Industry Revenue (Million), by Country 2024 & 2032
- Figure 72: Latin America Affective Computing Industry Volume (K Unit), by Country 2024 & 2032
- Figure 73: Latin America Affective Computing Industry Revenue Share (%), by Country 2024 & 2032
- Figure 74: Latin America Affective Computing Industry Volume Share (%), by Country 2024 & 2032
- Figure 75: Middle East and Africa Affective Computing Industry Revenue (Million), by Component 2024 & 2032
- Figure 76: Middle East and Africa Affective Computing Industry Volume (K Unit), by Component 2024 & 2032
- Figure 77: Middle East and Africa Affective Computing Industry Revenue Share (%), by Component 2024 & 2032
- Figure 78: Middle East and Africa Affective Computing Industry Volume Share (%), by Component 2024 & 2032
- Figure 79: Middle East and Africa Affective Computing Industry Revenue (Million), by End-user Industry 2024 & 2032
- Figure 80: Middle East and Africa Affective Computing Industry Volume (K Unit), by End-user Industry 2024 & 2032
- Figure 81: Middle East and Africa Affective Computing Industry Revenue Share (%), by End-user Industry 2024 & 2032
- Figure 82: Middle East and Africa Affective Computing Industry Volume Share (%), by End-user Industry 2024 & 2032
- Figure 83: Middle East and Africa Affective Computing Industry Revenue (Million), by Country 2024 & 2032
- Figure 84: Middle East and Africa Affective Computing Industry Volume (K Unit), by Country 2024 & 2032
- Figure 85: Middle East and Africa Affective Computing Industry Revenue Share (%), by Country 2024 & 2032
- Figure 86: Middle East and Africa Affective Computing Industry Volume Share (%), by Country 2024 & 2032
List of Tables
- Table 1: Global Affective Computing Industry Revenue Million Forecast, by Region 2019 & 2032
- Table 2: Global Affective Computing Industry Volume K Unit Forecast, by Region 2019 & 2032
- Table 3: Global Affective Computing Industry Revenue Million Forecast, by Component 2019 & 2032
- Table 4: Global Affective Computing Industry Volume K Unit Forecast, by Component 2019 & 2032
- Table 5: Global Affective Computing Industry Revenue Million Forecast, by End-user Industry 2019 & 2032
- Table 6: Global Affective Computing Industry Volume K Unit Forecast, by End-user Industry 2019 & 2032
- Table 7: Global Affective Computing Industry Revenue Million Forecast, by Region 2019 & 2032
- Table 8: Global Affective Computing Industry Volume K Unit Forecast, by Region 2019 & 2032
- Table 9: Global Affective Computing Industry Revenue Million Forecast, by Country 2019 & 2032
- Table 10: Global Affective Computing Industry Volume K Unit Forecast, by Country 2019 & 2032
- Table 11: United States Affective Computing Industry Revenue (Million) Forecast, by Application 2019 & 2032
- Table 12: United States Affective Computing Industry Volume (K Unit) Forecast, by Application 2019 & 2032
- Table 13: Canada Affective Computing Industry Revenue (Million) Forecast, by Application 2019 & 2032
- Table 14: Canada Affective Computing Industry Volume (K Unit) Forecast, by Application 2019 & 2032
- Table 15: Mexico Affective Computing Industry Revenue (Million) Forecast, by Application 2019 & 2032
- Table 16: Mexico Affective Computing Industry Volume (K Unit) Forecast, by Application 2019 & 2032
- Table 17: Global Affective Computing Industry Revenue Million Forecast, by Country 2019 & 2032
- Table 18: Global Affective Computing Industry Volume K Unit Forecast, by Country 2019 & 2032
- Table 19: Germany Affective Computing Industry Revenue (Million) Forecast, by Application 2019 & 2032
- Table 20: Germany Affective Computing Industry Volume (K Unit) Forecast, by Application 2019 & 2032
- Table 21: United Kingdom Affective Computing Industry Revenue (Million) Forecast, by Application 2019 & 2032
- Table 22: United Kingdom Affective Computing Industry Volume (K Unit) Forecast, by Application 2019 & 2032
- Table 23: France Affective Computing Industry Revenue (Million) Forecast, by Application 2019 & 2032
- Table 24: France Affective Computing Industry Volume (K Unit) Forecast, by Application 2019 & 2032
- Table 25: Spain Affective Computing Industry Revenue (Million) Forecast, by Application 2019 & 2032
- Table 26: Spain Affective Computing Industry Volume (K Unit) Forecast, by Application 2019 & 2032
- Table 27: Italy Affective Computing Industry Revenue (Million) Forecast, by Application 2019 & 2032
- Table 28: Italy Affective Computing Industry Volume (K Unit) Forecast, by Application 2019 & 2032
- Table 29: Spain Affective Computing Industry Revenue (Million) Forecast, by Application 2019 & 2032
- Table 30: Spain Affective Computing Industry Volume (K Unit) Forecast, by Application 2019 & 2032
- Table 31: Belgium Affective Computing Industry Revenue (Million) Forecast, by Application 2019 & 2032
- Table 32: Belgium Affective Computing Industry Volume (K Unit) Forecast, by Application 2019 & 2032
- Table 33: Netherland Affective Computing Industry Revenue (Million) Forecast, by Application 2019 & 2032
- Table 34: Netherland Affective Computing Industry Volume (K Unit) Forecast, by Application 2019 & 2032
- Table 35: Nordics Affective Computing Industry Revenue (Million) Forecast, by Application 2019 & 2032
- Table 36: Nordics Affective Computing Industry Volume (K Unit) Forecast, by Application 2019 & 2032
- Table 37: Rest of Europe Affective Computing Industry Revenue (Million) Forecast, by Application 2019 & 2032
- Table 38: Rest of Europe Affective Computing Industry Volume (K Unit) Forecast, by Application 2019 & 2032
- Table 39: Global Affective Computing Industry Revenue Million Forecast, by Country 2019 & 2032
- Table 40: Global Affective Computing Industry Volume K Unit Forecast, by Country 2019 & 2032
- Table 41: China Affective Computing Industry Revenue (Million) Forecast, by Application 2019 & 2032
- Table 42: China Affective Computing Industry Volume (K Unit) Forecast, by Application 2019 & 2032
- Table 43: Japan Affective Computing Industry Revenue (Million) Forecast, by Application 2019 & 2032
- Table 44: Japan Affective Computing Industry Volume (K Unit) Forecast, by Application 2019 & 2032
- Table 45: India Affective Computing Industry Revenue (Million) Forecast, by Application 2019 & 2032
- Table 46: India Affective Computing Industry Volume (K Unit) Forecast, by Application 2019 & 2032
- Table 47: South Korea Affective Computing Industry Revenue (Million) Forecast, by Application 2019 & 2032
- Table 48: South Korea Affective Computing Industry Volume (K Unit) Forecast, by Application 2019 & 2032
- Table 49: Southeast Asia Affective Computing Industry Revenue (Million) Forecast, by Application 2019 & 2032
- Table 50: Southeast Asia Affective Computing Industry Volume (K Unit) Forecast, by Application 2019 & 2032
- Table 51: Australia Affective Computing Industry Revenue (Million) Forecast, by Application 2019 & 2032
- Table 52: Australia Affective Computing Industry Volume (K Unit) Forecast, by Application 2019 & 2032
- Table 53: Indonesia Affective Computing Industry Revenue (Million) Forecast, by Application 2019 & 2032
- Table 54: Indonesia Affective Computing Industry Volume (K Unit) Forecast, by Application 2019 & 2032
- Table 55: Phillipes Affective Computing Industry Revenue (Million) Forecast, by Application 2019 & 2032
- Table 56: Phillipes Affective Computing Industry Volume (K Unit) Forecast, by Application 2019 & 2032
- Table 57: Singapore Affective Computing Industry Revenue (Million) Forecast, by Application 2019 & 2032
- Table 58: Singapore Affective Computing Industry Volume (K Unit) Forecast, by Application 2019 & 2032
- Table 59: Thailandc Affective Computing Industry Revenue (Million) Forecast, by Application 2019 & 2032
- Table 60: Thailandc Affective Computing Industry Volume (K Unit) Forecast, by Application 2019 & 2032
- Table 61: Rest of Asia Pacific Affective Computing Industry Revenue (Million) Forecast, by Application 2019 & 2032
- Table 62: Rest of Asia Pacific Affective Computing Industry Volume (K Unit) Forecast, by Application 2019 & 2032
- Table 63: Global Affective Computing Industry Revenue Million Forecast, by Country 2019 & 2032
- Table 64: Global Affective Computing Industry Volume K Unit Forecast, by Country 2019 & 2032
- Table 65: Brazil Affective Computing Industry Revenue (Million) Forecast, by Application 2019 & 2032
- Table 66: Brazil Affective Computing Industry Volume (K Unit) Forecast, by Application 2019 & 2032
- Table 67: Argentina Affective Computing Industry Revenue (Million) Forecast, by Application 2019 & 2032
- Table 68: Argentina Affective Computing Industry Volume (K Unit) Forecast, by Application 2019 & 2032
- Table 69: Peru Affective Computing Industry Revenue (Million) Forecast, by Application 2019 & 2032
- Table 70: Peru Affective Computing Industry Volume (K Unit) Forecast, by Application 2019 & 2032
- Table 71: Chile Affective Computing Industry Revenue (Million) Forecast, by Application 2019 & 2032
- Table 72: Chile Affective Computing Industry Volume (K Unit) Forecast, by Application 2019 & 2032
- Table 73: Colombia Affective Computing Industry Revenue (Million) Forecast, by Application 2019 & 2032
- Table 74: Colombia Affective Computing Industry Volume (K Unit) Forecast, by Application 2019 & 2032
- Table 75: Ecuador Affective Computing Industry Revenue (Million) Forecast, by Application 2019 & 2032
- Table 76: Ecuador Affective Computing Industry Volume (K Unit) Forecast, by Application 2019 & 2032
- Table 77: Venezuela Affective Computing Industry Revenue (Million) Forecast, by Application 2019 & 2032
- Table 78: Venezuela Affective Computing Industry Volume (K Unit) Forecast, by Application 2019 & 2032
- Table 79: Rest of South America Affective Computing Industry Revenue (Million) Forecast, by Application 2019 & 2032
- Table 80: Rest of South America Affective Computing Industry Volume (K Unit) Forecast, by Application 2019 & 2032
- Table 81: Global Affective Computing Industry Revenue Million Forecast, by Country 2019 & 2032
- Table 82: Global Affective Computing Industry Volume K Unit Forecast, by Country 2019 & 2032
- Table 83: United States Affective Computing Industry Revenue (Million) Forecast, by Application 2019 & 2032
- Table 84: United States Affective Computing Industry Volume (K Unit) Forecast, by Application 2019 & 2032
- Table 85: Canada Affective Computing Industry Revenue (Million) Forecast, by Application 2019 & 2032
- Table 86: Canada Affective Computing Industry Volume (K Unit) Forecast, by Application 2019 & 2032
- Table 87: Mexico Affective Computing Industry Revenue (Million) Forecast, by Application 2019 & 2032
- Table 88: Mexico Affective Computing Industry Volume (K Unit) Forecast, by Application 2019 & 2032
- Table 89: Global Affective Computing Industry Revenue Million Forecast, by Country 2019 & 2032
- Table 90: Global Affective Computing Industry Volume K Unit Forecast, by Country 2019 & 2032
- Table 91: United Arab Emirates Affective Computing Industry Revenue (Million) Forecast, by Application 2019 & 2032
- Table 92: United Arab Emirates Affective Computing Industry Volume (K Unit) Forecast, by Application 2019 & 2032
- Table 93: Saudi Arabia Affective Computing Industry Revenue (Million) Forecast, by Application 2019 & 2032
- Table 94: Saudi Arabia Affective Computing Industry Volume (K Unit) Forecast, by Application 2019 & 2032
- Table 95: South Africa Affective Computing Industry Revenue (Million) Forecast, by Application 2019 & 2032
- Table 96: South Africa Affective Computing Industry Volume (K Unit) Forecast, by Application 2019 & 2032
- Table 97: Rest of Middle East and Africa Affective Computing Industry Revenue (Million) Forecast, by Application 2019 & 2032
- Table 98: Rest of Middle East and Africa Affective Computing Industry Volume (K Unit) Forecast, by Application 2019 & 2032
- Table 99: Global Affective Computing Industry Revenue Million Forecast, by Component 2019 & 2032
- Table 100: Global Affective Computing Industry Volume K Unit Forecast, by Component 2019 & 2032
- Table 101: Global Affective Computing Industry Revenue Million Forecast, by End-user Industry 2019 & 2032
- Table 102: Global Affective Computing Industry Volume K Unit Forecast, by End-user Industry 2019 & 2032
- Table 103: Global Affective Computing Industry Revenue Million Forecast, by Country 2019 & 2032
- Table 104: Global Affective Computing Industry Volume K Unit Forecast, by Country 2019 & 2032
- Table 105: Global Affective Computing Industry Revenue Million Forecast, by Component 2019 & 2032
- Table 106: Global Affective Computing Industry Volume K Unit Forecast, by Component 2019 & 2032
- Table 107: Global Affective Computing Industry Revenue Million Forecast, by End-user Industry 2019 & 2032
- Table 108: Global Affective Computing Industry Volume K Unit Forecast, by End-user Industry 2019 & 2032
- Table 109: Global Affective Computing Industry Revenue Million Forecast, by Country 2019 & 2032
- Table 110: Global Affective Computing Industry Volume K Unit Forecast, by Country 2019 & 2032
- Table 111: Global Affective Computing Industry Revenue Million Forecast, by Component 2019 & 2032
- Table 112: Global Affective Computing Industry Volume K Unit Forecast, by Component 2019 & 2032
- Table 113: Global Affective Computing Industry Revenue Million Forecast, by End-user Industry 2019 & 2032
- Table 114: Global Affective Computing Industry Volume K Unit Forecast, by End-user Industry 2019 & 2032
- Table 115: Global Affective Computing Industry Revenue Million Forecast, by Country 2019 & 2032
- Table 116: Global Affective Computing Industry Volume K Unit Forecast, by Country 2019 & 2032
- Table 117: Global Affective Computing Industry Revenue Million Forecast, by Component 2019 & 2032
- Table 118: Global Affective Computing Industry Volume K Unit Forecast, by Component 2019 & 2032
- Table 119: Global Affective Computing Industry Revenue Million Forecast, by End-user Industry 2019 & 2032
- Table 120: Global Affective Computing Industry Volume K Unit Forecast, by End-user Industry 2019 & 2032
- Table 121: Global Affective Computing Industry Revenue Million Forecast, by Country 2019 & 2032
- Table 122: Global Affective Computing Industry Volume K Unit Forecast, by Country 2019 & 2032
- Table 123: Global Affective Computing Industry Revenue Million Forecast, by Component 2019 & 2032
- Table 124: Global Affective Computing Industry Volume K Unit Forecast, by Component 2019 & 2032
- Table 125: Global Affective Computing Industry Revenue Million Forecast, by End-user Industry 2019 & 2032
- Table 126: Global Affective Computing Industry Volume K Unit Forecast, by End-user Industry 2019 & 2032
- Table 127: Global Affective Computing Industry Revenue Million Forecast, by Country 2019 & 2032
- Table 128: Global Affective Computing Industry Volume K Unit Forecast, by Country 2019 & 2032
Frequently Asked Questions
1. What is the projected Compound Annual Growth Rate (CAGR) of the Affective Computing Industry?
The projected CAGR is approximately 24.29%.
2. Which companies are prominent players in the Affective Computing Industry?
Key companies in the market include Eyesight Technologies Ltd, IBM Corporation, Nuance Communications Inc (Microsoft Corporation), Realeyes Data Services Ltd, Nemesysco Ltd, Kairos AR Inc, Affectiva Inc, Amazon Web Services Inc, audEERING GmbH, Emotibot Technologies Limited, Element Human Ltd, Gesturetek Inc.
3. What are the main segments of the Affective Computing Industry?
The market segments include Component, End-user Industry.
4. Can you provide details about the market size?
The market size is estimated to be USD 73.58 Million as of 2022.
5. What are some drivers contributing to market growth?
Increased Automation in Contact Centers; Increasing Adoption of Cloud-based Solutions and Online Solutions; Rising Technology Adoptions in Various Industries such as Automotive.
6. What are the notable trends driving market growth?
Rising Technology Adoptions in Various Industries such as Automotive.
7. Are there any restraints impacting market growth?
; High Cost of RF Power.
8. Can you provide examples of recent developments in the market?
September 2022: Nuance Communications, Inc. announced that Liberty Global expanded its use of Nuance Dragon TV for Virgin Media O2 customers in the United Kingdom. The expansion included new capabilities that provided enhanced support for visually impaired customers, such as reading aloud program information.
9. What pricing options are available for accessing the report?
Pricing options include single-user, multi-user, and enterprise licenses priced at USD 4750, USD 5250, and USD 8750 respectively.
10. Is the market size provided in terms of value or volume?
The market size is provided in terms of value, measured in Million and volume, measured in K Unit.
11. Are there any specific market keywords associated with the report?
Yes, the market keyword associated with the report is "Affective Computing Industry," which aids in identifying and referencing the specific market segment covered.
12. How do I determine which pricing option suits my needs best?
The pricing options vary based on user requirements and access needs. Individual users may opt for single-user licenses, while businesses requiring broader access may choose multi-user or enterprise licenses for cost-effective access to the report.
13. Are there any additional resources or data provided in the Affective Computing Industry report?
While the report offers comprehensive insights, it's advisable to review the specific contents or supplementary materials provided to ascertain if additional resources or data are available.
14. How can I stay updated on further developments or reports in the Affective Computing Industry?
To stay informed about further developments, trends, and reports in the Affective Computing Industry, consider subscribing to industry newsletters, following relevant companies and organizations, or regularly checking reputable industry news sources and publications.
Methodology
Step 1 - Identification of Relevant Samples Size from Population Database


Step 2 - Approaches for Defining Global Market Size (Value, Volume* & Price*)

Note*: In applicable scenarios
Step 3 - Data Sources
Primary Research
- Web Analytics
- Survey Reports
- Research Institute
- Latest Research Reports
- Opinion Leaders
Secondary Research
- Annual Reports
- White Paper
- Latest Press Release
- Industry Association
- Paid Database
- Investor Presentations

Step 4 - Data Triangulation
Involves using different sources of information in order to increase the validity of a study
These sources are likely to be stakeholders in a program - participants, other researchers, program staff, other community members, and so on.
Then we put all data in single framework & apply various statistical tools to find out the dynamic on the market.
During the analysis stage, feedback from the stakeholder groups would be compared to determine areas of agreement as well as areas of divergence
