

Key Insights
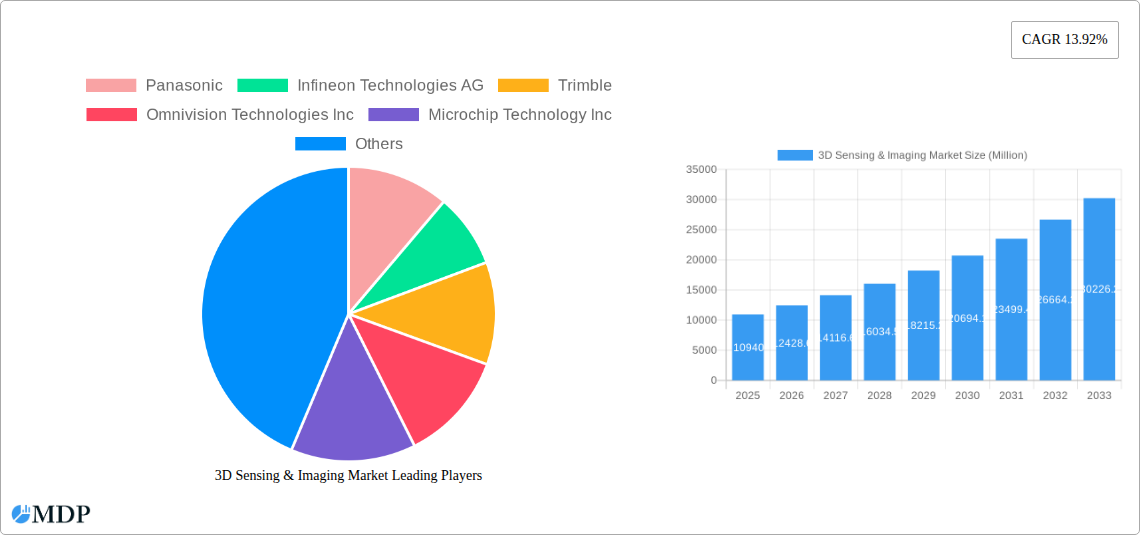
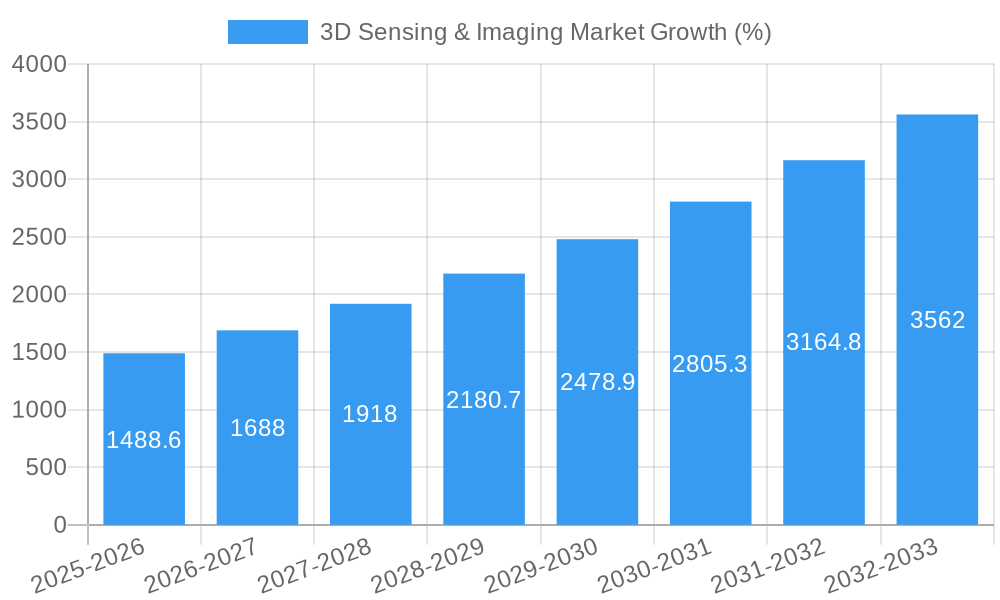
The 3D sensing and imaging market is experiencing robust growth, projected to reach a market size of $10.94 billion in 2025 and exhibiting a Compound Annual Growth Rate (CAGR) of 13.92% from 2025 to 2033. This expansion is fueled by several key drivers. The increasing adoption of advanced driver-assistance systems (ADAS) and autonomous vehicles in the automotive sector is significantly boosting demand for high-precision 3D sensing solutions. Simultaneously, the healthcare industry's reliance on 3D imaging for minimally invasive surgeries, diagnostics, and personalized medicine is driving substantial growth. Furthermore, the burgeoning consumer electronics market, particularly in smartphones and augmented/virtual reality devices, is contributing significantly to market expansion. Technological advancements, such as improvements in Time-of-Flight (ToF) and structured light technologies, are leading to more accurate, efficient, and cost-effective 3D sensing solutions, further accelerating market growth. The market is segmented by end-user industry (consumer electronics, automotive, healthcare, etc.), component (hardware, software, services), technology (ultrasound, structured light, etc.), type (position sensor, image sensor, etc.), and connectivity (wired/wireless). Major players like Panasonic, Infineon, and others are actively investing in R&D and strategic partnerships to strengthen their market position.
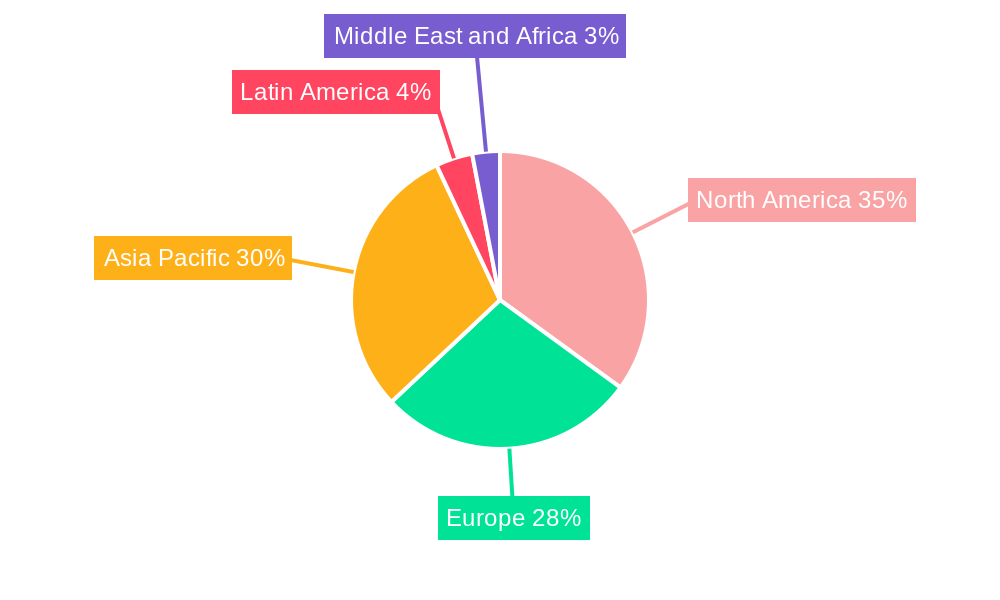
The growth trajectory is expected to continue throughout the forecast period, driven by ongoing technological innovation and expanding applications across various sectors. While challenges such as high initial costs associated with some technologies and data privacy concerns might act as temporary restraints, the overall market outlook remains extremely positive. The increasing demand for improved user experiences, enhanced safety features, and personalized services across multiple industries will continue to fuel the demand for advanced 3D sensing and imaging technologies. The Asia Pacific region is anticipated to witness significant growth, driven by rapid technological advancements and increasing adoption across various sectors in emerging economies. The North American and European markets will also contribute significantly to overall market revenue, driven by established technological infrastructure and robust consumer demand.
3D Sensing & Imaging Market Report: A Comprehensive Analysis (2019-2033)
This comprehensive report provides an in-depth analysis of the 3D Sensing & Imaging market, offering valuable insights for stakeholders across the value chain. The study period covers 2019-2033, with 2025 serving as the base and estimated year. The report forecasts market trends from 2025 to 2033, building upon historical data from 2019-2024. Key market segments, including hardware, software, services, and various technologies, are thoroughly examined, along with leading companies like Panasonic, Infineon Technologies AG, and Google. This report is essential for businesses seeking to understand the market dynamics, identify growth opportunities, and develop effective strategies within this rapidly evolving sector.
3D Sensing & Imaging Market Market Dynamics & Concentration
The 3D sensing and imaging market exhibits a moderately concentrated landscape, with a few major players holding significant market share. However, the market is also characterized by considerable innovation and the emergence of new entrants, particularly in specialized niche segments. Market concentration is influenced by factors such as technological advancements, M&A activities, and the prevalence of strong intellectual property portfolios among established players. The market share of the top 5 players is estimated at xx% in 2025, indicating a moderately consolidated market structure. Innovation drivers such as the increasing demand for automation in various industries (automotive, healthcare, consumer electronics) are pushing the market towards higher levels of sophistication and performance. Regulatory frameworks, including data privacy regulations and safety standards, play a significant role in shaping market dynamics. The presence of substitute technologies, like 2D imaging, poses a competitive challenge. However, the superior depth perception and 3D data capabilities of 3D sensing and imaging are driving its adoption. End-user trends, including the growing preference for contactless interaction and augmented/virtual reality experiences, significantly impact market growth. M&A activity in the past five years has been relatively moderate, with approximately xx deals recorded, focusing mainly on expanding product portfolios and technological capabilities.
3D Sensing & Imaging Market Industry Trends & Analysis
The 3D sensing and imaging market is experiencing robust growth, driven primarily by the increasing adoption of advanced technologies across diverse industries. The market is projected to witness a CAGR of xx% during the forecast period (2025-2033). This expansion is fueled by several key factors: technological advancements (miniaturization, improved accuracy, reduced cost), rising demand for automation in manufacturing and logistics, growth of the automotive sector (ADAS, autonomous driving), expanding healthcare applications (surgical robotics, diagnostics), and the emergence of new applications in augmented reality (AR) and virtual reality (VR). Market penetration is highest in the consumer electronics and automotive sectors. Consumer preferences are shifting towards devices with advanced 3D capabilities, driving higher demand for superior image quality and enhanced user experience. Competitive dynamics are characterized by continuous innovation, strategic partnerships, and mergers and acquisitions. The market exhibits a strong focus on developing cost-effective and energy-efficient solutions. The increasing demand for 3D sensing in emerging applications such as smart cities and robotics also contributes to market growth.
Leading Markets & Segments in 3D Sensing & Imaging Market
The North American region currently dominates the 3D sensing and imaging market due to the presence of major technology companies and robust adoption across various sectors. However, Asia-Pacific is projected to experience significant growth in the forecast period.
Key Drivers:
- Consumer Electronics: High demand for advanced features in smartphones, gaming consoles, and other consumer devices.
- Automotive: Rapid expansion of Advanced Driver-Assistance Systems (ADAS) and autonomous driving technology.
- Healthcare: Growing applications in medical imaging, surgical robotics, and patient monitoring.
- Hardware Dominance: Hardware accounts for the largest segment share due to the core role of sensors and imaging devices.
- Time-of-Flight Technology: This technology is experiencing strong growth due to its accuracy and cost-effectiveness.
Detailed Dominance Analysis:
The dominance of North America is largely attributed to the strong presence of key players in the technology sector, coupled with high levels of R&D spending and early adoption of innovative technologies. The Asia-Pacific region is anticipated to experience substantial growth fueled by increasing demand from rapidly developing economies like China and India, coupled with supportive government initiatives focusing on technological advancement and infrastructure development. The dominance of hardware is attributable to the foundational nature of sensors and imaging devices within the ecosystem. The success of time-of-flight technology stems from its balance of accuracy and affordability, making it suitable for a wide range of applications.
3D Sensing & Imaging Market Product Developments
Recent product innovations focus on miniaturization, enhanced accuracy, improved power efficiency, and wider field-of-view capabilities. New applications are emerging across industries, including robotics, industrial automation, and security systems. Companies are leveraging these advancements to gain a competitive edge through superior performance and cost-effectiveness. Technological trends indicate a shift towards AI-powered 3D sensing solutions, capable of real-time object recognition and scene understanding.
Key Drivers of 3D Sensing & Imaging Market Growth
Technological advancements, such as the development of more efficient and accurate sensors, are a primary driver. The rising demand for automation across various industries, coupled with increasing investment in R&D from major players, further accelerates growth. Favorable government policies and initiatives promoting the adoption of advanced technologies in strategic sectors, like automotive and healthcare, contribute significantly.
Challenges in the 3D Sensing & Imaging Market Market
High manufacturing costs and the complexity of integrating 3D sensing systems into existing infrastructure pose significant challenges. Supply chain disruptions and the potential for component shortages can impact production volumes and market growth. Intense competition among established players and the emergence of new entrants create a dynamic and challenging environment. These factors collectively influence the market’s trajectory and necessitate continuous innovation and adaptation.
Emerging Opportunities in 3D Sensing & Imaging Market
The development of more compact and energy-efficient 3D sensors presents significant opportunities. Strategic partnerships and collaborations among companies with complementary expertise in sensor technology, software algorithms, and end-application integration offer promising avenues for growth. Market expansion into new sectors, like the metaverse and smart cities, opens up significant potential.
Leading Players in the 3D Sensing & Imaging Market Sector
- Panasonic
- Infineon Technologies AG
- Trimble
- Omnivision Technologies Inc
- Microchip Technology Inc
- GE Healthcare
- Lockheed Martin
- Adobe
- STMicroelectronics
- Sick AG
- Faro
- Texas Instruments Incorporated
- Autodesk
- Keyence
- Dassault Systèmes
- Qualcomm Inc
Key Milestones in 3D Sensing & Imaging Market Industry
- December 2021: LIPS Corporation unveiled new LIPSedge 3D structured light cameras, targeting various industries, including smart factories and healthcare.
- January 2022: Pmdtechnologies AG launched the flexx2 3D time-of-flight development kit, offering improved depth-sensing performance.
- March 2022: LIPS Corporation and Newsight Imaging partnered to develop eTOF-based 3D vision systems for Industry 4.0 and AIoT applications.
Strategic Outlook for 3D Sensing & Imaging Market Market
The future of the 3D sensing and imaging market looks promising, driven by ongoing technological advancements, expanding applications across diverse industries, and the emergence of new market segments. Strategic partnerships and investments in R&D are expected to play a crucial role in shaping the market's future landscape. Companies focusing on innovation, cost-effectiveness, and adaptability will be best positioned to capitalize on the significant growth opportunities in this dynamic sector.
3D Sensing & Imaging Market Segmentation
-
1. Component
- 1.1. Hardware
- 1.2. Software
- 1.3. Services
-
2. Technology
- 2.1. Ultrasound
- 2.2. Structured Light
- 2.3. Time of Flight
- 2.4. Stereoscopic Vision
- 2.5. Other Technologies
-
3. Type
- 3.1. Position Sensor
- 3.2. Image Sensor
- 3.3. Temperature Sensor
- 3.4. Accelerometer Sensor
- 3.5. Proximity Sensor
- 3.6. Other Types
-
4. Connectivity
- 4.1. Wired Network Connectivity
- 4.2. Wireless Network Connectivity
-
5. End-user Industry
- 5.1. Consumer Electronics
- 5.2. Automotive
- 5.3. Healthcare
- 5.4. Aerospace and Defense
- 5.5. Security and Surveillance
- 5.6. Media and Entertainment
- 5.7. Other End-user Industries
3D Sensing & Imaging Market Segmentation By Geography
- 1. North America
- 2. Europe
- 3. Asia Pacific
- 4. Middle East and Africa
- 5. Latin America
3D Sensing & Imaging Market REPORT HIGHLIGHTS
| Aspects | Details |
|---|---|
| Study Period | 2019-2033 |
| Base Year | 2024 |
| Estimated Year | 2025 |
| Forecast Period | 2025-2033 |
| Historical Period | 2019-2024 |
| Growth Rate | CAGR of 13.92% from 2019-2033 |
| Segmentation |
|
Table of Contents
- 1. Introduction
- 1.1. Research Scope
- 1.2. Market Segmentation
- 1.3. Research Methodology
- 1.4. Definitions and Assumptions
- 2. Executive Summary
- 2.1. Introduction
- 3. Market Dynamics
- 3.1. Introduction
- 3.2. Market Drivers
- 3.2.1. Integration of Optical and Electronic Components in Miniaturized Electronics Devices; Rising Demand for 3D-Enabled Devices in Consumer Electronics; Growing Penetration of Image Sensors in Automobiles; Growing Requirement of Security and Surveillance Systems
- 3.3. Market Restrains
- 3.3.1. High Manufacturing Cost of Image Sensors; Limited Integration With Other Devices; High Cost Required for the Maintenance of these Devices
- 3.4. Market Trends
- 3.4.1. Automotive Sector Expected to Drive Market Growth
- 4. Market Factor Analysis
- 4.1. Porters Five Forces
- 4.2. Supply/Value Chain
- 4.3. PESTEL analysis
- 4.4. Market Entropy
- 4.5. Patent/Trademark Analysis
- 5. Global 3D Sensing & Imaging Market Analysis, Insights and Forecast, 2019-2031
- 5.1. Market Analysis, Insights and Forecast - by Component
- 5.1.1. Hardware
- 5.1.2. Software
- 5.1.3. Services
- 5.2. Market Analysis, Insights and Forecast - by Technology
- 5.2.1. Ultrasound
- 5.2.2. Structured Light
- 5.2.3. Time of Flight
- 5.2.4. Stereoscopic Vision
- 5.2.5. Other Technologies
- 5.3. Market Analysis, Insights and Forecast - by Type
- 5.3.1. Position Sensor
- 5.3.2. Image Sensor
- 5.3.3. Temperature Sensor
- 5.3.4. Accelerometer Sensor
- 5.3.5. Proximity Sensor
- 5.3.6. Other Types
- 5.4. Market Analysis, Insights and Forecast - by Connectivity
- 5.4.1. Wired Network Connectivity
- 5.4.2. Wireless Network Connectivity
- 5.5. Market Analysis, Insights and Forecast - by End-user Industry
- 5.5.1. Consumer Electronics
- 5.5.2. Automotive
- 5.5.3. Healthcare
- 5.5.4. Aerospace and Defense
- 5.5.5. Security and Surveillance
- 5.5.6. Media and Entertainment
- 5.5.7. Other End-user Industries
- 5.6. Market Analysis, Insights and Forecast - by Region
- 5.6.1. North America
- 5.6.2. Europe
- 5.6.3. Asia Pacific
- 5.6.4. Middle East and Africa
- 5.6.5. Latin America
- 5.1. Market Analysis, Insights and Forecast - by Component
- 6. North America 3D Sensing & Imaging Market Analysis, Insights and Forecast, 2019-2031
- 6.1. Market Analysis, Insights and Forecast - by Component
- 6.1.1. Hardware
- 6.1.2. Software
- 6.1.3. Services
- 6.2. Market Analysis, Insights and Forecast - by Technology
- 6.2.1. Ultrasound
- 6.2.2. Structured Light
- 6.2.3. Time of Flight
- 6.2.4. Stereoscopic Vision
- 6.2.5. Other Technologies
- 6.3. Market Analysis, Insights and Forecast - by Type
- 6.3.1. Position Sensor
- 6.3.2. Image Sensor
- 6.3.3. Temperature Sensor
- 6.3.4. Accelerometer Sensor
- 6.3.5. Proximity Sensor
- 6.3.6. Other Types
- 6.4. Market Analysis, Insights and Forecast - by Connectivity
- 6.4.1. Wired Network Connectivity
- 6.4.2. Wireless Network Connectivity
- 6.5. Market Analysis, Insights and Forecast - by End-user Industry
- 6.5.1. Consumer Electronics
- 6.5.2. Automotive
- 6.5.3. Healthcare
- 6.5.4. Aerospace and Defense
- 6.5.5. Security and Surveillance
- 6.5.6. Media and Entertainment
- 6.5.7. Other End-user Industries
- 6.1. Market Analysis, Insights and Forecast - by Component
- 7. Europe 3D Sensing & Imaging Market Analysis, Insights and Forecast, 2019-2031
- 7.1. Market Analysis, Insights and Forecast - by Component
- 7.1.1. Hardware
- 7.1.2. Software
- 7.1.3. Services
- 7.2. Market Analysis, Insights and Forecast - by Technology
- 7.2.1. Ultrasound
- 7.2.2. Structured Light
- 7.2.3. Time of Flight
- 7.2.4. Stereoscopic Vision
- 7.2.5. Other Technologies
- 7.3. Market Analysis, Insights and Forecast - by Type
- 7.3.1. Position Sensor
- 7.3.2. Image Sensor
- 7.3.3. Temperature Sensor
- 7.3.4. Accelerometer Sensor
- 7.3.5. Proximity Sensor
- 7.3.6. Other Types
- 7.4. Market Analysis, Insights and Forecast - by Connectivity
- 7.4.1. Wired Network Connectivity
- 7.4.2. Wireless Network Connectivity
- 7.5. Market Analysis, Insights and Forecast - by End-user Industry
- 7.5.1. Consumer Electronics
- 7.5.2. Automotive
- 7.5.3. Healthcare
- 7.5.4. Aerospace and Defense
- 7.5.5. Security and Surveillance
- 7.5.6. Media and Entertainment
- 7.5.7. Other End-user Industries
- 7.1. Market Analysis, Insights and Forecast - by Component
- 8. Asia Pacific 3D Sensing & Imaging Market Analysis, Insights and Forecast, 2019-2031
- 8.1. Market Analysis, Insights and Forecast - by Component
- 8.1.1. Hardware
- 8.1.2. Software
- 8.1.3. Services
- 8.2. Market Analysis, Insights and Forecast - by Technology
- 8.2.1. Ultrasound
- 8.2.2. Structured Light
- 8.2.3. Time of Flight
- 8.2.4. Stereoscopic Vision
- 8.2.5. Other Technologies
- 8.3. Market Analysis, Insights and Forecast - by Type
- 8.3.1. Position Sensor
- 8.3.2. Image Sensor
- 8.3.3. Temperature Sensor
- 8.3.4. Accelerometer Sensor
- 8.3.5. Proximity Sensor
- 8.3.6. Other Types
- 8.4. Market Analysis, Insights and Forecast - by Connectivity
- 8.4.1. Wired Network Connectivity
- 8.4.2. Wireless Network Connectivity
- 8.5. Market Analysis, Insights and Forecast - by End-user Industry
- 8.5.1. Consumer Electronics
- 8.5.2. Automotive
- 8.5.3. Healthcare
- 8.5.4. Aerospace and Defense
- 8.5.5. Security and Surveillance
- 8.5.6. Media and Entertainment
- 8.5.7. Other End-user Industries
- 8.1. Market Analysis, Insights and Forecast - by Component
- 9. Middle East and Africa 3D Sensing & Imaging Market Analysis, Insights and Forecast, 2019-2031
- 9.1. Market Analysis, Insights and Forecast - by Component
- 9.1.1. Hardware
- 9.1.2. Software
- 9.1.3. Services
- 9.2. Market Analysis, Insights and Forecast - by Technology
- 9.2.1. Ultrasound
- 9.2.2. Structured Light
- 9.2.3. Time of Flight
- 9.2.4. Stereoscopic Vision
- 9.2.5. Other Technologies
- 9.3. Market Analysis, Insights and Forecast - by Type
- 9.3.1. Position Sensor
- 9.3.2. Image Sensor
- 9.3.3. Temperature Sensor
- 9.3.4. Accelerometer Sensor
- 9.3.5. Proximity Sensor
- 9.3.6. Other Types
- 9.4. Market Analysis, Insights and Forecast - by Connectivity
- 9.4.1. Wired Network Connectivity
- 9.4.2. Wireless Network Connectivity
- 9.5. Market Analysis, Insights and Forecast - by End-user Industry
- 9.5.1. Consumer Electronics
- 9.5.2. Automotive
- 9.5.3. Healthcare
- 9.5.4. Aerospace and Defense
- 9.5.5. Security and Surveillance
- 9.5.6. Media and Entertainment
- 9.5.7. Other End-user Industries
- 9.1. Market Analysis, Insights and Forecast - by Component
- 10. Latin America 3D Sensing & Imaging Market Analysis, Insights and Forecast, 2019-2031
- 10.1. Market Analysis, Insights and Forecast - by Component
- 10.1.1. Hardware
- 10.1.2. Software
- 10.1.3. Services
- 10.2. Market Analysis, Insights and Forecast - by Technology
- 10.2.1. Ultrasound
- 10.2.2. Structured Light
- 10.2.3. Time of Flight
- 10.2.4. Stereoscopic Vision
- 10.2.5. Other Technologies
- 10.3. Market Analysis, Insights and Forecast - by Type
- 10.3.1. Position Sensor
- 10.3.2. Image Sensor
- 10.3.3. Temperature Sensor
- 10.3.4. Accelerometer Sensor
- 10.3.5. Proximity Sensor
- 10.3.6. Other Types
- 10.4. Market Analysis, Insights and Forecast - by Connectivity
- 10.4.1. Wired Network Connectivity
- 10.4.2. Wireless Network Connectivity
- 10.5. Market Analysis, Insights and Forecast - by End-user Industry
- 10.5.1. Consumer Electronics
- 10.5.2. Automotive
- 10.5.3. Healthcare
- 10.5.4. Aerospace and Defense
- 10.5.5. Security and Surveillance
- 10.5.6. Media and Entertainment
- 10.5.7. Other End-user Industries
- 10.1. Market Analysis, Insights and Forecast - by Component
- 11. North America 3D Sensing & Imaging Market Analysis, Insights and Forecast, 2019-2031
- 11.1. Market Analysis, Insights and Forecast - By Country/Sub-region
- 11.1.1.
- 12. Europe 3D Sensing & Imaging Market Analysis, Insights and Forecast, 2019-2031
- 12.1. Market Analysis, Insights and Forecast - By Country/Sub-region
- 12.1.1.
- 13. Asia Pacific 3D Sensing & Imaging Market Analysis, Insights and Forecast, 2019-2031
- 13.1. Market Analysis, Insights and Forecast - By Country/Sub-region
- 13.1.1.
- 14. Latin America 3D Sensing & Imaging Market Analysis, Insights and Forecast, 2019-2031
- 14.1. Market Analysis, Insights and Forecast - By Country/Sub-region
- 14.1.1.
- 15. Middle East and Africa 3D Sensing & Imaging Market Analysis, Insights and Forecast, 2019-2031
- 15.1. Market Analysis, Insights and Forecast - By Country/Sub-region
- 15.1.1.
- 16. Competitive Analysis
- 16.1. Global Market Share Analysis 2024
- 16.2. Company Profiles
- 16.2.1 Panasonic
- 16.2.1.1. Overview
- 16.2.1.2. Products
- 16.2.1.3. SWOT Analysis
- 16.2.1.4. Recent Developments
- 16.2.1.5. Financials (Based on Availability)
- 16.2.2 Infineon Technologies AG
- 16.2.2.1. Overview
- 16.2.2.2. Products
- 16.2.2.3. SWOT Analysis
- 16.2.2.4. Recent Developments
- 16.2.2.5. Financials (Based on Availability)
- 16.2.3 Trimble
- 16.2.3.1. Overview
- 16.2.3.2. Products
- 16.2.3.3. SWOT Analysis
- 16.2.3.4. Recent Developments
- 16.2.3.5. Financials (Based on Availability)
- 16.2.4 Omnivision Technologies Inc
- 16.2.4.1. Overview
- 16.2.4.2. Products
- 16.2.4.3. SWOT Analysis
- 16.2.4.4. Recent Developments
- 16.2.4.5. Financials (Based on Availability)
- 16.2.5 Microchip Technology Inc
- 16.2.5.1. Overview
- 16.2.5.2. Products
- 16.2.5.3. SWOT Analysis
- 16.2.5.4. Recent Developments
- 16.2.5.5. Financials (Based on Availability)
- 16.2.6 GE Healthcare
- 16.2.6.1. Overview
- 16.2.6.2. Products
- 16.2.6.3. SWOT Analysis
- 16.2.6.4. Recent Developments
- 16.2.6.5. Financials (Based on Availability)
- 16.2.7 Lockheed Martin
- 16.2.7.1. Overview
- 16.2.7.2. Products
- 16.2.7.3. SWOT Analysis
- 16.2.7.4. Recent Developments
- 16.2.7.5. Financials (Based on Availability)
- 16.2.8 Adobe
- 16.2.8.1. Overview
- 16.2.8.2. Products
- 16.2.8.3. SWOT Analysis
- 16.2.8.4. Recent Developments
- 16.2.8.5. Financials (Based on Availability)
- 16.2.9 STMicroelectronics
- 16.2.9.1. Overview
- 16.2.9.2. Products
- 16.2.9.3. SWOT Analysis
- 16.2.9.4. Recent Developments
- 16.2.9.5. Financials (Based on Availability)
- 16.2.10 Google
- 16.2.10.1. Overview
- 16.2.10.2. Products
- 16.2.10.3. SWOT Analysis
- 16.2.10.4. Recent Developments
- 16.2.10.5. Financials (Based on Availability)
- 16.2.11 Sick AG
- 16.2.11.1. Overview
- 16.2.11.2. Products
- 16.2.11.3. SWOT Analysis
- 16.2.11.4. Recent Developments
- 16.2.11.5. Financials (Based on Availability)
- 16.2.12 Faro
- 16.2.12.1. Overview
- 16.2.12.2. Products
- 16.2.12.3. SWOT Analysis
- 16.2.12.4. Recent Developments
- 16.2.12.5. Financials (Based on Availability)
- 16.2.13 Texas Instruments Incorporated
- 16.2.13.1. Overview
- 16.2.13.2. Products
- 16.2.13.3. SWOT Analysis
- 16.2.13.4. Recent Developments
- 16.2.13.5. Financials (Based on Availability)
- 16.2.14 Autodesk
- 16.2.14.1. Overview
- 16.2.14.2. Products
- 16.2.14.3. SWOT Analysis
- 16.2.14.4. Recent Developments
- 16.2.14.5. Financials (Based on Availability)
- 16.2.15 Keyence
- 16.2.15.1. Overview
- 16.2.15.2. Products
- 16.2.15.3. SWOT Analysis
- 16.2.15.4. Recent Developments
- 16.2.15.5. Financials (Based on Availability)
- 16.2.16 Dassault Systems*List Not Exhaustive
- 16.2.16.1. Overview
- 16.2.16.2. Products
- 16.2.16.3. SWOT Analysis
- 16.2.16.4. Recent Developments
- 16.2.16.5. Financials (Based on Availability)
- 16.2.17 Qualcomm Inc
- 16.2.17.1. Overview
- 16.2.17.2. Products
- 16.2.17.3. SWOT Analysis
- 16.2.17.4. Recent Developments
- 16.2.17.5. Financials (Based on Availability)
- 16.2.1 Panasonic
List of Figures
- Figure 1: Global 3D Sensing & Imaging Market Revenue Breakdown (Million, %) by Region 2024 & 2032
- Figure 2: North America 3D Sensing & Imaging Market Revenue (Million), by Country 2024 & 2032
- Figure 3: North America 3D Sensing & Imaging Market Revenue Share (%), by Country 2024 & 2032
- Figure 4: Europe 3D Sensing & Imaging Market Revenue (Million), by Country 2024 & 2032
- Figure 5: Europe 3D Sensing & Imaging Market Revenue Share (%), by Country 2024 & 2032
- Figure 6: Asia Pacific 3D Sensing & Imaging Market Revenue (Million), by Country 2024 & 2032
- Figure 7: Asia Pacific 3D Sensing & Imaging Market Revenue Share (%), by Country 2024 & 2032
- Figure 8: Latin America 3D Sensing & Imaging Market Revenue (Million), by Country 2024 & 2032
- Figure 9: Latin America 3D Sensing & Imaging Market Revenue Share (%), by Country 2024 & 2032
- Figure 10: Middle East and Africa 3D Sensing & Imaging Market Revenue (Million), by Country 2024 & 2032
- Figure 11: Middle East and Africa 3D Sensing & Imaging Market Revenue Share (%), by Country 2024 & 2032
- Figure 12: North America 3D Sensing & Imaging Market Revenue (Million), by Component 2024 & 2032
- Figure 13: North America 3D Sensing & Imaging Market Revenue Share (%), by Component 2024 & 2032
- Figure 14: North America 3D Sensing & Imaging Market Revenue (Million), by Technology 2024 & 2032
- Figure 15: North America 3D Sensing & Imaging Market Revenue Share (%), by Technology 2024 & 2032
- Figure 16: North America 3D Sensing & Imaging Market Revenue (Million), by Type 2024 & 2032
- Figure 17: North America 3D Sensing & Imaging Market Revenue Share (%), by Type 2024 & 2032
- Figure 18: North America 3D Sensing & Imaging Market Revenue (Million), by Connectivity 2024 & 2032
- Figure 19: North America 3D Sensing & Imaging Market Revenue Share (%), by Connectivity 2024 & 2032
- Figure 20: North America 3D Sensing & Imaging Market Revenue (Million), by End-user Industry 2024 & 2032
- Figure 21: North America 3D Sensing & Imaging Market Revenue Share (%), by End-user Industry 2024 & 2032
- Figure 22: North America 3D Sensing & Imaging Market Revenue (Million), by Country 2024 & 2032
- Figure 23: North America 3D Sensing & Imaging Market Revenue Share (%), by Country 2024 & 2032
- Figure 24: Europe 3D Sensing & Imaging Market Revenue (Million), by Component 2024 & 2032
- Figure 25: Europe 3D Sensing & Imaging Market Revenue Share (%), by Component 2024 & 2032
- Figure 26: Europe 3D Sensing & Imaging Market Revenue (Million), by Technology 2024 & 2032
- Figure 27: Europe 3D Sensing & Imaging Market Revenue Share (%), by Technology 2024 & 2032
- Figure 28: Europe 3D Sensing & Imaging Market Revenue (Million), by Type 2024 & 2032
- Figure 29: Europe 3D Sensing & Imaging Market Revenue Share (%), by Type 2024 & 2032
- Figure 30: Europe 3D Sensing & Imaging Market Revenue (Million), by Connectivity 2024 & 2032
- Figure 31: Europe 3D Sensing & Imaging Market Revenue Share (%), by Connectivity 2024 & 2032
- Figure 32: Europe 3D Sensing & Imaging Market Revenue (Million), by End-user Industry 2024 & 2032
- Figure 33: Europe 3D Sensing & Imaging Market Revenue Share (%), by End-user Industry 2024 & 2032
- Figure 34: Europe 3D Sensing & Imaging Market Revenue (Million), by Country 2024 & 2032
- Figure 35: Europe 3D Sensing & Imaging Market Revenue Share (%), by Country 2024 & 2032
- Figure 36: Asia Pacific 3D Sensing & Imaging Market Revenue (Million), by Component 2024 & 2032
- Figure 37: Asia Pacific 3D Sensing & Imaging Market Revenue Share (%), by Component 2024 & 2032
- Figure 38: Asia Pacific 3D Sensing & Imaging Market Revenue (Million), by Technology 2024 & 2032
- Figure 39: Asia Pacific 3D Sensing & Imaging Market Revenue Share (%), by Technology 2024 & 2032
- Figure 40: Asia Pacific 3D Sensing & Imaging Market Revenue (Million), by Type 2024 & 2032
- Figure 41: Asia Pacific 3D Sensing & Imaging Market Revenue Share (%), by Type 2024 & 2032
- Figure 42: Asia Pacific 3D Sensing & Imaging Market Revenue (Million), by Connectivity 2024 & 2032
- Figure 43: Asia Pacific 3D Sensing & Imaging Market Revenue Share (%), by Connectivity 2024 & 2032
- Figure 44: Asia Pacific 3D Sensing & Imaging Market Revenue (Million), by End-user Industry 2024 & 2032
- Figure 45: Asia Pacific 3D Sensing & Imaging Market Revenue Share (%), by End-user Industry 2024 & 2032
- Figure 46: Asia Pacific 3D Sensing & Imaging Market Revenue (Million), by Country 2024 & 2032
- Figure 47: Asia Pacific 3D Sensing & Imaging Market Revenue Share (%), by Country 2024 & 2032
- Figure 48: Middle East and Africa 3D Sensing & Imaging Market Revenue (Million), by Component 2024 & 2032
- Figure 49: Middle East and Africa 3D Sensing & Imaging Market Revenue Share (%), by Component 2024 & 2032
- Figure 50: Middle East and Africa 3D Sensing & Imaging Market Revenue (Million), by Technology 2024 & 2032
- Figure 51: Middle East and Africa 3D Sensing & Imaging Market Revenue Share (%), by Technology 2024 & 2032
- Figure 52: Middle East and Africa 3D Sensing & Imaging Market Revenue (Million), by Type 2024 & 2032
- Figure 53: Middle East and Africa 3D Sensing & Imaging Market Revenue Share (%), by Type 2024 & 2032
- Figure 54: Middle East and Africa 3D Sensing & Imaging Market Revenue (Million), by Connectivity 2024 & 2032
- Figure 55: Middle East and Africa 3D Sensing & Imaging Market Revenue Share (%), by Connectivity 2024 & 2032
- Figure 56: Middle East and Africa 3D Sensing & Imaging Market Revenue (Million), by End-user Industry 2024 & 2032
- Figure 57: Middle East and Africa 3D Sensing & Imaging Market Revenue Share (%), by End-user Industry 2024 & 2032
- Figure 58: Middle East and Africa 3D Sensing & Imaging Market Revenue (Million), by Country 2024 & 2032
- Figure 59: Middle East and Africa 3D Sensing & Imaging Market Revenue Share (%), by Country 2024 & 2032
- Figure 60: Latin America 3D Sensing & Imaging Market Revenue (Million), by Component 2024 & 2032
- Figure 61: Latin America 3D Sensing & Imaging Market Revenue Share (%), by Component 2024 & 2032
- Figure 62: Latin America 3D Sensing & Imaging Market Revenue (Million), by Technology 2024 & 2032
- Figure 63: Latin America 3D Sensing & Imaging Market Revenue Share (%), by Technology 2024 & 2032
- Figure 64: Latin America 3D Sensing & Imaging Market Revenue (Million), by Type 2024 & 2032
- Figure 65: Latin America 3D Sensing & Imaging Market Revenue Share (%), by Type 2024 & 2032
- Figure 66: Latin America 3D Sensing & Imaging Market Revenue (Million), by Connectivity 2024 & 2032
- Figure 67: Latin America 3D Sensing & Imaging Market Revenue Share (%), by Connectivity 2024 & 2032
- Figure 68: Latin America 3D Sensing & Imaging Market Revenue (Million), by End-user Industry 2024 & 2032
- Figure 69: Latin America 3D Sensing & Imaging Market Revenue Share (%), by End-user Industry 2024 & 2032
- Figure 70: Latin America 3D Sensing & Imaging Market Revenue (Million), by Country 2024 & 2032
- Figure 71: Latin America 3D Sensing & Imaging Market Revenue Share (%), by Country 2024 & 2032
List of Tables
- Table 1: Global 3D Sensing & Imaging Market Revenue Million Forecast, by Region 2019 & 2032
- Table 2: Global 3D Sensing & Imaging Market Revenue Million Forecast, by Component 2019 & 2032
- Table 3: Global 3D Sensing & Imaging Market Revenue Million Forecast, by Technology 2019 & 2032
- Table 4: Global 3D Sensing & Imaging Market Revenue Million Forecast, by Type 2019 & 2032
- Table 5: Global 3D Sensing & Imaging Market Revenue Million Forecast, by Connectivity 2019 & 2032
- Table 6: Global 3D Sensing & Imaging Market Revenue Million Forecast, by End-user Industry 2019 & 2032
- Table 7: Global 3D Sensing & Imaging Market Revenue Million Forecast, by Region 2019 & 2032
- Table 8: Global 3D Sensing & Imaging Market Revenue Million Forecast, by Country 2019 & 2032
- Table 9: 3D Sensing & Imaging Market Revenue (Million) Forecast, by Application 2019 & 2032
- Table 10: Global 3D Sensing & Imaging Market Revenue Million Forecast, by Country 2019 & 2032
- Table 11: 3D Sensing & Imaging Market Revenue (Million) Forecast, by Application 2019 & 2032
- Table 12: Global 3D Sensing & Imaging Market Revenue Million Forecast, by Country 2019 & 2032
- Table 13: 3D Sensing & Imaging Market Revenue (Million) Forecast, by Application 2019 & 2032
- Table 14: Global 3D Sensing & Imaging Market Revenue Million Forecast, by Country 2019 & 2032
- Table 15: 3D Sensing & Imaging Market Revenue (Million) Forecast, by Application 2019 & 2032
- Table 16: Global 3D Sensing & Imaging Market Revenue Million Forecast, by Country 2019 & 2032
- Table 17: 3D Sensing & Imaging Market Revenue (Million) Forecast, by Application 2019 & 2032
- Table 18: Global 3D Sensing & Imaging Market Revenue Million Forecast, by Component 2019 & 2032
- Table 19: Global 3D Sensing & Imaging Market Revenue Million Forecast, by Technology 2019 & 2032
- Table 20: Global 3D Sensing & Imaging Market Revenue Million Forecast, by Type 2019 & 2032
- Table 21: Global 3D Sensing & Imaging Market Revenue Million Forecast, by Connectivity 2019 & 2032
- Table 22: Global 3D Sensing & Imaging Market Revenue Million Forecast, by End-user Industry 2019 & 2032
- Table 23: Global 3D Sensing & Imaging Market Revenue Million Forecast, by Country 2019 & 2032
- Table 24: Global 3D Sensing & Imaging Market Revenue Million Forecast, by Component 2019 & 2032
- Table 25: Global 3D Sensing & Imaging Market Revenue Million Forecast, by Technology 2019 & 2032
- Table 26: Global 3D Sensing & Imaging Market Revenue Million Forecast, by Type 2019 & 2032
- Table 27: Global 3D Sensing & Imaging Market Revenue Million Forecast, by Connectivity 2019 & 2032
- Table 28: Global 3D Sensing & Imaging Market Revenue Million Forecast, by End-user Industry 2019 & 2032
- Table 29: Global 3D Sensing & Imaging Market Revenue Million Forecast, by Country 2019 & 2032
- Table 30: Global 3D Sensing & Imaging Market Revenue Million Forecast, by Component 2019 & 2032
- Table 31: Global 3D Sensing & Imaging Market Revenue Million Forecast, by Technology 2019 & 2032
- Table 32: Global 3D Sensing & Imaging Market Revenue Million Forecast, by Type 2019 & 2032
- Table 33: Global 3D Sensing & Imaging Market Revenue Million Forecast, by Connectivity 2019 & 2032
- Table 34: Global 3D Sensing & Imaging Market Revenue Million Forecast, by End-user Industry 2019 & 2032
- Table 35: Global 3D Sensing & Imaging Market Revenue Million Forecast, by Country 2019 & 2032
- Table 36: Global 3D Sensing & Imaging Market Revenue Million Forecast, by Component 2019 & 2032
- Table 37: Global 3D Sensing & Imaging Market Revenue Million Forecast, by Technology 2019 & 2032
- Table 38: Global 3D Sensing & Imaging Market Revenue Million Forecast, by Type 2019 & 2032
- Table 39: Global 3D Sensing & Imaging Market Revenue Million Forecast, by Connectivity 2019 & 2032
- Table 40: Global 3D Sensing & Imaging Market Revenue Million Forecast, by End-user Industry 2019 & 2032
- Table 41: Global 3D Sensing & Imaging Market Revenue Million Forecast, by Country 2019 & 2032
- Table 42: Global 3D Sensing & Imaging Market Revenue Million Forecast, by Component 2019 & 2032
- Table 43: Global 3D Sensing & Imaging Market Revenue Million Forecast, by Technology 2019 & 2032
- Table 44: Global 3D Sensing & Imaging Market Revenue Million Forecast, by Type 2019 & 2032
- Table 45: Global 3D Sensing & Imaging Market Revenue Million Forecast, by Connectivity 2019 & 2032
- Table 46: Global 3D Sensing & Imaging Market Revenue Million Forecast, by End-user Industry 2019 & 2032
- Table 47: Global 3D Sensing & Imaging Market Revenue Million Forecast, by Country 2019 & 2032
Frequently Asked Questions
1. What is the projected Compound Annual Growth Rate (CAGR) of the 3D Sensing & Imaging Market?
The projected CAGR is approximately 13.92%.
2. Which companies are prominent players in the 3D Sensing & Imaging Market?
Key companies in the market include Panasonic, Infineon Technologies AG, Trimble, Omnivision Technologies Inc, Microchip Technology Inc, GE Healthcare, Lockheed Martin, Adobe, STMicroelectronics, Google, Sick AG, Faro, Texas Instruments Incorporated, Autodesk, Keyence, Dassault Systems*List Not Exhaustive, Qualcomm Inc.
3. What are the main segments of the 3D Sensing & Imaging Market?
The market segments include Component, Technology, Type, Connectivity, End-user Industry.
4. Can you provide details about the market size?
The market size is estimated to be USD 10.94 Million as of 2022.
5. What are some drivers contributing to market growth?
Integration of Optical and Electronic Components in Miniaturized Electronics Devices; Rising Demand for 3D-Enabled Devices in Consumer Electronics; Growing Penetration of Image Sensors in Automobiles; Growing Requirement of Security and Surveillance Systems.
6. What are the notable trends driving market growth?
Automotive Sector Expected to Drive Market Growth.
7. Are there any restraints impacting market growth?
High Manufacturing Cost of Image Sensors; Limited Integration With Other Devices; High Cost Required for the Maintenance of these Devices.
8. Can you provide examples of recent developments in the market?
March 2022 - LIPS Corporation and Newsight Imaging signed a Memorandum of Understanding (MoU) to develop, promote, and facilitate eTOF (enhanced-Time-Of-Flight) based 3D vision systems for industry 4.0 usage-cases and AIoT.
9. What pricing options are available for accessing the report?
Pricing options include single-user, multi-user, and enterprise licenses priced at USD 4750, USD 5250, and USD 8750 respectively.
10. Is the market size provided in terms of value or volume?
The market size is provided in terms of value, measured in Million.
11. Are there any specific market keywords associated with the report?
Yes, the market keyword associated with the report is "3D Sensing & Imaging Market," which aids in identifying and referencing the specific market segment covered.
12. How do I determine which pricing option suits my needs best?
The pricing options vary based on user requirements and access needs. Individual users may opt for single-user licenses, while businesses requiring broader access may choose multi-user or enterprise licenses for cost-effective access to the report.
13. Are there any additional resources or data provided in the 3D Sensing & Imaging Market report?
While the report offers comprehensive insights, it's advisable to review the specific contents or supplementary materials provided to ascertain if additional resources or data are available.
14. How can I stay updated on further developments or reports in the 3D Sensing & Imaging Market?
To stay informed about further developments, trends, and reports in the 3D Sensing & Imaging Market, consider subscribing to industry newsletters, following relevant companies and organizations, or regularly checking reputable industry news sources and publications.
Methodology
Step 1 - Identification of Relevant Samples Size from Population Database


Step 2 - Approaches for Defining Global Market Size (Value, Volume* & Price*)

Note*: In applicable scenarios
Step 3 - Data Sources
Primary Research
- Web Analytics
- Survey Reports
- Research Institute
- Latest Research Reports
- Opinion Leaders
Secondary Research
- Annual Reports
- White Paper
- Latest Press Release
- Industry Association
- Paid Database
- Investor Presentations

Step 4 - Data Triangulation
Involves using different sources of information in order to increase the validity of a study
These sources are likely to be stakeholders in a program - participants, other researchers, program staff, other community members, and so on.
Then we put all data in single framework & apply various statistical tools to find out the dynamic on the market.
During the analysis stage, feedback from the stakeholder groups would be compared to determine areas of agreement as well as areas of divergence
