

Key Insights
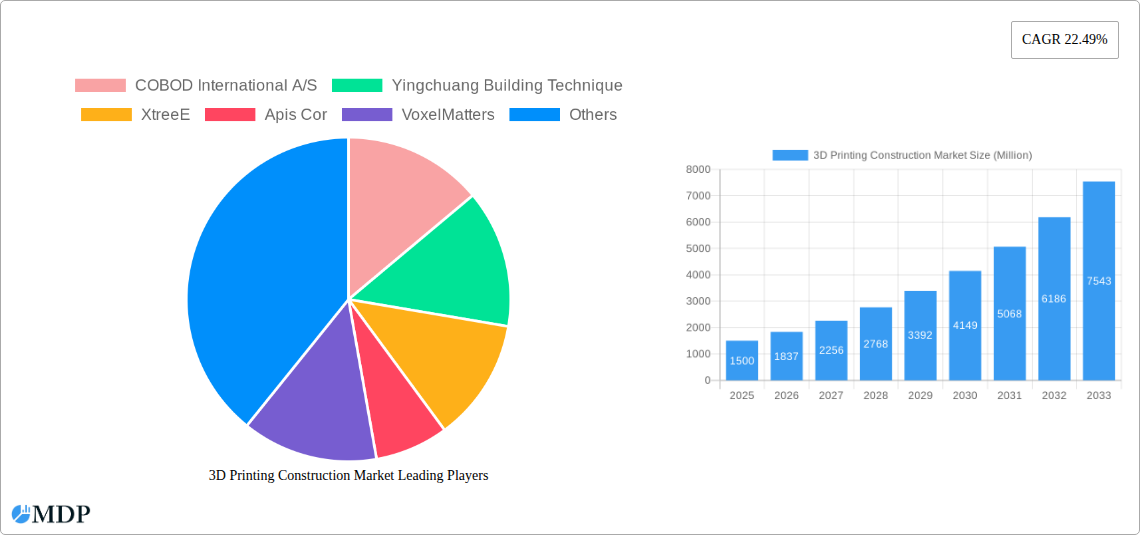
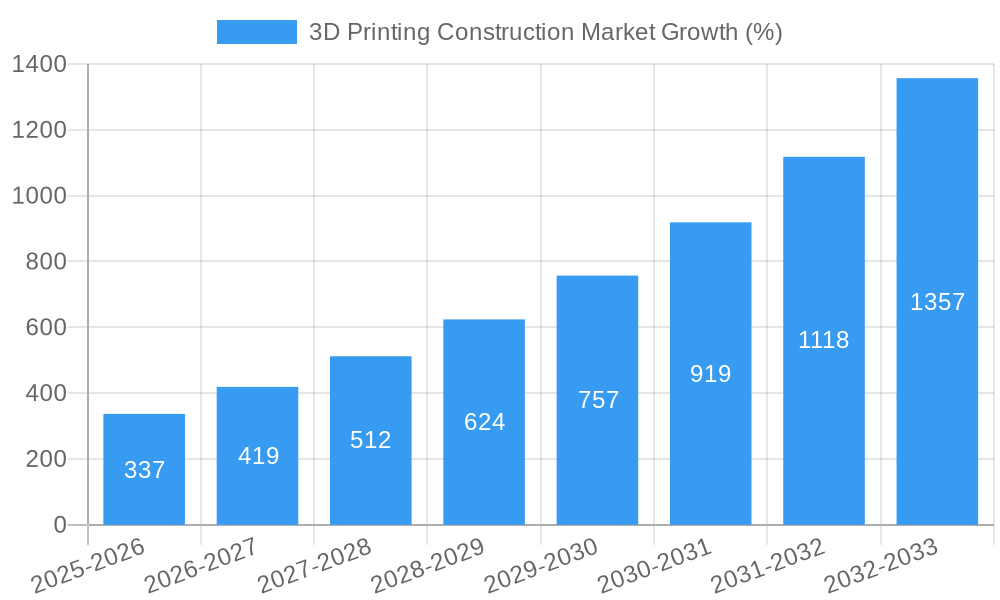
The 3D printing construction market is experiencing rapid growth, projected to reach a market size of $1.5 billion in 2025 and exhibiting a Compound Annual Growth Rate (CAGR) of 22.49% from 2025 to 2033. This expansion is driven by several key factors. Increasing demand for faster construction timelines, reduced labor costs, and the ability to create complex architectural designs are major catalysts. The adoption of sustainable building practices is also fueling market growth, as 3D printing offers opportunities for material efficiency and waste reduction. Furthermore, technological advancements in 3D printing technology, including the development of stronger, more versatile materials and more efficient printing processes, are contributing to market expansion. Key players like COBOD International A/S, Yingchuang Building Technique, and XtreeE are at the forefront of innovation, continuously improving the speed, scalability, and affordability of 3D printed construction.
However, the market also faces certain challenges. High initial investment costs for 3D printing equipment and a lack of skilled labor to operate and maintain the technology represent significant barriers to entry. Regulatory hurdles and building codes that may not yet fully accommodate 3D-printed structures also pose limitations. Despite these constraints, the overall trajectory of the market remains strongly positive. As technology matures, costs decrease, and regulatory frameworks adapt, the widespread adoption of 3D printing in construction is expected to accelerate significantly throughout the forecast period. The market will likely see increased diversification of materials used, expansion into new geographical regions, and the emergence of innovative applications beyond residential and commercial buildings, such as infrastructure development.
3D Printing Construction Market Report: 2019-2033
This comprehensive report provides a detailed analysis of the 3D Printing Construction Market, offering invaluable insights for industry stakeholders, investors, and researchers. Covering the period 2019-2033, with a focus on 2025, this report projects a market valued at xx Million by 2033, driven by technological advancements and increasing adoption across various construction segments. Discover key trends, challenges, and opportunities shaping this rapidly evolving market.
3D Printing Construction Market Dynamics & Concentration
The 3D printing construction market is characterized by a moderately concentrated landscape, with a few major players holding significant market share. However, the market is witnessing increased competition from both established construction companies and emerging technology startups. Innovation is a key driver, with continuous advancements in printing materials, software, and hardware. Favorable regulatory frameworks in certain regions are accelerating adoption, while stringent building codes in others pose challenges. Product substitutes, such as traditional construction methods, remain a competitive force, although 3D printing’s unique advantages in speed, customization, and reduced waste are gradually shifting the balance. End-user trends toward sustainable and efficient construction are further fueling market growth. M&A activity is on the rise, indicating consolidation and expansion within the industry.
- Market Concentration: The top 5 players hold approximately xx% of the market share in 2025.
- M&A Activity: A total of xx M&A deals were recorded between 2019 and 2024.
- Innovation Drivers: Advancements in materials science, robotic automation, and software algorithms.
- Regulatory Landscape: Varying building codes and approvals across different regions.
- Product Substitutes: Traditional construction methods, prefabricated structures.
3D Printing Construction Market Industry Trends & Analysis
The 3D printing construction market is experiencing robust growth, projected to achieve a CAGR of xx% during the forecast period (2025-2033). This growth is fueled by several key factors, including the increasing demand for efficient and sustainable construction solutions, the rising adoption of digital technologies in the construction sector, and the growing need for customized building designs. Technological disruptions, such as the development of advanced printing materials and robotic systems, are further accelerating market expansion. Consumer preferences are shifting towards sustainable and cost-effective construction methods, aligning with the benefits offered by 3D printing. Competitive dynamics are characterized by both collaboration and competition, with companies actively seeking strategic partnerships and acquisitions to strengthen their market position. Market penetration is expected to reach xx% by 2033.
Leading Markets & Segments in 3D Printing Construction Market
The North American region currently dominates the 3D printing construction market, driven by high infrastructure spending, early adoption of advanced technologies, and supportive government policies. However, significant growth potential exists in emerging economies, particularly in Asia-Pacific, due to rapid urbanization and increasing demand for affordable housing.
- Key Drivers for North America:
- High infrastructure investment and government support for innovation.
- Strong presence of leading technology companies and research institutions.
- Increased focus on sustainable and efficient construction practices.
- Key Drivers for Asia-Pacific:
- Rapid urbanization and growing housing demand.
- Cost-effectiveness of 3D printing for large-scale projects.
- Government initiatives promoting technological advancement in construction.
The residential segment currently holds the largest market share, followed by infrastructure and commercial projects. The increasing demand for personalized homes and the cost-effectiveness of 3D printing for constructing multi-unit housing are contributing to this dominance.
3D Printing Construction Market Product Developments
Recent product developments in 3D printing construction have focused on enhancing printing speed, material versatility, and overall construction efficiency. Innovations include the development of high-performance concrete mixes, improved software for design and simulation, and the integration of robotics for autonomous printing processes. These advancements are enabling the construction of more complex and larger-scale structures, expanding the applicability of 3D printing in the construction sector. This has led to increased market competitiveness with companies focusing on developing unique value propositions.
Key Drivers of 3D Printing Construction Market Growth
Several key factors are driving the growth of the 3D printing construction market. Technological advancements, such as the development of new materials and printing techniques, are significantly enhancing the efficiency and precision of 3D printing construction processes. Economic factors, like the rising cost of labor and materials, are making 3D printing a more attractive and cost-effective alternative. Supportive government policies and regulations are further encouraging the adoption of this technology. For instance, tax incentives and grants are driving adoption in several regions.
Challenges in the 3D Printing Construction Market
The 3D printing construction market faces several challenges hindering widespread adoption. Regulatory hurdles, including building codes and safety standards, can limit the implementation of 3D-printed structures. Supply chain disruptions and the availability of specialized materials can impact production and project timelines. Competition from traditional construction methods and the need for skilled labor to operate and maintain 3D printing equipment also pose significant obstacles. These issues collectively could reduce market penetration by an estimated xx% by 2030.
Emerging Opportunities in 3D Printing Construction Market
Several emerging opportunities are expected to drive long-term growth in the 3D printing construction market. Technological breakthroughs, such as the development of new materials and printing technologies, will create new applications and opportunities for construction companies. Strategic partnerships between technology providers and construction firms are facilitating innovation and market expansion. The increasing demand for sustainable and efficient construction solutions will further propel market growth. Expansion into new geographical markets, particularly in developing countries, represents a significant opportunity for companies.
Leading Players in the 3D Printing Construction Market Sector
- COBOD International A/S
- Yingchuang Building Technique
- XtreeE
- Apis Cor
- VoxelMatters
- Make3d in
- AJAX Engineering
- RIC Technology
- Holcim
- Sika
Key Milestones in 3D Printing Construction Market Industry
- July 2024: Inauguration of Kerala's first Concrete 3D Printer Lab by Tvasta Manufacturing Solutions, in collaboration with Saintgits College of Engineering. This significantly boosts research and development in the region.
- March 2024: ICON's launch of a suite of innovative products, including a robotic printer for multi-story constructions, a low-carbon building material, and an AI Architect, significantly advances large-scale 3D printing capabilities.
Strategic Outlook for 3D Printing Construction Market Market
The 3D printing construction market holds immense future potential. Continued technological advancements, strategic collaborations, and government support will drive substantial market growth in the coming years. Focusing on sustainable construction practices and expanding into new geographical markets will be crucial for companies to capitalize on the emerging opportunities. The market is poised for significant expansion, offering promising prospects for both established players and new entrants.
3D Printing Construction Market Segmentation
-
1. Method
- 1.1. Extrusion
- 1.2. Powder Bonding
- 1.3. Other Methods
-
2. Material Type
- 2.1. Concrete
- 2.2. Metal
- 2.3. Composite
-
3. End User Industry
- 3.1. Commercial
- 3.2. Residential
- 3.3. Industrial
3D Printing Construction Market Segmentation By Geography
- 1. North America
- 2. Europe
- 3. Asia
- 4. Australia and New Zealand
- 5. Latin America
- 6. Middle East and Africa

3D Printing Construction Market REPORT HIGHLIGHTS
| Aspects | Details |
|---|---|
| Study Period | 2019-2033 |
| Base Year | 2024 |
| Estimated Year | 2025 |
| Forecast Period | 2025-2033 |
| Historical Period | 2019-2024 |
| Growth Rate | CAGR of 22.49% from 2019-2033 |
| Segmentation |
|
Table of Contents
- 1. Introduction
- 1.1. Research Scope
- 1.2. Market Segmentation
- 1.3. Research Methodology
- 1.4. Definitions and Assumptions
- 2. Executive Summary
- 2.1. Introduction
- 3. Market Dynamics
- 3.1. Introduction
- 3.2. Market Drivers
- 3.2.1. Rising Demand for Affordable Housing; Growing Shift Towards Sustainable Construction
- 3.3. Market Restrains
- 3.3.1. Rising Demand for Affordable Housing; Growing Shift Towards Sustainable Construction
- 3.4. Market Trends
- 3.4.1. Residential Segment is Expected to Observe Significant Market Share
- 4. Market Factor Analysis
- 4.1. Porters Five Forces
- 4.2. Supply/Value Chain
- 4.3. PESTEL analysis
- 4.4. Market Entropy
- 4.5. Patent/Trademark Analysis
- 5. Global 3D Printing Construction Market Analysis, Insights and Forecast, 2019-2031
- 5.1. Market Analysis, Insights and Forecast - by Method
- 5.1.1. Extrusion
- 5.1.2. Powder Bonding
- 5.1.3. Other Methods
- 5.2. Market Analysis, Insights and Forecast - by Material Type
- 5.2.1. Concrete
- 5.2.2. Metal
- 5.2.3. Composite
- 5.3. Market Analysis, Insights and Forecast - by End User Industry
- 5.3.1. Commercial
- 5.3.2. Residential
- 5.3.3. Industrial
- 5.4. Market Analysis, Insights and Forecast - by Region
- 5.4.1. North America
- 5.4.2. Europe
- 5.4.3. Asia
- 5.4.4. Australia and New Zealand
- 5.4.5. Latin America
- 5.4.6. Middle East and Africa
- 5.1. Market Analysis, Insights and Forecast - by Method
- 6. North America 3D Printing Construction Market Analysis, Insights and Forecast, 2019-2031
- 6.1. Market Analysis, Insights and Forecast - by Method
- 6.1.1. Extrusion
- 6.1.2. Powder Bonding
- 6.1.3. Other Methods
- 6.2. Market Analysis, Insights and Forecast - by Material Type
- 6.2.1. Concrete
- 6.2.2. Metal
- 6.2.3. Composite
- 6.3. Market Analysis, Insights and Forecast - by End User Industry
- 6.3.1. Commercial
- 6.3.2. Residential
- 6.3.3. Industrial
- 6.1. Market Analysis, Insights and Forecast - by Method
- 7. Europe 3D Printing Construction Market Analysis, Insights and Forecast, 2019-2031
- 7.1. Market Analysis, Insights and Forecast - by Method
- 7.1.1. Extrusion
- 7.1.2. Powder Bonding
- 7.1.3. Other Methods
- 7.2. Market Analysis, Insights and Forecast - by Material Type
- 7.2.1. Concrete
- 7.2.2. Metal
- 7.2.3. Composite
- 7.3. Market Analysis, Insights and Forecast - by End User Industry
- 7.3.1. Commercial
- 7.3.2. Residential
- 7.3.3. Industrial
- 7.1. Market Analysis, Insights and Forecast - by Method
- 8. Asia 3D Printing Construction Market Analysis, Insights and Forecast, 2019-2031
- 8.1. Market Analysis, Insights and Forecast - by Method
- 8.1.1. Extrusion
- 8.1.2. Powder Bonding
- 8.1.3. Other Methods
- 8.2. Market Analysis, Insights and Forecast - by Material Type
- 8.2.1. Concrete
- 8.2.2. Metal
- 8.2.3. Composite
- 8.3. Market Analysis, Insights and Forecast - by End User Industry
- 8.3.1. Commercial
- 8.3.2. Residential
- 8.3.3. Industrial
- 8.1. Market Analysis, Insights and Forecast - by Method
- 9. Australia and New Zealand 3D Printing Construction Market Analysis, Insights and Forecast, 2019-2031
- 9.1. Market Analysis, Insights and Forecast - by Method
- 9.1.1. Extrusion
- 9.1.2. Powder Bonding
- 9.1.3. Other Methods
- 9.2. Market Analysis, Insights and Forecast - by Material Type
- 9.2.1. Concrete
- 9.2.2. Metal
- 9.2.3. Composite
- 9.3. Market Analysis, Insights and Forecast - by End User Industry
- 9.3.1. Commercial
- 9.3.2. Residential
- 9.3.3. Industrial
- 9.1. Market Analysis, Insights and Forecast - by Method
- 10. Latin America 3D Printing Construction Market Analysis, Insights and Forecast, 2019-2031
- 10.1. Market Analysis, Insights and Forecast - by Method
- 10.1.1. Extrusion
- 10.1.2. Powder Bonding
- 10.1.3. Other Methods
- 10.2. Market Analysis, Insights and Forecast - by Material Type
- 10.2.1. Concrete
- 10.2.2. Metal
- 10.2.3. Composite
- 10.3. Market Analysis, Insights and Forecast - by End User Industry
- 10.3.1. Commercial
- 10.3.2. Residential
- 10.3.3. Industrial
- 10.1. Market Analysis, Insights and Forecast - by Method
- 11. Middle East and Africa 3D Printing Construction Market Analysis, Insights and Forecast, 2019-2031
- 11.1. Market Analysis, Insights and Forecast - by Method
- 11.1.1. Extrusion
- 11.1.2. Powder Bonding
- 11.1.3. Other Methods
- 11.2. Market Analysis, Insights and Forecast - by Material Type
- 11.2.1. Concrete
- 11.2.2. Metal
- 11.2.3. Composite
- 11.3. Market Analysis, Insights and Forecast - by End User Industry
- 11.3.1. Commercial
- 11.3.2. Residential
- 11.3.3. Industrial
- 11.1. Market Analysis, Insights and Forecast - by Method
- 12. Competitive Analysis
- 12.1. Global Market Share Analysis 2024
- 12.2. Company Profiles
- 12.2.1 COBOD International A/S
- 12.2.1.1. Overview
- 12.2.1.2. Products
- 12.2.1.3. SWOT Analysis
- 12.2.1.4. Recent Developments
- 12.2.1.5. Financials (Based on Availability)
- 12.2.2 Yingchuang Building Technique
- 12.2.2.1. Overview
- 12.2.2.2. Products
- 12.2.2.3. SWOT Analysis
- 12.2.2.4. Recent Developments
- 12.2.2.5. Financials (Based on Availability)
- 12.2.3 XtreeE
- 12.2.3.1. Overview
- 12.2.3.2. Products
- 12.2.3.3. SWOT Analysis
- 12.2.3.4. Recent Developments
- 12.2.3.5. Financials (Based on Availability)
- 12.2.4 Apis Cor
- 12.2.4.1. Overview
- 12.2.4.2. Products
- 12.2.4.3. SWOT Analysis
- 12.2.4.4. Recent Developments
- 12.2.4.5. Financials (Based on Availability)
- 12.2.5 VoxelMatters
- 12.2.5.1. Overview
- 12.2.5.2. Products
- 12.2.5.3. SWOT Analysis
- 12.2.5.4. Recent Developments
- 12.2.5.5. Financials (Based on Availability)
- 12.2.6 Make3d in
- 12.2.6.1. Overview
- 12.2.6.2. Products
- 12.2.6.3. SWOT Analysis
- 12.2.6.4. Recent Developments
- 12.2.6.5. Financials (Based on Availability)
- 12.2.7 AJAX Engineering
- 12.2.7.1. Overview
- 12.2.7.2. Products
- 12.2.7.3. SWOT Analysis
- 12.2.7.4. Recent Developments
- 12.2.7.5. Financials (Based on Availability)
- 12.2.8 RIC Technology
- 12.2.8.1. Overview
- 12.2.8.2. Products
- 12.2.8.3. SWOT Analysis
- 12.2.8.4. Recent Developments
- 12.2.8.5. Financials (Based on Availability)
- 12.2.9 Holcim
- 12.2.9.1. Overview
- 12.2.9.2. Products
- 12.2.9.3. SWOT Analysis
- 12.2.9.4. Recent Developments
- 12.2.9.5. Financials (Based on Availability)
- 12.2.10 Sika*List Not Exhaustive
- 12.2.10.1. Overview
- 12.2.10.2. Products
- 12.2.10.3. SWOT Analysis
- 12.2.10.4. Recent Developments
- 12.2.10.5. Financials (Based on Availability)
- 12.2.1 COBOD International A/S
List of Figures
- Figure 1: Global 3D Printing Construction Market Revenue Breakdown (Million, %) by Region 2024 & 2032
- Figure 2: Global 3D Printing Construction Market Volume Breakdown (Billion, %) by Region 2024 & 2032
- Figure 3: North America 3D Printing Construction Market Revenue (Million), by Method 2024 & 2032
- Figure 4: North America 3D Printing Construction Market Volume (Billion), by Method 2024 & 2032
- Figure 5: North America 3D Printing Construction Market Revenue Share (%), by Method 2024 & 2032
- Figure 6: North America 3D Printing Construction Market Volume Share (%), by Method 2024 & 2032
- Figure 7: North America 3D Printing Construction Market Revenue (Million), by Material Type 2024 & 2032
- Figure 8: North America 3D Printing Construction Market Volume (Billion), by Material Type 2024 & 2032
- Figure 9: North America 3D Printing Construction Market Revenue Share (%), by Material Type 2024 & 2032
- Figure 10: North America 3D Printing Construction Market Volume Share (%), by Material Type 2024 & 2032
- Figure 11: North America 3D Printing Construction Market Revenue (Million), by End User Industry 2024 & 2032
- Figure 12: North America 3D Printing Construction Market Volume (Billion), by End User Industry 2024 & 2032
- Figure 13: North America 3D Printing Construction Market Revenue Share (%), by End User Industry 2024 & 2032
- Figure 14: North America 3D Printing Construction Market Volume Share (%), by End User Industry 2024 & 2032
- Figure 15: North America 3D Printing Construction Market Revenue (Million), by Country 2024 & 2032
- Figure 16: North America 3D Printing Construction Market Volume (Billion), by Country 2024 & 2032
- Figure 17: North America 3D Printing Construction Market Revenue Share (%), by Country 2024 & 2032
- Figure 18: North America 3D Printing Construction Market Volume Share (%), by Country 2024 & 2032
- Figure 19: Europe 3D Printing Construction Market Revenue (Million), by Method 2024 & 2032
- Figure 20: Europe 3D Printing Construction Market Volume (Billion), by Method 2024 & 2032
- Figure 21: Europe 3D Printing Construction Market Revenue Share (%), by Method 2024 & 2032
- Figure 22: Europe 3D Printing Construction Market Volume Share (%), by Method 2024 & 2032
- Figure 23: Europe 3D Printing Construction Market Revenue (Million), by Material Type 2024 & 2032
- Figure 24: Europe 3D Printing Construction Market Volume (Billion), by Material Type 2024 & 2032
- Figure 25: Europe 3D Printing Construction Market Revenue Share (%), by Material Type 2024 & 2032
- Figure 26: Europe 3D Printing Construction Market Volume Share (%), by Material Type 2024 & 2032
- Figure 27: Europe 3D Printing Construction Market Revenue (Million), by End User Industry 2024 & 2032
- Figure 28: Europe 3D Printing Construction Market Volume (Billion), by End User Industry 2024 & 2032
- Figure 29: Europe 3D Printing Construction Market Revenue Share (%), by End User Industry 2024 & 2032
- Figure 30: Europe 3D Printing Construction Market Volume Share (%), by End User Industry 2024 & 2032
- Figure 31: Europe 3D Printing Construction Market Revenue (Million), by Country 2024 & 2032
- Figure 32: Europe 3D Printing Construction Market Volume (Billion), by Country 2024 & 2032
- Figure 33: Europe 3D Printing Construction Market Revenue Share (%), by Country 2024 & 2032
- Figure 34: Europe 3D Printing Construction Market Volume Share (%), by Country 2024 & 2032
- Figure 35: Asia 3D Printing Construction Market Revenue (Million), by Method 2024 & 2032
- Figure 36: Asia 3D Printing Construction Market Volume (Billion), by Method 2024 & 2032
- Figure 37: Asia 3D Printing Construction Market Revenue Share (%), by Method 2024 & 2032
- Figure 38: Asia 3D Printing Construction Market Volume Share (%), by Method 2024 & 2032
- Figure 39: Asia 3D Printing Construction Market Revenue (Million), by Material Type 2024 & 2032
- Figure 40: Asia 3D Printing Construction Market Volume (Billion), by Material Type 2024 & 2032
- Figure 41: Asia 3D Printing Construction Market Revenue Share (%), by Material Type 2024 & 2032
- Figure 42: Asia 3D Printing Construction Market Volume Share (%), by Material Type 2024 & 2032
- Figure 43: Asia 3D Printing Construction Market Revenue (Million), by End User Industry 2024 & 2032
- Figure 44: Asia 3D Printing Construction Market Volume (Billion), by End User Industry 2024 & 2032
- Figure 45: Asia 3D Printing Construction Market Revenue Share (%), by End User Industry 2024 & 2032
- Figure 46: Asia 3D Printing Construction Market Volume Share (%), by End User Industry 2024 & 2032
- Figure 47: Asia 3D Printing Construction Market Revenue (Million), by Country 2024 & 2032
- Figure 48: Asia 3D Printing Construction Market Volume (Billion), by Country 2024 & 2032
- Figure 49: Asia 3D Printing Construction Market Revenue Share (%), by Country 2024 & 2032
- Figure 50: Asia 3D Printing Construction Market Volume Share (%), by Country 2024 & 2032
- Figure 51: Australia and New Zealand 3D Printing Construction Market Revenue (Million), by Method 2024 & 2032
- Figure 52: Australia and New Zealand 3D Printing Construction Market Volume (Billion), by Method 2024 & 2032
- Figure 53: Australia and New Zealand 3D Printing Construction Market Revenue Share (%), by Method 2024 & 2032
- Figure 54: Australia and New Zealand 3D Printing Construction Market Volume Share (%), by Method 2024 & 2032
- Figure 55: Australia and New Zealand 3D Printing Construction Market Revenue (Million), by Material Type 2024 & 2032
- Figure 56: Australia and New Zealand 3D Printing Construction Market Volume (Billion), by Material Type 2024 & 2032
- Figure 57: Australia and New Zealand 3D Printing Construction Market Revenue Share (%), by Material Type 2024 & 2032
- Figure 58: Australia and New Zealand 3D Printing Construction Market Volume Share (%), by Material Type 2024 & 2032
- Figure 59: Australia and New Zealand 3D Printing Construction Market Revenue (Million), by End User Industry 2024 & 2032
- Figure 60: Australia and New Zealand 3D Printing Construction Market Volume (Billion), by End User Industry 2024 & 2032
- Figure 61: Australia and New Zealand 3D Printing Construction Market Revenue Share (%), by End User Industry 2024 & 2032
- Figure 62: Australia and New Zealand 3D Printing Construction Market Volume Share (%), by End User Industry 2024 & 2032
- Figure 63: Australia and New Zealand 3D Printing Construction Market Revenue (Million), by Country 2024 & 2032
- Figure 64: Australia and New Zealand 3D Printing Construction Market Volume (Billion), by Country 2024 & 2032
- Figure 65: Australia and New Zealand 3D Printing Construction Market Revenue Share (%), by Country 2024 & 2032
- Figure 66: Australia and New Zealand 3D Printing Construction Market Volume Share (%), by Country 2024 & 2032
- Figure 67: Latin America 3D Printing Construction Market Revenue (Million), by Method 2024 & 2032
- Figure 68: Latin America 3D Printing Construction Market Volume (Billion), by Method 2024 & 2032
- Figure 69: Latin America 3D Printing Construction Market Revenue Share (%), by Method 2024 & 2032
- Figure 70: Latin America 3D Printing Construction Market Volume Share (%), by Method 2024 & 2032
- Figure 71: Latin America 3D Printing Construction Market Revenue (Million), by Material Type 2024 & 2032
- Figure 72: Latin America 3D Printing Construction Market Volume (Billion), by Material Type 2024 & 2032
- Figure 73: Latin America 3D Printing Construction Market Revenue Share (%), by Material Type 2024 & 2032
- Figure 74: Latin America 3D Printing Construction Market Volume Share (%), by Material Type 2024 & 2032
- Figure 75: Latin America 3D Printing Construction Market Revenue (Million), by End User Industry 2024 & 2032
- Figure 76: Latin America 3D Printing Construction Market Volume (Billion), by End User Industry 2024 & 2032
- Figure 77: Latin America 3D Printing Construction Market Revenue Share (%), by End User Industry 2024 & 2032
- Figure 78: Latin America 3D Printing Construction Market Volume Share (%), by End User Industry 2024 & 2032
- Figure 79: Latin America 3D Printing Construction Market Revenue (Million), by Country 2024 & 2032
- Figure 80: Latin America 3D Printing Construction Market Volume (Billion), by Country 2024 & 2032
- Figure 81: Latin America 3D Printing Construction Market Revenue Share (%), by Country 2024 & 2032
- Figure 82: Latin America 3D Printing Construction Market Volume Share (%), by Country 2024 & 2032
- Figure 83: Middle East and Africa 3D Printing Construction Market Revenue (Million), by Method 2024 & 2032
- Figure 84: Middle East and Africa 3D Printing Construction Market Volume (Billion), by Method 2024 & 2032
- Figure 85: Middle East and Africa 3D Printing Construction Market Revenue Share (%), by Method 2024 & 2032
- Figure 86: Middle East and Africa 3D Printing Construction Market Volume Share (%), by Method 2024 & 2032
- Figure 87: Middle East and Africa 3D Printing Construction Market Revenue (Million), by Material Type 2024 & 2032
- Figure 88: Middle East and Africa 3D Printing Construction Market Volume (Billion), by Material Type 2024 & 2032
- Figure 89: Middle East and Africa 3D Printing Construction Market Revenue Share (%), by Material Type 2024 & 2032
- Figure 90: Middle East and Africa 3D Printing Construction Market Volume Share (%), by Material Type 2024 & 2032
- Figure 91: Middle East and Africa 3D Printing Construction Market Revenue (Million), by End User Industry 2024 & 2032
- Figure 92: Middle East and Africa 3D Printing Construction Market Volume (Billion), by End User Industry 2024 & 2032
- Figure 93: Middle East and Africa 3D Printing Construction Market Revenue Share (%), by End User Industry 2024 & 2032
- Figure 94: Middle East and Africa 3D Printing Construction Market Volume Share (%), by End User Industry 2024 & 2032
- Figure 95: Middle East and Africa 3D Printing Construction Market Revenue (Million), by Country 2024 & 2032
- Figure 96: Middle East and Africa 3D Printing Construction Market Volume (Billion), by Country 2024 & 2032
- Figure 97: Middle East and Africa 3D Printing Construction Market Revenue Share (%), by Country 2024 & 2032
- Figure 98: Middle East and Africa 3D Printing Construction Market Volume Share (%), by Country 2024 & 2032
List of Tables
- Table 1: Global 3D Printing Construction Market Revenue Million Forecast, by Region 2019 & 2032
- Table 2: Global 3D Printing Construction Market Volume Billion Forecast, by Region 2019 & 2032
- Table 3: Global 3D Printing Construction Market Revenue Million Forecast, by Method 2019 & 2032
- Table 4: Global 3D Printing Construction Market Volume Billion Forecast, by Method 2019 & 2032
- Table 5: Global 3D Printing Construction Market Revenue Million Forecast, by Material Type 2019 & 2032
- Table 6: Global 3D Printing Construction Market Volume Billion Forecast, by Material Type 2019 & 2032
- Table 7: Global 3D Printing Construction Market Revenue Million Forecast, by End User Industry 2019 & 2032
- Table 8: Global 3D Printing Construction Market Volume Billion Forecast, by End User Industry 2019 & 2032
- Table 9: Global 3D Printing Construction Market Revenue Million Forecast, by Region 2019 & 2032
- Table 10: Global 3D Printing Construction Market Volume Billion Forecast, by Region 2019 & 2032
- Table 11: Global 3D Printing Construction Market Revenue Million Forecast, by Method 2019 & 2032
- Table 12: Global 3D Printing Construction Market Volume Billion Forecast, by Method 2019 & 2032
- Table 13: Global 3D Printing Construction Market Revenue Million Forecast, by Material Type 2019 & 2032
- Table 14: Global 3D Printing Construction Market Volume Billion Forecast, by Material Type 2019 & 2032
- Table 15: Global 3D Printing Construction Market Revenue Million Forecast, by End User Industry 2019 & 2032
- Table 16: Global 3D Printing Construction Market Volume Billion Forecast, by End User Industry 2019 & 2032
- Table 17: Global 3D Printing Construction Market Revenue Million Forecast, by Country 2019 & 2032
- Table 18: Global 3D Printing Construction Market Volume Billion Forecast, by Country 2019 & 2032
- Table 19: Global 3D Printing Construction Market Revenue Million Forecast, by Method 2019 & 2032
- Table 20: Global 3D Printing Construction Market Volume Billion Forecast, by Method 2019 & 2032
- Table 21: Global 3D Printing Construction Market Revenue Million Forecast, by Material Type 2019 & 2032
- Table 22: Global 3D Printing Construction Market Volume Billion Forecast, by Material Type 2019 & 2032
- Table 23: Global 3D Printing Construction Market Revenue Million Forecast, by End User Industry 2019 & 2032
- Table 24: Global 3D Printing Construction Market Volume Billion Forecast, by End User Industry 2019 & 2032
- Table 25: Global 3D Printing Construction Market Revenue Million Forecast, by Country 2019 & 2032
- Table 26: Global 3D Printing Construction Market Volume Billion Forecast, by Country 2019 & 2032
- Table 27: Global 3D Printing Construction Market Revenue Million Forecast, by Method 2019 & 2032
- Table 28: Global 3D Printing Construction Market Volume Billion Forecast, by Method 2019 & 2032
- Table 29: Global 3D Printing Construction Market Revenue Million Forecast, by Material Type 2019 & 2032
- Table 30: Global 3D Printing Construction Market Volume Billion Forecast, by Material Type 2019 & 2032
- Table 31: Global 3D Printing Construction Market Revenue Million Forecast, by End User Industry 2019 & 2032
- Table 32: Global 3D Printing Construction Market Volume Billion Forecast, by End User Industry 2019 & 2032
- Table 33: Global 3D Printing Construction Market Revenue Million Forecast, by Country 2019 & 2032
- Table 34: Global 3D Printing Construction Market Volume Billion Forecast, by Country 2019 & 2032
- Table 35: Global 3D Printing Construction Market Revenue Million Forecast, by Method 2019 & 2032
- Table 36: Global 3D Printing Construction Market Volume Billion Forecast, by Method 2019 & 2032
- Table 37: Global 3D Printing Construction Market Revenue Million Forecast, by Material Type 2019 & 2032
- Table 38: Global 3D Printing Construction Market Volume Billion Forecast, by Material Type 2019 & 2032
- Table 39: Global 3D Printing Construction Market Revenue Million Forecast, by End User Industry 2019 & 2032
- Table 40: Global 3D Printing Construction Market Volume Billion Forecast, by End User Industry 2019 & 2032
- Table 41: Global 3D Printing Construction Market Revenue Million Forecast, by Country 2019 & 2032
- Table 42: Global 3D Printing Construction Market Volume Billion Forecast, by Country 2019 & 2032
- Table 43: Global 3D Printing Construction Market Revenue Million Forecast, by Method 2019 & 2032
- Table 44: Global 3D Printing Construction Market Volume Billion Forecast, by Method 2019 & 2032
- Table 45: Global 3D Printing Construction Market Revenue Million Forecast, by Material Type 2019 & 2032
- Table 46: Global 3D Printing Construction Market Volume Billion Forecast, by Material Type 2019 & 2032
- Table 47: Global 3D Printing Construction Market Revenue Million Forecast, by End User Industry 2019 & 2032
- Table 48: Global 3D Printing Construction Market Volume Billion Forecast, by End User Industry 2019 & 2032
- Table 49: Global 3D Printing Construction Market Revenue Million Forecast, by Country 2019 & 2032
- Table 50: Global 3D Printing Construction Market Volume Billion Forecast, by Country 2019 & 2032
- Table 51: Global 3D Printing Construction Market Revenue Million Forecast, by Method 2019 & 2032
- Table 52: Global 3D Printing Construction Market Volume Billion Forecast, by Method 2019 & 2032
- Table 53: Global 3D Printing Construction Market Revenue Million Forecast, by Material Type 2019 & 2032
- Table 54: Global 3D Printing Construction Market Volume Billion Forecast, by Material Type 2019 & 2032
- Table 55: Global 3D Printing Construction Market Revenue Million Forecast, by End User Industry 2019 & 2032
- Table 56: Global 3D Printing Construction Market Volume Billion Forecast, by End User Industry 2019 & 2032
- Table 57: Global 3D Printing Construction Market Revenue Million Forecast, by Country 2019 & 2032
- Table 58: Global 3D Printing Construction Market Volume Billion Forecast, by Country 2019 & 2032
Frequently Asked Questions
1. What is the projected Compound Annual Growth Rate (CAGR) of the 3D Printing Construction Market?
The projected CAGR is approximately 22.49%.
2. Which companies are prominent players in the 3D Printing Construction Market?
Key companies in the market include COBOD International A/S, Yingchuang Building Technique, XtreeE, Apis Cor, VoxelMatters, Make3d in, AJAX Engineering, RIC Technology, Holcim, Sika*List Not Exhaustive.
3. What are the main segments of the 3D Printing Construction Market?
The market segments include Method, Material Type, End User Industry.
4. Can you provide details about the market size?
The market size is estimated to be USD 1.5 Million as of 2022.
5. What are some drivers contributing to market growth?
Rising Demand for Affordable Housing; Growing Shift Towards Sustainable Construction.
6. What are the notable trends driving market growth?
Residential Segment is Expected to Observe Significant Market Share.
7. Are there any restraints impacting market growth?
Rising Demand for Affordable Housing; Growing Shift Towards Sustainable Construction.
8. Can you provide examples of recent developments in the market?
July 2024: In collaboration with Saintgits College of Engineering in Kottayam, Tvasta Manufacturing Solutions, a trailblazing deep-tech startup in Construction 3D Printing, inaugurated Kerala's inaugural Concrete 3D Printer Lab. This state-of-the-art facility is set to enhance research and innovation in the construction sector, leveraging cutting-edge 3D printing methods.March 2024: ICON, known for its pioneering role in advanced construction technologies and large-scale 3D printing, unveiled a suite of innovative products aimed at automating the construction process. Highlights include a groundbreaking robotic printer capable of multi-story constructions, a novel low-carbon building material, a digital catalogue boasting over 60 ready-to-build home designs, and an AI Architect tailored for home design and construction.
9. What pricing options are available for accessing the report?
Pricing options include single-user, multi-user, and enterprise licenses priced at USD 4750, USD 5250, and USD 8750 respectively.
10. Is the market size provided in terms of value or volume?
The market size is provided in terms of value, measured in Million and volume, measured in Billion.
11. Are there any specific market keywords associated with the report?
Yes, the market keyword associated with the report is "3D Printing Construction Market," which aids in identifying and referencing the specific market segment covered.
12. How do I determine which pricing option suits my needs best?
The pricing options vary based on user requirements and access needs. Individual users may opt for single-user licenses, while businesses requiring broader access may choose multi-user or enterprise licenses for cost-effective access to the report.
13. Are there any additional resources or data provided in the 3D Printing Construction Market report?
While the report offers comprehensive insights, it's advisable to review the specific contents or supplementary materials provided to ascertain if additional resources or data are available.
14. How can I stay updated on further developments or reports in the 3D Printing Construction Market?
To stay informed about further developments, trends, and reports in the 3D Printing Construction Market, consider subscribing to industry newsletters, following relevant companies and organizations, or regularly checking reputable industry news sources and publications.
Methodology
Step 1 - Identification of Relevant Samples Size from Population Database


Step 2 - Approaches for Defining Global Market Size (Value, Volume* & Price*)

Note*: In applicable scenarios
Step 3 - Data Sources
Primary Research
- Web Analytics
- Survey Reports
- Research Institute
- Latest Research Reports
- Opinion Leaders
Secondary Research
- Annual Reports
- White Paper
- Latest Press Release
- Industry Association
- Paid Database
- Investor Presentations

Step 4 - Data Triangulation
Involves using different sources of information in order to increase the validity of a study
These sources are likely to be stakeholders in a program - participants, other researchers, program staff, other community members, and so on.
Then we put all data in single framework & apply various statistical tools to find out the dynamic on the market.
During the analysis stage, feedback from the stakeholder groups would be compared to determine areas of agreement as well as areas of divergence
