

Key Insights
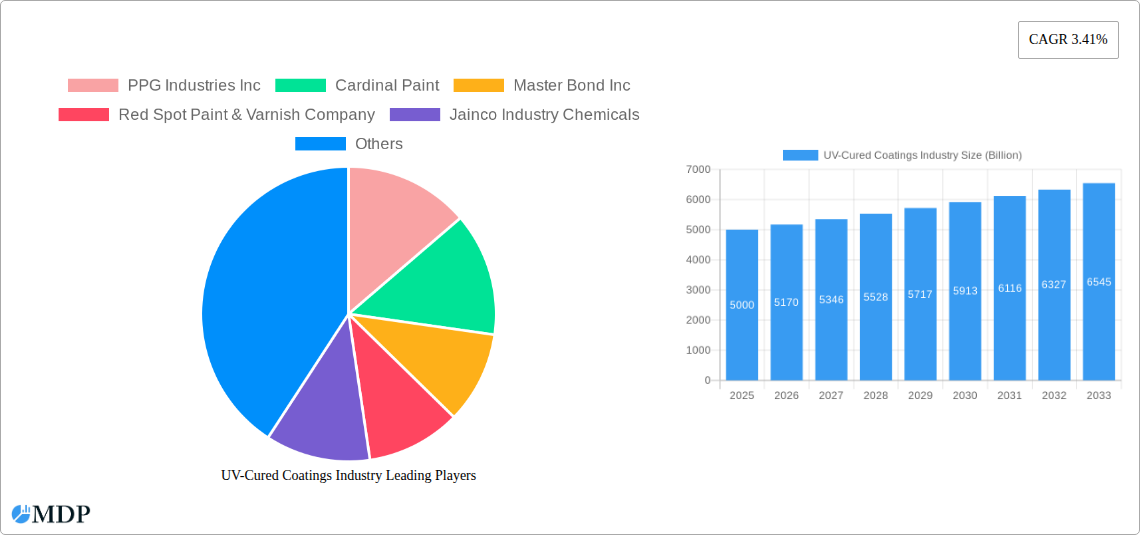
The UV-Cured Coatings market, valued at approximately $5 billion in 2025, is projected to experience steady growth, with a Compound Annual Growth Rate (CAGR) of 3.41% from 2025 to 2033. This growth is driven by several key factors. The increasing demand for high-performance coatings across diverse industries, including automotive, aerospace, and printing inks, fuels market expansion. The inherent advantages of UV-cured coatings, such as rapid curing times, reduced energy consumption, and lower volatile organic compound (VOC) emissions, are significant drivers. Furthermore, technological advancements leading to improved coating properties like enhanced durability, scratch resistance, and chemical resistance are bolstering market adoption. The automotive industry, a major consumer, is pushing for lighter and more fuel-efficient vehicles, increasing the demand for UV-cured coatings due to their lightweight nature and excellent adhesion properties. Similarly, the growing aerospace industry, with its stringent requirements for durability and performance, represents a significant growth opportunity. However, the market faces certain restraints. The high initial investment costs associated with UV curing equipment might deter some smaller players. Fluctuations in raw material prices, particularly resins, can also impact profitability. Competition among established players and the emergence of new technologies will further shape the market landscape.
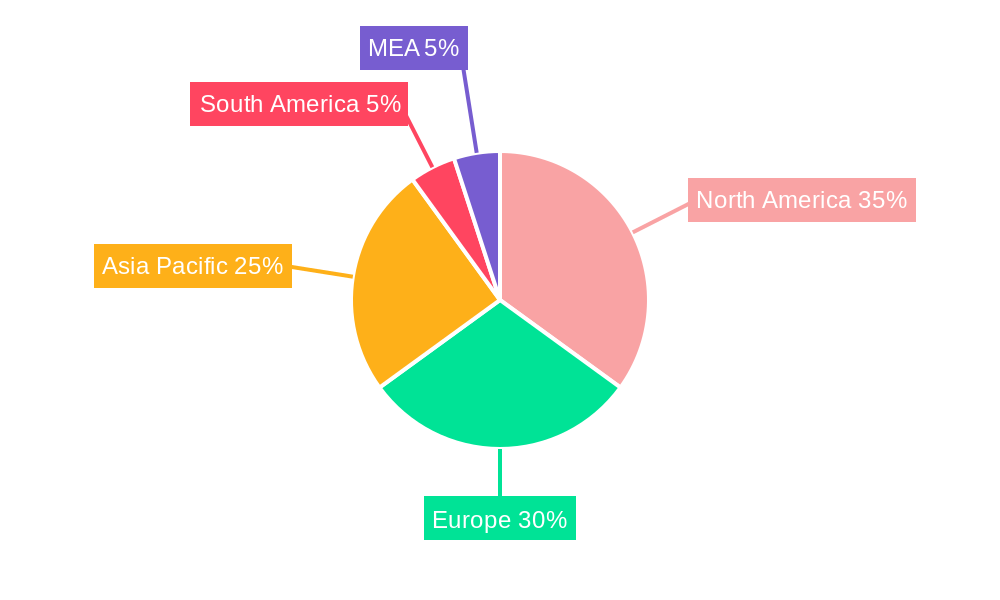
The market segmentation reveals that epoxy resins currently dominate, followed by polyester and urethane. However, other resin types are gaining traction due to their unique properties and applications. In terms of application, the automotive and printing ink segments are major revenue contributors, with continued growth expected in aerospace and wood applications. Regionally, North America and Europe currently hold significant market shares, driven by established industrial bases and strong regulatory frameworks favoring environmentally friendly coatings. However, the Asia-Pacific region is anticipated to show substantial growth in the forecast period, fueled by rising industrialization and infrastructure development, particularly in countries like China and India. This presents significant opportunities for market expansion and investment. The competitive landscape is characterized by both established multinational corporations and specialized smaller companies, indicating a diverse range of product offerings and technological capabilities.
UV-Cured Coatings Industry Market Report: 2019-2033
This comprehensive report provides an in-depth analysis of the global UV-Cured Coatings industry, projecting a market valuation exceeding $XX Billion by 2033. The report covers the period from 2019 to 2033, with 2025 serving as the base and estimated year. It offers actionable insights for industry stakeholders, including manufacturers, investors, and researchers.
UV-Cured Coatings Industry Market Dynamics & Concentration
The UV-cured coatings market is characterized by moderate concentration, with key players like PPG Industries Inc, Sherwin-Williams Co, and AkzoNobel NV holding significant market share. However, the market also features several smaller, specialized companies catering to niche applications. Innovation is a key driver, fueled by the demand for faster curing times, improved durability, and environmentally friendly formulations. Stringent regulatory frameworks concerning VOC emissions and safety standards influence product development and market access. Competition from alternative coating technologies, such as powder coatings and water-based coatings, presents a challenge. End-user trends towards sustainable and high-performance coatings are shaping market demand. M&A activities in the past five years have been moderate, with approximately xx deals reported, primarily focused on expanding product portfolios and geographical reach. Market share data for the major players is currently estimated at:
- PPG Industries Inc: xx%
- Sherwin-Williams Co: xx%
- AkzoNobel NV: xx%
- Other Players: xx%
UV-Cured Coatings Industry Industry Trends & Analysis
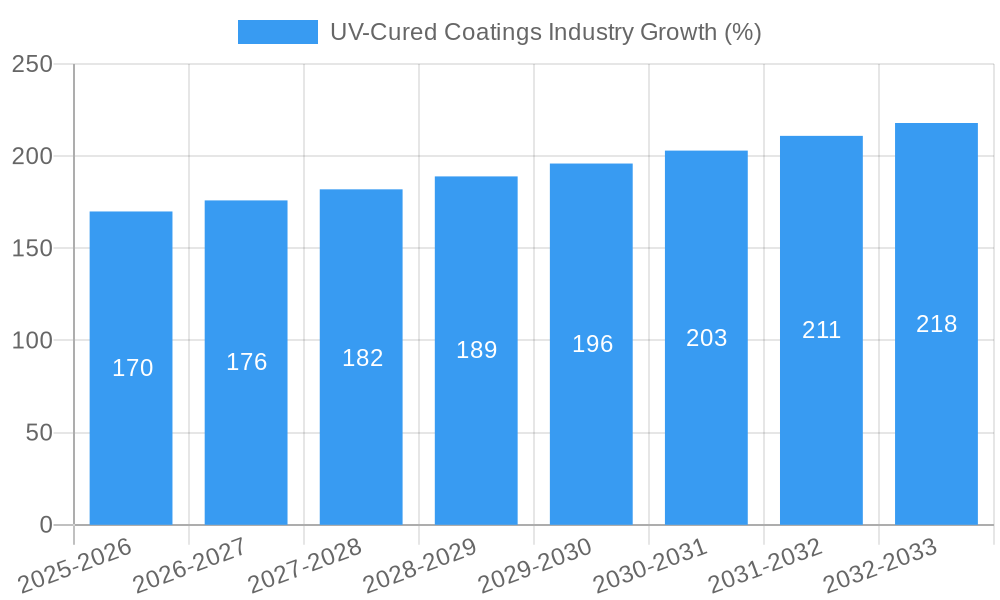
The UV-cured coatings market is experiencing robust growth, driven by the increasing demand across various end-use industries. The compound annual growth rate (CAGR) is projected to be xx% during the forecast period (2025-2033). Technological advancements, such as the development of novel resin chemistries and curing technologies, are contributing to improved coating performance and efficiency. Consumer preferences are shifting towards coatings with enhanced aesthetics, durability, and environmental sustainability. Intense competitive dynamics are pushing innovation and cost optimization, leading to diverse product offerings. Market penetration in key segments like automotive and wood coatings is expected to reach xx% by 2033.
Leading Markets & Segments in UV-Cured Coatings Industry
The automotive sector remains the dominant application segment, accounting for approximately xx% of the total market value, driven by the increasing demand for high-quality finishes and faster production cycles. The Asia-Pacific region is currently the leading geographical market, fueled by robust automotive manufacturing and rapid industrialization. Within resin types, the epoxy segment holds a significant share due to its excellent mechanical properties and versatility.
Key Drivers:
- Automotive: Stringent emission norms and demand for lightweight vehicles.
- Asia-Pacific: Rapid industrialization and increasing automotive production.
- Epoxy Resin: Superior mechanical strength, chemical resistance, and versatility.
Further analysis reveals strong growth potential in the wood and aerospace applications, driven by the increasing demand for high-performance, durable coatings. Government initiatives promoting sustainable manufacturing practices further drive adoption in various segments.
UV-Cured Coatings Industry Product Developments
Recent product innovations focus on developing coatings with enhanced UV resistance, scratch resistance, and chemical resistance. The introduction of dual-cure technologies, as demonstrated by Beckers' recent launch, signifies a key technological advancement, providing manufacturers with greater flexibility and improved production efficiencies. These advancements cater to the increasing demand for high-performance coatings across diverse applications, leading to strong competitive advantages for innovators.
Key Drivers of UV-Cured Coatings Industry Growth
Several factors contribute to the growth of the UV-cured coatings market:
- Technological advancements: Development of new resin chemistries and curing technologies.
- Economic growth: Expansion of manufacturing sectors in developing economies.
- Stringent environmental regulations: Demand for low-VOC and eco-friendly coatings.
- Rising demand for high-performance coatings: Across automotive, aerospace and wood applications.
Challenges in the UV-Cured Coatings Industry Market
The UV-cured coatings market faces challenges such as:
- Raw material price fluctuations: Affecting profitability and cost competitiveness.
- Stringent environmental regulations: Increasing compliance costs.
- Intense competition: From alternative coating technologies and established players.
Emerging Opportunities in UV-Cured Coatings Industry
Significant opportunities exist in the development of specialized coatings for niche applications, strategic partnerships to expand market reach, and the expansion into new geographical markets with high-growth potential. Further innovation in dual-cure technology and the development of sustainable and bio-based resins will drive long-term growth.
Leading Players in the UV-Cured Coatings Industry Sector
- PPG Industries Inc
- Cardinal Paint
- Master Bond Inc
- Red Spot Paint & Varnish Company
- Jainco Industry Chemicals
- Dymax Corp
- Protech Powder Coatings Inc
- Nippon Paint
- Sherwin-Williams Co
- Seagrave Coatings Corp
- AkzoNobel NV
- Watson Coatings
- Ashland Coatings
- Keyland Polymer
Key Milestones in UV-Cured Coatings Industry Industry
- February 2023: Beckers launched commercial paint formulations for dual UV and electron-beam curing in the coil coating market, signifying a significant technological leap.
- November 2022: Evonik introduced TEGO Airex 923 deaerator for radiation-cured wood coatings, improving coating quality and efficiency.
Strategic Outlook for UV-Cured Coatings Industry Market
The UV-cured coatings market is poised for substantial growth driven by technological advancements, increasing demand from diverse end-use sectors, and favorable regulatory landscapes. Strategic partnerships and investments in R&D will be critical for companies seeking to capitalize on the market's potential. Focus on sustainable and high-performance solutions will be key to success in the coming years.
UV-Cured Coatings Industry Segmentation
-
1. Resin Type
- 1.1. Epoxy
- 1.2. Polyester
- 1.3. Urethane
- 1.4. Other Resin Types
-
2. Application
- 2.1. Automotive
- 2.2. Printing Ink
- 2.3. Metal
- 2.4. Wood
- 2.5. Aerospace
- 2.6. Other Applications
UV-Cured Coatings Industry Segmentation By Geography
-
1. Asia Pacific
- 1.1. China
- 1.2. India
- 1.3. Japan
- 1.4. South Korea
- 1.5. Rest of Asia Pacific
-
2. North America
- 2.1. United States
- 2.2. Canada
- 2.3. Mexico
-
3. Europe
- 3.1. Germany
- 3.2. United Kingdom
- 3.3. France
- 3.4. Italy
- 3.5. Rest of Europe
-
4. South America
- 4.1. Brazil
- 4.2. Argentina
- 4.3. Rest of South America
- 5. Middle East
-
6. Saudi Arabia
- 6.1. South Africa
- 6.2. Rest of Middle East
UV-Cured Coatings Industry REPORT HIGHLIGHTS
| Aspects | Details |
|---|---|
| Study Period | 2019-2033 |
| Base Year | 2024 |
| Estimated Year | 2025 |
| Forecast Period | 2025-2033 |
| Historical Period | 2019-2024 |
| Growth Rate | CAGR of 3.41% from 2019-2033 |
| Segmentation |
|
Table of Contents
- 1. Introduction
- 1.1. Research Scope
- 1.2. Market Segmentation
- 1.3. Research Methodology
- 1.4. Definitions and Assumptions
- 2. Executive Summary
- 2.1. Introduction
- 3. Market Dynamics
- 3.1. Introduction
- 3.2. Market Drivers
- 3.2.1. Increasing Demand for Wood Finishings; Other Drivers
- 3.3. Market Restrains
- 3.3.1. High Initial Costs of Equipment; Difficulty in Finishing Complex 3D Objects
- 3.4. Market Trends
- 3.4.1. The Automotive Industry is Expected to Dominate the Market
- 4. Market Factor Analysis
- 4.1. Porters Five Forces
- 4.2. Supply/Value Chain
- 4.3. PESTEL analysis
- 4.4. Market Entropy
- 4.5. Patent/Trademark Analysis
- 5. Global UV-Cured Coatings Industry Analysis, Insights and Forecast, 2019-2031
- 5.1. Market Analysis, Insights and Forecast - by Resin Type
- 5.1.1. Epoxy
- 5.1.2. Polyester
- 5.1.3. Urethane
- 5.1.4. Other Resin Types
- 5.2. Market Analysis, Insights and Forecast - by Application
- 5.2.1. Automotive
- 5.2.2. Printing Ink
- 5.2.3. Metal
- 5.2.4. Wood
- 5.2.5. Aerospace
- 5.2.6. Other Applications
- 5.3. Market Analysis, Insights and Forecast - by Region
- 5.3.1. Asia Pacific
- 5.3.2. North America
- 5.3.3. Europe
- 5.3.4. South America
- 5.3.5. Middle East
- 5.3.6. Saudi Arabia
- 5.1. Market Analysis, Insights and Forecast - by Resin Type
- 6. Asia Pacific UV-Cured Coatings Industry Analysis, Insights and Forecast, 2019-2031
- 6.1. Market Analysis, Insights and Forecast - by Resin Type
- 6.1.1. Epoxy
- 6.1.2. Polyester
- 6.1.3. Urethane
- 6.1.4. Other Resin Types
- 6.2. Market Analysis, Insights and Forecast - by Application
- 6.2.1. Automotive
- 6.2.2. Printing Ink
- 6.2.3. Metal
- 6.2.4. Wood
- 6.2.5. Aerospace
- 6.2.6. Other Applications
- 6.1. Market Analysis, Insights and Forecast - by Resin Type
- 7. North America UV-Cured Coatings Industry Analysis, Insights and Forecast, 2019-2031
- 7.1. Market Analysis, Insights and Forecast - by Resin Type
- 7.1.1. Epoxy
- 7.1.2. Polyester
- 7.1.3. Urethane
- 7.1.4. Other Resin Types
- 7.2. Market Analysis, Insights and Forecast - by Application
- 7.2.1. Automotive
- 7.2.2. Printing Ink
- 7.2.3. Metal
- 7.2.4. Wood
- 7.2.5. Aerospace
- 7.2.6. Other Applications
- 7.1. Market Analysis, Insights and Forecast - by Resin Type
- 8. Europe UV-Cured Coatings Industry Analysis, Insights and Forecast, 2019-2031
- 8.1. Market Analysis, Insights and Forecast - by Resin Type
- 8.1.1. Epoxy
- 8.1.2. Polyester
- 8.1.3. Urethane
- 8.1.4. Other Resin Types
- 8.2. Market Analysis, Insights and Forecast - by Application
- 8.2.1. Automotive
- 8.2.2. Printing Ink
- 8.2.3. Metal
- 8.2.4. Wood
- 8.2.5. Aerospace
- 8.2.6. Other Applications
- 8.1. Market Analysis, Insights and Forecast - by Resin Type
- 9. South America UV-Cured Coatings Industry Analysis, Insights and Forecast, 2019-2031
- 9.1. Market Analysis, Insights and Forecast - by Resin Type
- 9.1.1. Epoxy
- 9.1.2. Polyester
- 9.1.3. Urethane
- 9.1.4. Other Resin Types
- 9.2. Market Analysis, Insights and Forecast - by Application
- 9.2.1. Automotive
- 9.2.2. Printing Ink
- 9.2.3. Metal
- 9.2.4. Wood
- 9.2.5. Aerospace
- 9.2.6. Other Applications
- 9.1. Market Analysis, Insights and Forecast - by Resin Type
- 10. Middle East UV-Cured Coatings Industry Analysis, Insights and Forecast, 2019-2031
- 10.1. Market Analysis, Insights and Forecast - by Resin Type
- 10.1.1. Epoxy
- 10.1.2. Polyester
- 10.1.3. Urethane
- 10.1.4. Other Resin Types
- 10.2. Market Analysis, Insights and Forecast - by Application
- 10.2.1. Automotive
- 10.2.2. Printing Ink
- 10.2.3. Metal
- 10.2.4. Wood
- 10.2.5. Aerospace
- 10.2.6. Other Applications
- 10.1. Market Analysis, Insights and Forecast - by Resin Type
- 11. Saudi Arabia UV-Cured Coatings Industry Analysis, Insights and Forecast, 2019-2031
- 11.1. Market Analysis, Insights and Forecast - by Resin Type
- 11.1.1. Epoxy
- 11.1.2. Polyester
- 11.1.3. Urethane
- 11.1.4. Other Resin Types
- 11.2. Market Analysis, Insights and Forecast - by Application
- 11.2.1. Automotive
- 11.2.2. Printing Ink
- 11.2.3. Metal
- 11.2.4. Wood
- 11.2.5. Aerospace
- 11.2.6. Other Applications
- 11.1. Market Analysis, Insights and Forecast - by Resin Type
- 12. North America UV-Cured Coatings Industry Analysis, Insights and Forecast, 2019-2031
- 12.1. Market Analysis, Insights and Forecast - By Country/Sub-region
- 12.1.1 United States
- 12.1.2 Canada
- 12.1.3 Mexico
- 13. Europe UV-Cured Coatings Industry Analysis, Insights and Forecast, 2019-2031
- 13.1. Market Analysis, Insights and Forecast - By Country/Sub-region
- 13.1.1 Germany
- 13.1.2 France
- 13.1.3 Italy
- 13.1.4 United Kingdom
- 13.1.5 Netherlands
- 13.1.6 Rest of Europe
- 14. Asia Pacific UV-Cured Coatings Industry Analysis, Insights and Forecast, 2019-2031
- 14.1. Market Analysis, Insights and Forecast - By Country/Sub-region
- 14.1.1 China
- 14.1.2 Japan
- 14.1.3 India
- 14.1.4 South Korea
- 14.1.5 Taiwan
- 14.1.6 Australia
- 14.1.7 Rest of Asia-Pacific
- 15. South America UV-Cured Coatings Industry Analysis, Insights and Forecast, 2019-2031
- 15.1. Market Analysis, Insights and Forecast - By Country/Sub-region
- 15.1.1 Brazil
- 15.1.2 Argentina
- 15.1.3 Rest of South America
- 16. MEA UV-Cured Coatings Industry Analysis, Insights and Forecast, 2019-2031
- 16.1. Market Analysis, Insights and Forecast - By Country/Sub-region
- 16.1.1 Middle East
- 16.1.2 Africa
- 17. Competitive Analysis
- 17.1. Global Market Share Analysis 2024
- 17.2. Company Profiles
- 17.2.1 PPG Industries Inc
- 17.2.1.1. Overview
- 17.2.1.2. Products
- 17.2.1.3. SWOT Analysis
- 17.2.1.4. Recent Developments
- 17.2.1.5. Financials (Based on Availability)
- 17.2.2 Cardinal Paint
- 17.2.2.1. Overview
- 17.2.2.2. Products
- 17.2.2.3. SWOT Analysis
- 17.2.2.4. Recent Developments
- 17.2.2.5. Financials (Based on Availability)
- 17.2.3 Master Bond Inc
- 17.2.3.1. Overview
- 17.2.3.2. Products
- 17.2.3.3. SWOT Analysis
- 17.2.3.4. Recent Developments
- 17.2.3.5. Financials (Based on Availability)
- 17.2.4 Red Spot Paint & Varnish Company
- 17.2.4.1. Overview
- 17.2.4.2. Products
- 17.2.4.3. SWOT Analysis
- 17.2.4.4. Recent Developments
- 17.2.4.5. Financials (Based on Availability)
- 17.2.5 Jainco Industry Chemicals
- 17.2.5.1. Overview
- 17.2.5.2. Products
- 17.2.5.3. SWOT Analysis
- 17.2.5.4. Recent Developments
- 17.2.5.5. Financials (Based on Availability)
- 17.2.6 Dymax Corp
- 17.2.6.1. Overview
- 17.2.6.2. Products
- 17.2.6.3. SWOT Analysis
- 17.2.6.4. Recent Developments
- 17.2.6.5. Financials (Based on Availability)
- 17.2.7 Protech Powder Coatings Inc
- 17.2.7.1. Overview
- 17.2.7.2. Products
- 17.2.7.3. SWOT Analysis
- 17.2.7.4. Recent Developments
- 17.2.7.5. Financials (Based on Availability)
- 17.2.8 Nippon Paint
- 17.2.8.1. Overview
- 17.2.8.2. Products
- 17.2.8.3. SWOT Analysis
- 17.2.8.4. Recent Developments
- 17.2.8.5. Financials (Based on Availability)
- 17.2.9 Sherwin-Williams Co
- 17.2.9.1. Overview
- 17.2.9.2. Products
- 17.2.9.3. SWOT Analysis
- 17.2.9.4. Recent Developments
- 17.2.9.5. Financials (Based on Availability)
- 17.2.10 Seagrave Coatings Corp
- 17.2.10.1. Overview
- 17.2.10.2. Products
- 17.2.10.3. SWOT Analysis
- 17.2.10.4. Recent Developments
- 17.2.10.5. Financials (Based on Availability)
- 17.2.11 AkzoNobel NV
- 17.2.11.1. Overview
- 17.2.11.2. Products
- 17.2.11.3. SWOT Analysis
- 17.2.11.4. Recent Developments
- 17.2.11.5. Financials (Based on Availability)
- 17.2.12 Watson Coatings
- 17.2.12.1. Overview
- 17.2.12.2. Products
- 17.2.12.3. SWOT Analysis
- 17.2.12.4. Recent Developments
- 17.2.12.5. Financials (Based on Availability)
- 17.2.13 Ashland Coatings
- 17.2.13.1. Overview
- 17.2.13.2. Products
- 17.2.13.3. SWOT Analysis
- 17.2.13.4. Recent Developments
- 17.2.13.5. Financials (Based on Availability)
- 17.2.14 Keyland Polymer
- 17.2.14.1. Overview
- 17.2.14.2. Products
- 17.2.14.3. SWOT Analysis
- 17.2.14.4. Recent Developments
- 17.2.14.5. Financials (Based on Availability)
- 17.2.1 PPG Industries Inc
List of Figures
- Figure 1: Global UV-Cured Coatings Industry Revenue Breakdown (Billion, %) by Region 2024 & 2032
- Figure 2: Global UV-Cured Coatings Industry Volume Breakdown (K Tons, %) by Region 2024 & 2032
- Figure 3: North America UV-Cured Coatings Industry Revenue (Billion), by Country 2024 & 2032
- Figure 4: North America UV-Cured Coatings Industry Volume (K Tons), by Country 2024 & 2032
- Figure 5: North America UV-Cured Coatings Industry Revenue Share (%), by Country 2024 & 2032
- Figure 6: North America UV-Cured Coatings Industry Volume Share (%), by Country 2024 & 2032
- Figure 7: Europe UV-Cured Coatings Industry Revenue (Billion), by Country 2024 & 2032
- Figure 8: Europe UV-Cured Coatings Industry Volume (K Tons), by Country 2024 & 2032
- Figure 9: Europe UV-Cured Coatings Industry Revenue Share (%), by Country 2024 & 2032
- Figure 10: Europe UV-Cured Coatings Industry Volume Share (%), by Country 2024 & 2032
- Figure 11: Asia Pacific UV-Cured Coatings Industry Revenue (Billion), by Country 2024 & 2032
- Figure 12: Asia Pacific UV-Cured Coatings Industry Volume (K Tons), by Country 2024 & 2032
- Figure 13: Asia Pacific UV-Cured Coatings Industry Revenue Share (%), by Country 2024 & 2032
- Figure 14: Asia Pacific UV-Cured Coatings Industry Volume Share (%), by Country 2024 & 2032
- Figure 15: South America UV-Cured Coatings Industry Revenue (Billion), by Country 2024 & 2032
- Figure 16: South America UV-Cured Coatings Industry Volume (K Tons), by Country 2024 & 2032
- Figure 17: South America UV-Cured Coatings Industry Revenue Share (%), by Country 2024 & 2032
- Figure 18: South America UV-Cured Coatings Industry Volume Share (%), by Country 2024 & 2032
- Figure 19: MEA UV-Cured Coatings Industry Revenue (Billion), by Country 2024 & 2032
- Figure 20: MEA UV-Cured Coatings Industry Volume (K Tons), by Country 2024 & 2032
- Figure 21: MEA UV-Cured Coatings Industry Revenue Share (%), by Country 2024 & 2032
- Figure 22: MEA UV-Cured Coatings Industry Volume Share (%), by Country 2024 & 2032
- Figure 23: Asia Pacific UV-Cured Coatings Industry Revenue (Billion), by Resin Type 2024 & 2032
- Figure 24: Asia Pacific UV-Cured Coatings Industry Volume (K Tons), by Resin Type 2024 & 2032
- Figure 25: Asia Pacific UV-Cured Coatings Industry Revenue Share (%), by Resin Type 2024 & 2032
- Figure 26: Asia Pacific UV-Cured Coatings Industry Volume Share (%), by Resin Type 2024 & 2032
- Figure 27: Asia Pacific UV-Cured Coatings Industry Revenue (Billion), by Application 2024 & 2032
- Figure 28: Asia Pacific UV-Cured Coatings Industry Volume (K Tons), by Application 2024 & 2032
- Figure 29: Asia Pacific UV-Cured Coatings Industry Revenue Share (%), by Application 2024 & 2032
- Figure 30: Asia Pacific UV-Cured Coatings Industry Volume Share (%), by Application 2024 & 2032
- Figure 31: Asia Pacific UV-Cured Coatings Industry Revenue (Billion), by Country 2024 & 2032
- Figure 32: Asia Pacific UV-Cured Coatings Industry Volume (K Tons), by Country 2024 & 2032
- Figure 33: Asia Pacific UV-Cured Coatings Industry Revenue Share (%), by Country 2024 & 2032
- Figure 34: Asia Pacific UV-Cured Coatings Industry Volume Share (%), by Country 2024 & 2032
- Figure 35: North America UV-Cured Coatings Industry Revenue (Billion), by Resin Type 2024 & 2032
- Figure 36: North America UV-Cured Coatings Industry Volume (K Tons), by Resin Type 2024 & 2032
- Figure 37: North America UV-Cured Coatings Industry Revenue Share (%), by Resin Type 2024 & 2032
- Figure 38: North America UV-Cured Coatings Industry Volume Share (%), by Resin Type 2024 & 2032
- Figure 39: North America UV-Cured Coatings Industry Revenue (Billion), by Application 2024 & 2032
- Figure 40: North America UV-Cured Coatings Industry Volume (K Tons), by Application 2024 & 2032
- Figure 41: North America UV-Cured Coatings Industry Revenue Share (%), by Application 2024 & 2032
- Figure 42: North America UV-Cured Coatings Industry Volume Share (%), by Application 2024 & 2032
- Figure 43: North America UV-Cured Coatings Industry Revenue (Billion), by Country 2024 & 2032
- Figure 44: North America UV-Cured Coatings Industry Volume (K Tons), by Country 2024 & 2032
- Figure 45: North America UV-Cured Coatings Industry Revenue Share (%), by Country 2024 & 2032
- Figure 46: North America UV-Cured Coatings Industry Volume Share (%), by Country 2024 & 2032
- Figure 47: Europe UV-Cured Coatings Industry Revenue (Billion), by Resin Type 2024 & 2032
- Figure 48: Europe UV-Cured Coatings Industry Volume (K Tons), by Resin Type 2024 & 2032
- Figure 49: Europe UV-Cured Coatings Industry Revenue Share (%), by Resin Type 2024 & 2032
- Figure 50: Europe UV-Cured Coatings Industry Volume Share (%), by Resin Type 2024 & 2032
- Figure 51: Europe UV-Cured Coatings Industry Revenue (Billion), by Application 2024 & 2032
- Figure 52: Europe UV-Cured Coatings Industry Volume (K Tons), by Application 2024 & 2032
- Figure 53: Europe UV-Cured Coatings Industry Revenue Share (%), by Application 2024 & 2032
- Figure 54: Europe UV-Cured Coatings Industry Volume Share (%), by Application 2024 & 2032
- Figure 55: Europe UV-Cured Coatings Industry Revenue (Billion), by Country 2024 & 2032
- Figure 56: Europe UV-Cured Coatings Industry Volume (K Tons), by Country 2024 & 2032
- Figure 57: Europe UV-Cured Coatings Industry Revenue Share (%), by Country 2024 & 2032
- Figure 58: Europe UV-Cured Coatings Industry Volume Share (%), by Country 2024 & 2032
- Figure 59: South America UV-Cured Coatings Industry Revenue (Billion), by Resin Type 2024 & 2032
- Figure 60: South America UV-Cured Coatings Industry Volume (K Tons), by Resin Type 2024 & 2032
- Figure 61: South America UV-Cured Coatings Industry Revenue Share (%), by Resin Type 2024 & 2032
- Figure 62: South America UV-Cured Coatings Industry Volume Share (%), by Resin Type 2024 & 2032
- Figure 63: South America UV-Cured Coatings Industry Revenue (Billion), by Application 2024 & 2032
- Figure 64: South America UV-Cured Coatings Industry Volume (K Tons), by Application 2024 & 2032
- Figure 65: South America UV-Cured Coatings Industry Revenue Share (%), by Application 2024 & 2032
- Figure 66: South America UV-Cured Coatings Industry Volume Share (%), by Application 2024 & 2032
- Figure 67: South America UV-Cured Coatings Industry Revenue (Billion), by Country 2024 & 2032
- Figure 68: South America UV-Cured Coatings Industry Volume (K Tons), by Country 2024 & 2032
- Figure 69: South America UV-Cured Coatings Industry Revenue Share (%), by Country 2024 & 2032
- Figure 70: South America UV-Cured Coatings Industry Volume Share (%), by Country 2024 & 2032
- Figure 71: Middle East UV-Cured Coatings Industry Revenue (Billion), by Resin Type 2024 & 2032
- Figure 72: Middle East UV-Cured Coatings Industry Volume (K Tons), by Resin Type 2024 & 2032
- Figure 73: Middle East UV-Cured Coatings Industry Revenue Share (%), by Resin Type 2024 & 2032
- Figure 74: Middle East UV-Cured Coatings Industry Volume Share (%), by Resin Type 2024 & 2032
- Figure 75: Middle East UV-Cured Coatings Industry Revenue (Billion), by Application 2024 & 2032
- Figure 76: Middle East UV-Cured Coatings Industry Volume (K Tons), by Application 2024 & 2032
- Figure 77: Middle East UV-Cured Coatings Industry Revenue Share (%), by Application 2024 & 2032
- Figure 78: Middle East UV-Cured Coatings Industry Volume Share (%), by Application 2024 & 2032
- Figure 79: Middle East UV-Cured Coatings Industry Revenue (Billion), by Country 2024 & 2032
- Figure 80: Middle East UV-Cured Coatings Industry Volume (K Tons), by Country 2024 & 2032
- Figure 81: Middle East UV-Cured Coatings Industry Revenue Share (%), by Country 2024 & 2032
- Figure 82: Middle East UV-Cured Coatings Industry Volume Share (%), by Country 2024 & 2032
- Figure 83: Saudi Arabia UV-Cured Coatings Industry Revenue (Billion), by Resin Type 2024 & 2032
- Figure 84: Saudi Arabia UV-Cured Coatings Industry Volume (K Tons), by Resin Type 2024 & 2032
- Figure 85: Saudi Arabia UV-Cured Coatings Industry Revenue Share (%), by Resin Type 2024 & 2032
- Figure 86: Saudi Arabia UV-Cured Coatings Industry Volume Share (%), by Resin Type 2024 & 2032
- Figure 87: Saudi Arabia UV-Cured Coatings Industry Revenue (Billion), by Application 2024 & 2032
- Figure 88: Saudi Arabia UV-Cured Coatings Industry Volume (K Tons), by Application 2024 & 2032
- Figure 89: Saudi Arabia UV-Cured Coatings Industry Revenue Share (%), by Application 2024 & 2032
- Figure 90: Saudi Arabia UV-Cured Coatings Industry Volume Share (%), by Application 2024 & 2032
- Figure 91: Saudi Arabia UV-Cured Coatings Industry Revenue (Billion), by Country 2024 & 2032
- Figure 92: Saudi Arabia UV-Cured Coatings Industry Volume (K Tons), by Country 2024 & 2032
- Figure 93: Saudi Arabia UV-Cured Coatings Industry Revenue Share (%), by Country 2024 & 2032
- Figure 94: Saudi Arabia UV-Cured Coatings Industry Volume Share (%), by Country 2024 & 2032
List of Tables
- Table 1: Global UV-Cured Coatings Industry Revenue Billion Forecast, by Region 2019 & 2032
- Table 2: Global UV-Cured Coatings Industry Volume K Tons Forecast, by Region 2019 & 2032
- Table 3: Global UV-Cured Coatings Industry Revenue Billion Forecast, by Resin Type 2019 & 2032
- Table 4: Global UV-Cured Coatings Industry Volume K Tons Forecast, by Resin Type 2019 & 2032
- Table 5: Global UV-Cured Coatings Industry Revenue Billion Forecast, by Application 2019 & 2032
- Table 6: Global UV-Cured Coatings Industry Volume K Tons Forecast, by Application 2019 & 2032
- Table 7: Global UV-Cured Coatings Industry Revenue Billion Forecast, by Region 2019 & 2032
- Table 8: Global UV-Cured Coatings Industry Volume K Tons Forecast, by Region 2019 & 2032
- Table 9: Global UV-Cured Coatings Industry Revenue Billion Forecast, by Country 2019 & 2032
- Table 10: Global UV-Cured Coatings Industry Volume K Tons Forecast, by Country 2019 & 2032
- Table 11: United States UV-Cured Coatings Industry Revenue (Billion) Forecast, by Application 2019 & 2032
- Table 12: United States UV-Cured Coatings Industry Volume (K Tons) Forecast, by Application 2019 & 2032
- Table 13: Canada UV-Cured Coatings Industry Revenue (Billion) Forecast, by Application 2019 & 2032
- Table 14: Canada UV-Cured Coatings Industry Volume (K Tons) Forecast, by Application 2019 & 2032
- Table 15: Mexico UV-Cured Coatings Industry Revenue (Billion) Forecast, by Application 2019 & 2032
- Table 16: Mexico UV-Cured Coatings Industry Volume (K Tons) Forecast, by Application 2019 & 2032
- Table 17: Global UV-Cured Coatings Industry Revenue Billion Forecast, by Country 2019 & 2032
- Table 18: Global UV-Cured Coatings Industry Volume K Tons Forecast, by Country 2019 & 2032
- Table 19: Germany UV-Cured Coatings Industry Revenue (Billion) Forecast, by Application 2019 & 2032
- Table 20: Germany UV-Cured Coatings Industry Volume (K Tons) Forecast, by Application 2019 & 2032
- Table 21: France UV-Cured Coatings Industry Revenue (Billion) Forecast, by Application 2019 & 2032
- Table 22: France UV-Cured Coatings Industry Volume (K Tons) Forecast, by Application 2019 & 2032
- Table 23: Italy UV-Cured Coatings Industry Revenue (Billion) Forecast, by Application 2019 & 2032
- Table 24: Italy UV-Cured Coatings Industry Volume (K Tons) Forecast, by Application 2019 & 2032
- Table 25: United Kingdom UV-Cured Coatings Industry Revenue (Billion) Forecast, by Application 2019 & 2032
- Table 26: United Kingdom UV-Cured Coatings Industry Volume (K Tons) Forecast, by Application 2019 & 2032
- Table 27: Netherlands UV-Cured Coatings Industry Revenue (Billion) Forecast, by Application 2019 & 2032
- Table 28: Netherlands UV-Cured Coatings Industry Volume (K Tons) Forecast, by Application 2019 & 2032
- Table 29: Rest of Europe UV-Cured Coatings Industry Revenue (Billion) Forecast, by Application 2019 & 2032
- Table 30: Rest of Europe UV-Cured Coatings Industry Volume (K Tons) Forecast, by Application 2019 & 2032
- Table 31: Global UV-Cured Coatings Industry Revenue Billion Forecast, by Country 2019 & 2032
- Table 32: Global UV-Cured Coatings Industry Volume K Tons Forecast, by Country 2019 & 2032
- Table 33: China UV-Cured Coatings Industry Revenue (Billion) Forecast, by Application 2019 & 2032
- Table 34: China UV-Cured Coatings Industry Volume (K Tons) Forecast, by Application 2019 & 2032
- Table 35: Japan UV-Cured Coatings Industry Revenue (Billion) Forecast, by Application 2019 & 2032
- Table 36: Japan UV-Cured Coatings Industry Volume (K Tons) Forecast, by Application 2019 & 2032
- Table 37: India UV-Cured Coatings Industry Revenue (Billion) Forecast, by Application 2019 & 2032
- Table 38: India UV-Cured Coatings Industry Volume (K Tons) Forecast, by Application 2019 & 2032
- Table 39: South Korea UV-Cured Coatings Industry Revenue (Billion) Forecast, by Application 2019 & 2032
- Table 40: South Korea UV-Cured Coatings Industry Volume (K Tons) Forecast, by Application 2019 & 2032
- Table 41: Taiwan UV-Cured Coatings Industry Revenue (Billion) Forecast, by Application 2019 & 2032
- Table 42: Taiwan UV-Cured Coatings Industry Volume (K Tons) Forecast, by Application 2019 & 2032
- Table 43: Australia UV-Cured Coatings Industry Revenue (Billion) Forecast, by Application 2019 & 2032
- Table 44: Australia UV-Cured Coatings Industry Volume (K Tons) Forecast, by Application 2019 & 2032
- Table 45: Rest of Asia-Pacific UV-Cured Coatings Industry Revenue (Billion) Forecast, by Application 2019 & 2032
- Table 46: Rest of Asia-Pacific UV-Cured Coatings Industry Volume (K Tons) Forecast, by Application 2019 & 2032
- Table 47: Global UV-Cured Coatings Industry Revenue Billion Forecast, by Country 2019 & 2032
- Table 48: Global UV-Cured Coatings Industry Volume K Tons Forecast, by Country 2019 & 2032
- Table 49: Brazil UV-Cured Coatings Industry Revenue (Billion) Forecast, by Application 2019 & 2032
- Table 50: Brazil UV-Cured Coatings Industry Volume (K Tons) Forecast, by Application 2019 & 2032
- Table 51: Argentina UV-Cured Coatings Industry Revenue (Billion) Forecast, by Application 2019 & 2032
- Table 52: Argentina UV-Cured Coatings Industry Volume (K Tons) Forecast, by Application 2019 & 2032
- Table 53: Rest of South America UV-Cured Coatings Industry Revenue (Billion) Forecast, by Application 2019 & 2032
- Table 54: Rest of South America UV-Cured Coatings Industry Volume (K Tons) Forecast, by Application 2019 & 2032
- Table 55: Global UV-Cured Coatings Industry Revenue Billion Forecast, by Country 2019 & 2032
- Table 56: Global UV-Cured Coatings Industry Volume K Tons Forecast, by Country 2019 & 2032
- Table 57: Middle East UV-Cured Coatings Industry Revenue (Billion) Forecast, by Application 2019 & 2032
- Table 58: Middle East UV-Cured Coatings Industry Volume (K Tons) Forecast, by Application 2019 & 2032
- Table 59: Africa UV-Cured Coatings Industry Revenue (Billion) Forecast, by Application 2019 & 2032
- Table 60: Africa UV-Cured Coatings Industry Volume (K Tons) Forecast, by Application 2019 & 2032
- Table 61: Global UV-Cured Coatings Industry Revenue Billion Forecast, by Resin Type 2019 & 2032
- Table 62: Global UV-Cured Coatings Industry Volume K Tons Forecast, by Resin Type 2019 & 2032
- Table 63: Global UV-Cured Coatings Industry Revenue Billion Forecast, by Application 2019 & 2032
- Table 64: Global UV-Cured Coatings Industry Volume K Tons Forecast, by Application 2019 & 2032
- Table 65: Global UV-Cured Coatings Industry Revenue Billion Forecast, by Country 2019 & 2032
- Table 66: Global UV-Cured Coatings Industry Volume K Tons Forecast, by Country 2019 & 2032
- Table 67: China UV-Cured Coatings Industry Revenue (Billion) Forecast, by Application 2019 & 2032
- Table 68: China UV-Cured Coatings Industry Volume (K Tons) Forecast, by Application 2019 & 2032
- Table 69: India UV-Cured Coatings Industry Revenue (Billion) Forecast, by Application 2019 & 2032
- Table 70: India UV-Cured Coatings Industry Volume (K Tons) Forecast, by Application 2019 & 2032
- Table 71: Japan UV-Cured Coatings Industry Revenue (Billion) Forecast, by Application 2019 & 2032
- Table 72: Japan UV-Cured Coatings Industry Volume (K Tons) Forecast, by Application 2019 & 2032
- Table 73: South Korea UV-Cured Coatings Industry Revenue (Billion) Forecast, by Application 2019 & 2032
- Table 74: South Korea UV-Cured Coatings Industry Volume (K Tons) Forecast, by Application 2019 & 2032
- Table 75: Rest of Asia Pacific UV-Cured Coatings Industry Revenue (Billion) Forecast, by Application 2019 & 2032
- Table 76: Rest of Asia Pacific UV-Cured Coatings Industry Volume (K Tons) Forecast, by Application 2019 & 2032
- Table 77: Global UV-Cured Coatings Industry Revenue Billion Forecast, by Resin Type 2019 & 2032
- Table 78: Global UV-Cured Coatings Industry Volume K Tons Forecast, by Resin Type 2019 & 2032
- Table 79: Global UV-Cured Coatings Industry Revenue Billion Forecast, by Application 2019 & 2032
- Table 80: Global UV-Cured Coatings Industry Volume K Tons Forecast, by Application 2019 & 2032
- Table 81: Global UV-Cured Coatings Industry Revenue Billion Forecast, by Country 2019 & 2032
- Table 82: Global UV-Cured Coatings Industry Volume K Tons Forecast, by Country 2019 & 2032
- Table 83: United States UV-Cured Coatings Industry Revenue (Billion) Forecast, by Application 2019 & 2032
- Table 84: United States UV-Cured Coatings Industry Volume (K Tons) Forecast, by Application 2019 & 2032
- Table 85: Canada UV-Cured Coatings Industry Revenue (Billion) Forecast, by Application 2019 & 2032
- Table 86: Canada UV-Cured Coatings Industry Volume (K Tons) Forecast, by Application 2019 & 2032
- Table 87: Mexico UV-Cured Coatings Industry Revenue (Billion) Forecast, by Application 2019 & 2032
- Table 88: Mexico UV-Cured Coatings Industry Volume (K Tons) Forecast, by Application 2019 & 2032
- Table 89: Global UV-Cured Coatings Industry Revenue Billion Forecast, by Resin Type 2019 & 2032
- Table 90: Global UV-Cured Coatings Industry Volume K Tons Forecast, by Resin Type 2019 & 2032
- Table 91: Global UV-Cured Coatings Industry Revenue Billion Forecast, by Application 2019 & 2032
- Table 92: Global UV-Cured Coatings Industry Volume K Tons Forecast, by Application 2019 & 2032
- Table 93: Global UV-Cured Coatings Industry Revenue Billion Forecast, by Country 2019 & 2032
- Table 94: Global UV-Cured Coatings Industry Volume K Tons Forecast, by Country 2019 & 2032
- Table 95: Germany UV-Cured Coatings Industry Revenue (Billion) Forecast, by Application 2019 & 2032
- Table 96: Germany UV-Cured Coatings Industry Volume (K Tons) Forecast, by Application 2019 & 2032
- Table 97: United Kingdom UV-Cured Coatings Industry Revenue (Billion) Forecast, by Application 2019 & 2032
- Table 98: United Kingdom UV-Cured Coatings Industry Volume (K Tons) Forecast, by Application 2019 & 2032
- Table 99: France UV-Cured Coatings Industry Revenue (Billion) Forecast, by Application 2019 & 2032
- Table 100: France UV-Cured Coatings Industry Volume (K Tons) Forecast, by Application 2019 & 2032
- Table 101: Italy UV-Cured Coatings Industry Revenue (Billion) Forecast, by Application 2019 & 2032
- Table 102: Italy UV-Cured Coatings Industry Volume (K Tons) Forecast, by Application 2019 & 2032
- Table 103: Rest of Europe UV-Cured Coatings Industry Revenue (Billion) Forecast, by Application 2019 & 2032
- Table 104: Rest of Europe UV-Cured Coatings Industry Volume (K Tons) Forecast, by Application 2019 & 2032
- Table 105: Global UV-Cured Coatings Industry Revenue Billion Forecast, by Resin Type 2019 & 2032
- Table 106: Global UV-Cured Coatings Industry Volume K Tons Forecast, by Resin Type 2019 & 2032
- Table 107: Global UV-Cured Coatings Industry Revenue Billion Forecast, by Application 2019 & 2032
- Table 108: Global UV-Cured Coatings Industry Volume K Tons Forecast, by Application 2019 & 2032
- Table 109: Global UV-Cured Coatings Industry Revenue Billion Forecast, by Country 2019 & 2032
- Table 110: Global UV-Cured Coatings Industry Volume K Tons Forecast, by Country 2019 & 2032
- Table 111: Brazil UV-Cured Coatings Industry Revenue (Billion) Forecast, by Application 2019 & 2032
- Table 112: Brazil UV-Cured Coatings Industry Volume (K Tons) Forecast, by Application 2019 & 2032
- Table 113: Argentina UV-Cured Coatings Industry Revenue (Billion) Forecast, by Application 2019 & 2032
- Table 114: Argentina UV-Cured Coatings Industry Volume (K Tons) Forecast, by Application 2019 & 2032
- Table 115: Rest of South America UV-Cured Coatings Industry Revenue (Billion) Forecast, by Application 2019 & 2032
- Table 116: Rest of South America UV-Cured Coatings Industry Volume (K Tons) Forecast, by Application 2019 & 2032
- Table 117: Global UV-Cured Coatings Industry Revenue Billion Forecast, by Resin Type 2019 & 2032
- Table 118: Global UV-Cured Coatings Industry Volume K Tons Forecast, by Resin Type 2019 & 2032
- Table 119: Global UV-Cured Coatings Industry Revenue Billion Forecast, by Application 2019 & 2032
- Table 120: Global UV-Cured Coatings Industry Volume K Tons Forecast, by Application 2019 & 2032
- Table 121: Global UV-Cured Coatings Industry Revenue Billion Forecast, by Country 2019 & 2032
- Table 122: Global UV-Cured Coatings Industry Volume K Tons Forecast, by Country 2019 & 2032
- Table 123: Global UV-Cured Coatings Industry Revenue Billion Forecast, by Resin Type 2019 & 2032
- Table 124: Global UV-Cured Coatings Industry Volume K Tons Forecast, by Resin Type 2019 & 2032
- Table 125: Global UV-Cured Coatings Industry Revenue Billion Forecast, by Application 2019 & 2032
- Table 126: Global UV-Cured Coatings Industry Volume K Tons Forecast, by Application 2019 & 2032
- Table 127: Global UV-Cured Coatings Industry Revenue Billion Forecast, by Country 2019 & 2032
- Table 128: Global UV-Cured Coatings Industry Volume K Tons Forecast, by Country 2019 & 2032
- Table 129: South Africa UV-Cured Coatings Industry Revenue (Billion) Forecast, by Application 2019 & 2032
- Table 130: South Africa UV-Cured Coatings Industry Volume (K Tons) Forecast, by Application 2019 & 2032
- Table 131: Rest of Middle East UV-Cured Coatings Industry Revenue (Billion) Forecast, by Application 2019 & 2032
- Table 132: Rest of Middle East UV-Cured Coatings Industry Volume (K Tons) Forecast, by Application 2019 & 2032
Frequently Asked Questions
1. What is the projected Compound Annual Growth Rate (CAGR) of the UV-Cured Coatings Industry?
The projected CAGR is approximately 3.41%.
2. Which companies are prominent players in the UV-Cured Coatings Industry?
Key companies in the market include PPG Industries Inc, Cardinal Paint, Master Bond Inc, Red Spot Paint & Varnish Company, Jainco Industry Chemicals, Dymax Corp, Protech Powder Coatings Inc, Nippon Paint, Sherwin-Williams Co, Seagrave Coatings Corp, AkzoNobel NV, Watson Coatings, Ashland Coatings, Keyland Polymer.
3. What are the main segments of the UV-Cured Coatings Industry?
The market segments include Resin Type, Application.
4. Can you provide details about the market size?
The market size is estimated to be USD 5 Billion as of 2022.
5. What are some drivers contributing to market growth?
Increasing Demand for Wood Finishings; Other Drivers.
6. What are the notable trends driving market growth?
The Automotive Industry is Expected to Dominate the Market.
7. Are there any restraints impacting market growth?
High Initial Costs of Equipment; Difficulty in Finishing Complex 3D Objects.
8. Can you provide examples of recent developments in the market?
February 2023: Beckers, a global company in coil coatings, developed the first commercial paint formulations for dual ultraviolet and electron-beam curing in the coil coating market.
9. What pricing options are available for accessing the report?
Pricing options include single-user, multi-user, and enterprise licenses priced at USD 3,950, USD 4,950, and USD 6,950 respectively.
10. Is the market size provided in terms of value or volume?
The market size is provided in terms of value, measured in Billion and volume, measured in K Tons.
11. Are there any specific market keywords associated with the report?
Yes, the market keyword associated with the report is "UV-Cured Coatings Industry," which aids in identifying and referencing the specific market segment covered.
12. How do I determine which pricing option suits my needs best?
The pricing options vary based on user requirements and access needs. Individual users may opt for single-user licenses, while businesses requiring broader access may choose multi-user or enterprise licenses for cost-effective access to the report.
13. Are there any additional resources or data provided in the UV-Cured Coatings Industry report?
While the report offers comprehensive insights, it's advisable to review the specific contents or supplementary materials provided to ascertain if additional resources or data are available.
14. How can I stay updated on further developments or reports in the UV-Cured Coatings Industry?
To stay informed about further developments, trends, and reports in the UV-Cured Coatings Industry, consider subscribing to industry newsletters, following relevant companies and organizations, or regularly checking reputable industry news sources and publications.
Methodology
Step 1 - Identification of Relevant Samples Size from Population Database


Step 2 - Approaches for Defining Global Market Size (Value, Volume* & Price*)

Note*: In applicable scenarios
Step 3 - Data Sources
Primary Research
- Web Analytics
- Survey Reports
- Research Institute
- Latest Research Reports
- Opinion Leaders
Secondary Research
- Annual Reports
- White Paper
- Latest Press Release
- Industry Association
- Paid Database
- Investor Presentations

Step 4 - Data Triangulation
Involves using different sources of information in order to increase the validity of a study
These sources are likely to be stakeholders in a program - participants, other researchers, program staff, other community members, and so on.
Then we put all data in single framework & apply various statistical tools to find out the dynamic on the market.
During the analysis stage, feedback from the stakeholder groups would be compared to determine areas of agreement as well as areas of divergence
