

Key Insights
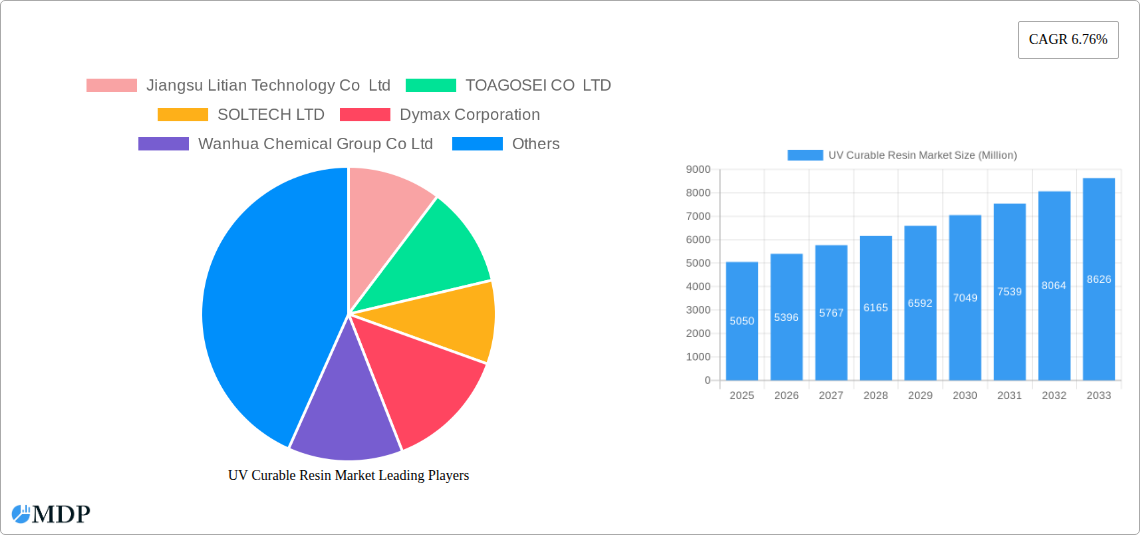
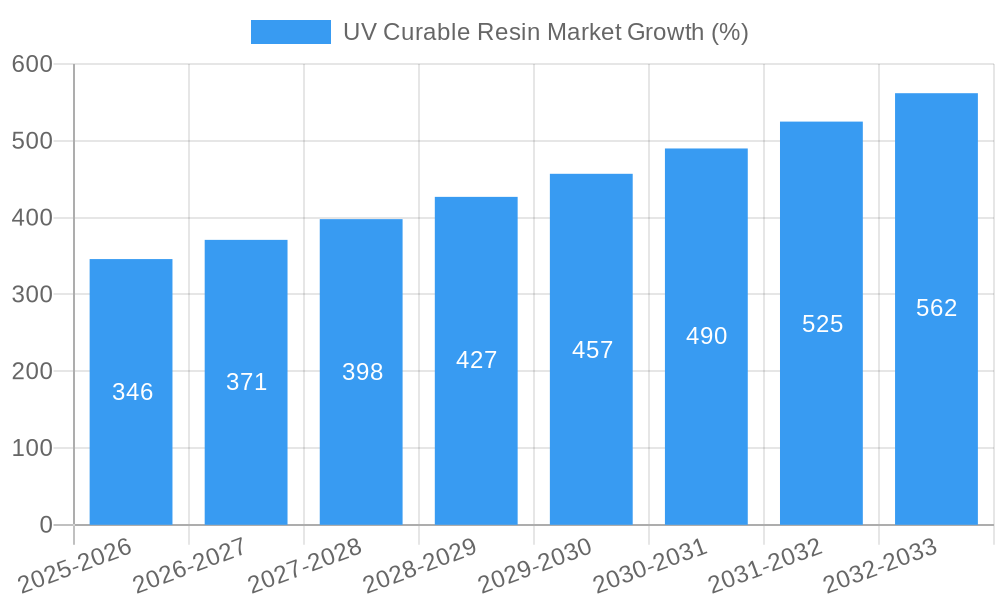
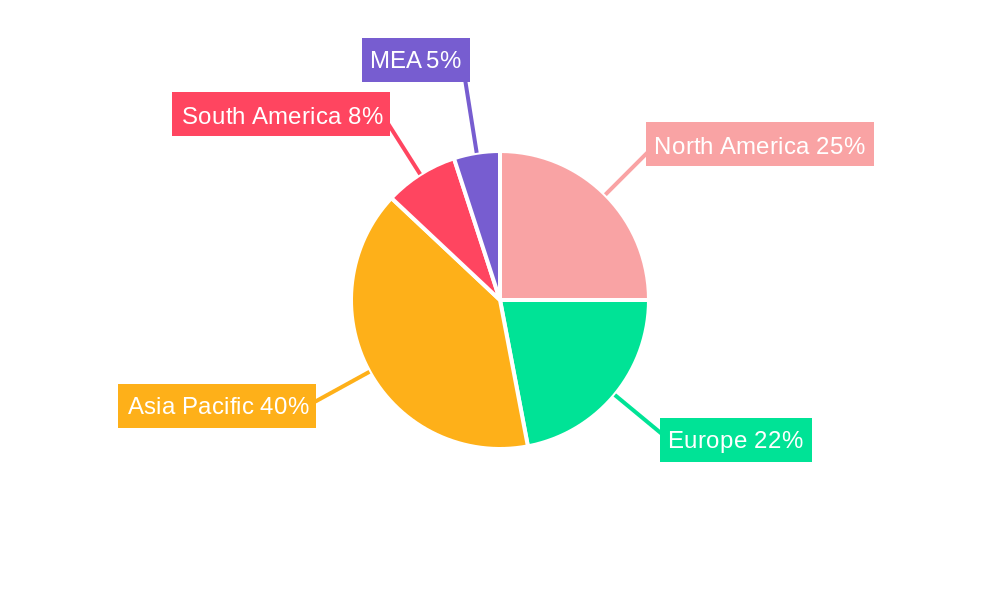
The UV curable resin market, valued at $5.05 billion in 2025, is projected to experience robust growth, driven by the increasing demand for high-performance coatings and adhesives across diverse industries. A compound annual growth rate (CAGR) of 6.76% from 2025 to 2033 indicates a significant market expansion, fueled by several key factors. The rising adoption of UV curing technology in electronics manufacturing, owing to its speed, efficiency, and low environmental impact, is a primary driver. The automotive industry's shift towards lightweighting and enhanced aesthetics further contributes to market growth, with UV curable resins playing a crucial role in high-quality coatings and sealants. The packaging sector's increasing demand for durable and aesthetically pleasing solutions also boosts market expansion. Segment-wise, acrylated urethanes and epoxies are expected to maintain significant market share due to their superior performance characteristics. Geographically, Asia-Pacific, particularly China and India, are poised for substantial growth, driven by expanding manufacturing sectors and increasing infrastructure development. However, price volatility of raw materials and potential environmental regulations could pose challenges to market growth.
The market segmentation reveals diverse application areas, with coatings, printing, adhesives and sealants leading the way. Within end-user industries, electronics, industrial coatings, and automotive sectors show the highest demand for UV curable resins. The selection of resin type (e.g., acrylated epoxies, polyesters, urethanes) is largely dictated by specific application requirements, including cure speed, flexibility, and chemical resistance. Leading companies like BASF, Arkema, and DSM are driving innovation in resin formulations, focusing on improved performance and sustainability. The competitive landscape is characterized by both established players and emerging regional manufacturers. The forecast period of 2025-2033 promises a period of significant growth, driven by technological advancements, expanding applications, and robust economic growth in key regions. However, companies must navigate the challenges of raw material pricing and environmental sustainability to fully capitalize on market opportunities.
Dive Deep into the Thriving UV Curable Resin Market: A Comprehensive Report (2019-2033)
This comprehensive report provides an in-depth analysis of the UV Curable Resin market, offering invaluable insights for industry stakeholders, investors, and strategic decision-makers. With a study period spanning 2019-2033, a base year of 2025, and a forecast period of 2025-2033, this report unveils the market's dynamics, trends, and future potential. The market size is projected to reach xx Million by 2033, exhibiting a CAGR of xx% during the forecast period. This report covers key segments including Application (Coating, Printing, Adhesives and Sealants, Others), End-user Industry (Electronics, Industrial Coatings, Medical, Automotive, Packaging), Resin Type (Acrylated Epoxies, Acrylated Polysters, Acrylated Urethanes, Acrylated Silicones, Others), and Composition (Monomers, Photoinitiators, Oligomers, Coinitiators). Leading players like Jiangsu Litian Technology Co Ltd, TOAGOSEI CO LTD, SOLTECH LTD, Dymax Corporation, Wanhua Chemical Group Co Ltd, BASF SE, Arkema Group, DSM, Resonac Holdings Corporation, Nippon-Gohsei, Allnex, Covestro AG, DIC CORPORATION, Eternal Materials Co Ltd, and IGM Resins are thoroughly analyzed.
UV Curable Resin Market Market Dynamics & Concentration
The UV Curable Resin market is characterized by a moderately consolidated landscape, with a few major players holding significant market share. Market concentration is influenced by factors such as technological advancements, regulatory changes, and the emergence of new applications. Innovation in photoinitiator chemistry and resin formulations drives market growth, while stringent environmental regulations necessitate the development of more sustainable products. The market witnesses considerable M&A activity, with xx deals recorded between 2019 and 2024, indicating consolidation and expansion strategies among key players. The top 5 players collectively account for approximately xx% of the global market share in 2025.
- Market Share: Top 5 players – xx%; Top 10 players – xx%
- M&A Activity: xx deals between 2019-2024.
- Innovation Drivers: Development of high-performance resins, eco-friendly formulations, and advanced curing technologies.
- Regulatory Frameworks: Stringent environmental regulations impacting raw material sourcing and manufacturing processes.
- Product Substitutes: Growing competition from alternative curing technologies, such as electron beam curing.
- End-User Trends: Increasing demand from electronics, automotive, and medical industries driving market expansion.
UV Curable Resin Market Industry Trends & Analysis
The UV Curable Resin market is experiencing robust growth, driven by several key factors. The increasing demand for high-performance coatings, adhesives, and sealants across various industries, coupled with the advantages of UV curing technology such as rapid curing times, low energy consumption, and high throughput, fuels market expansion. Technological advancements, such as the development of novel resin chemistries and improved photoinitiators, further enhance the performance and versatility of UV curable resins. Consumer preference for durable and aesthetically pleasing products also contributes to market growth. However, price fluctuations in raw materials and increasing competition from other curing technologies pose challenges. The market is projected to witness a CAGR of xx% during the forecast period, with significant market penetration in emerging economies.
Leading Markets & Segments in UV Curable Resin Market
The Asia Pacific region dominates the global UV Curable Resin market, driven by strong economic growth, expanding manufacturing sectors, and increasing demand from electronics and automotive industries. Within this region, China and Japan are the leading countries. The Coating application segment holds the largest market share, followed by Adhesives and Sealants. In terms of resin type, Acrylated Urethanes and Acrylated Epoxies are currently dominant.
Key Drivers in Asia Pacific:
- Rapid industrialization and infrastructure development
- Growing electronics and automotive industries
- Favorable government policies promoting manufacturing
Dominant Segments:
- Application: Coating (xx Million)
- End-user Industry: Electronics (xx Million)
- Resin Type: Acrylated Urethanes (xx Million)
UV Curable Resin Market Product Developments
Recent product developments in the UV Curable Resin market focus on enhancing performance characteristics, such as improved adhesion, durability, and chemical resistance. Companies are also focusing on developing environmentally friendly formulations with reduced VOC emissions and enhanced biodegradability. These innovations cater to the growing demand for sustainable and high-performance materials in various industries. New product launches with unique properties are driving the market competition.
Key Drivers of UV Curable Resin Market Growth
Several key factors are driving the growth of the UV Curable Resin market. These include the increasing demand for high-performance coatings and adhesives, advancements in UV curing technology leading to faster curing times and higher throughput, and the rising adoption of UV curing in various industries, such as electronics, automotive, and medical devices. Government regulations promoting the use of environmentally friendly materials and the expanding global manufacturing base also contribute to market expansion.
Challenges in the UV Curable Resin Market Market
The UV Curable Resin market faces several challenges, including the volatility of raw material prices, stringent environmental regulations, and intense competition from alternative curing technologies. Supply chain disruptions can also impact production and profitability. These factors can lead to price fluctuations and potentially hinder market growth. The overall impact of these challenges is estimated to be a xx% reduction in market growth during xx.
Emerging Opportunities in UV Curable Resin Market
Emerging opportunities in the UV Curable Resin market include the development of specialized resins for niche applications, such as 3D printing and flexible electronics. Strategic partnerships and collaborations between resin manufacturers and equipment suppliers can also unlock new market opportunities. Furthermore, expanding into emerging markets with favorable growth prospects presents significant potential for future expansion.
Leading Players in the UV Curable Resin Market Sector
- BASF SE
- Arkema Group
- DSM
- Jiangsu Litian Technology Co Ltd
- TOAGOSEI CO LTD
- SOLTECH LTD
- Dymax Corporation
- Wanhua Chemical Group Co Ltd
- Resonac Holdings Corporation
- Nippon-Gohsei
- Allnex
- Covestro AG
- DIC CORPORATION
- Eternal Materials Co Ltd
- IGM Resins
Key Milestones in UV Curable Resin Market Industry
- 2021: Launch of a new generation of high-performance acrylate resin by BASF SE.
- 2022: Acquisition of a smaller resin manufacturer by a major player, leading to increased market consolidation.
- 2023: Introduction of a new UV curable resin specifically designed for 3D printing applications.
- 2024: Several key players announce investments in new manufacturing facilities to increase production capacity. (Further details will be provided in the final report)
Strategic Outlook for UV Curable Resin Market Market
The UV Curable Resin market is poised for continued growth, driven by technological advancements, increasing demand from various end-use industries, and strategic investments by key players. Companies focused on innovation, sustainable practices, and strategic partnerships are likely to experience strong growth in the coming years. Expanding into high-growth regions and developing niche applications will be crucial for maintaining a competitive advantage in this dynamic market.
UV Curable Resin Market Segmentation
-
1. Resin Type
- 1.1. Acrylated Epoxies
- 1.2. Acrylated Polysters
- 1.3. Acrylated Urethanes
- 1.4. Acrylated Silicones
- 1.5. Others
-
2. Composition
- 2.1. Monomers
- 2.2. Photoinitiators
- 2.3. Oligomers
- 2.4. Coinitiators
-
3. Application
- 3.1. Coating
- 3.2. Printing
- 3.3. Adhesives and Sealants
- 3.4. Others
-
4. End-user Industry
- 4.1. Electronics
- 4.2. Industrial Coatings
- 4.3. Medical
- 4.4. Automotive
- 4.5. Packaging
UV Curable Resin Market Segmentation By Geography
-
1. Asia Pacific
- 1.1. China
- 1.2. India
- 1.3. Japan
- 1.4. South Korea
- 1.5. Rest of Asia Pacific
-
2. North America
- 2.1. United States
- 2.2. Canada
- 2.3. Mexico
-
3. Europe
- 3.1. Germany
- 3.2. United Kingdom
- 3.3. Italy
- 3.4. France
- 3.5. Rest of Europe
-
4. South America
- 4.1. Brazil
- 4.2. Argentina
- 4.3. Rest of South America
-
5. Middle East and Africa
- 5.1. Saudi Arabia
- 5.2. South Africa
- 5.3. Rest of Middle East
UV Curable Resin Market REPORT HIGHLIGHTS
| Aspects | Details |
|---|---|
| Study Period | 2019-2033 |
| Base Year | 2024 |
| Estimated Year | 2025 |
| Forecast Period | 2025-2033 |
| Historical Period | 2019-2024 |
| Growth Rate | CAGR of 6.76% from 2019-2033 |
| Segmentation |
|
Table of Contents
- 1. Introduction
- 1.1. Research Scope
- 1.2. Market Segmentation
- 1.3. Research Methodology
- 1.4. Definitions and Assumptions
- 2. Executive Summary
- 2.1. Introduction
- 3. Market Dynamics
- 3.1. Introduction
- 3.2. Market Drivers
- 3.2.1. Increase in Use of Environment-Friendly Industrial Coatings; Rising Demand for UV Curable Inks in Packaging Application; Other Drivers
- 3.3. Market Restrains
- 3.3.1. High Initial Capital Cost; Other Restraints
- 3.4. Market Trends
- 3.4.1. Increasing Demand from Packaging Industry
- 4. Market Factor Analysis
- 4.1. Porters Five Forces
- 4.2. Supply/Value Chain
- 4.3. PESTEL analysis
- 4.4. Market Entropy
- 4.5. Patent/Trademark Analysis
- 5. Global UV Curable Resin Market Analysis, Insights and Forecast, 2019-2031
- 5.1. Market Analysis, Insights and Forecast - by Resin Type
- 5.1.1. Acrylated Epoxies
- 5.1.2. Acrylated Polysters
- 5.1.3. Acrylated Urethanes
- 5.1.4. Acrylated Silicones
- 5.1.5. Others
- 5.2. Market Analysis, Insights and Forecast - by Composition
- 5.2.1. Monomers
- 5.2.2. Photoinitiators
- 5.2.3. Oligomers
- 5.2.4. Coinitiators
- 5.3. Market Analysis, Insights and Forecast - by Application
- 5.3.1. Coating
- 5.3.2. Printing
- 5.3.3. Adhesives and Sealants
- 5.3.4. Others
- 5.4. Market Analysis, Insights and Forecast - by End-user Industry
- 5.4.1. Electronics
- 5.4.2. Industrial Coatings
- 5.4.3. Medical
- 5.4.4. Automotive
- 5.4.5. Packaging
- 5.5. Market Analysis, Insights and Forecast - by Region
- 5.5.1. Asia Pacific
- 5.5.2. North America
- 5.5.3. Europe
- 5.5.4. South America
- 5.5.5. Middle East and Africa
- 5.1. Market Analysis, Insights and Forecast - by Resin Type
- 6. Asia Pacific UV Curable Resin Market Analysis, Insights and Forecast, 2019-2031
- 6.1. Market Analysis, Insights and Forecast - by Resin Type
- 6.1.1. Acrylated Epoxies
- 6.1.2. Acrylated Polysters
- 6.1.3. Acrylated Urethanes
- 6.1.4. Acrylated Silicones
- 6.1.5. Others
- 6.2. Market Analysis, Insights and Forecast - by Composition
- 6.2.1. Monomers
- 6.2.2. Photoinitiators
- 6.2.3. Oligomers
- 6.2.4. Coinitiators
- 6.3. Market Analysis, Insights and Forecast - by Application
- 6.3.1. Coating
- 6.3.2. Printing
- 6.3.3. Adhesives and Sealants
- 6.3.4. Others
- 6.4. Market Analysis, Insights and Forecast - by End-user Industry
- 6.4.1. Electronics
- 6.4.2. Industrial Coatings
- 6.4.3. Medical
- 6.4.4. Automotive
- 6.4.5. Packaging
- 6.1. Market Analysis, Insights and Forecast - by Resin Type
- 7. North America UV Curable Resin Market Analysis, Insights and Forecast, 2019-2031
- 7.1. Market Analysis, Insights and Forecast - by Resin Type
- 7.1.1. Acrylated Epoxies
- 7.1.2. Acrylated Polysters
- 7.1.3. Acrylated Urethanes
- 7.1.4. Acrylated Silicones
- 7.1.5. Others
- 7.2. Market Analysis, Insights and Forecast - by Composition
- 7.2.1. Monomers
- 7.2.2. Photoinitiators
- 7.2.3. Oligomers
- 7.2.4. Coinitiators
- 7.3. Market Analysis, Insights and Forecast - by Application
- 7.3.1. Coating
- 7.3.2. Printing
- 7.3.3. Adhesives and Sealants
- 7.3.4. Others
- 7.4. Market Analysis, Insights and Forecast - by End-user Industry
- 7.4.1. Electronics
- 7.4.2. Industrial Coatings
- 7.4.3. Medical
- 7.4.4. Automotive
- 7.4.5. Packaging
- 7.1. Market Analysis, Insights and Forecast - by Resin Type
- 8. Europe UV Curable Resin Market Analysis, Insights and Forecast, 2019-2031
- 8.1. Market Analysis, Insights and Forecast - by Resin Type
- 8.1.1. Acrylated Epoxies
- 8.1.2. Acrylated Polysters
- 8.1.3. Acrylated Urethanes
- 8.1.4. Acrylated Silicones
- 8.1.5. Others
- 8.2. Market Analysis, Insights and Forecast - by Composition
- 8.2.1. Monomers
- 8.2.2. Photoinitiators
- 8.2.3. Oligomers
- 8.2.4. Coinitiators
- 8.3. Market Analysis, Insights and Forecast - by Application
- 8.3.1. Coating
- 8.3.2. Printing
- 8.3.3. Adhesives and Sealants
- 8.3.4. Others
- 8.4. Market Analysis, Insights and Forecast - by End-user Industry
- 8.4.1. Electronics
- 8.4.2. Industrial Coatings
- 8.4.3. Medical
- 8.4.4. Automotive
- 8.4.5. Packaging
- 8.1. Market Analysis, Insights and Forecast - by Resin Type
- 9. South America UV Curable Resin Market Analysis, Insights and Forecast, 2019-2031
- 9.1. Market Analysis, Insights and Forecast - by Resin Type
- 9.1.1. Acrylated Epoxies
- 9.1.2. Acrylated Polysters
- 9.1.3. Acrylated Urethanes
- 9.1.4. Acrylated Silicones
- 9.1.5. Others
- 9.2. Market Analysis, Insights and Forecast - by Composition
- 9.2.1. Monomers
- 9.2.2. Photoinitiators
- 9.2.3. Oligomers
- 9.2.4. Coinitiators
- 9.3. Market Analysis, Insights and Forecast - by Application
- 9.3.1. Coating
- 9.3.2. Printing
- 9.3.3. Adhesives and Sealants
- 9.3.4. Others
- 9.4. Market Analysis, Insights and Forecast - by End-user Industry
- 9.4.1. Electronics
- 9.4.2. Industrial Coatings
- 9.4.3. Medical
- 9.4.4. Automotive
- 9.4.5. Packaging
- 9.1. Market Analysis, Insights and Forecast - by Resin Type
- 10. Middle East and Africa UV Curable Resin Market Analysis, Insights and Forecast, 2019-2031
- 10.1. Market Analysis, Insights and Forecast - by Resin Type
- 10.1.1. Acrylated Epoxies
- 10.1.2. Acrylated Polysters
- 10.1.3. Acrylated Urethanes
- 10.1.4. Acrylated Silicones
- 10.1.5. Others
- 10.2. Market Analysis, Insights and Forecast - by Composition
- 10.2.1. Monomers
- 10.2.2. Photoinitiators
- 10.2.3. Oligomers
- 10.2.4. Coinitiators
- 10.3. Market Analysis, Insights and Forecast - by Application
- 10.3.1. Coating
- 10.3.2. Printing
- 10.3.3. Adhesives and Sealants
- 10.3.4. Others
- 10.4. Market Analysis, Insights and Forecast - by End-user Industry
- 10.4.1. Electronics
- 10.4.2. Industrial Coatings
- 10.4.3. Medical
- 10.4.4. Automotive
- 10.4.5. Packaging
- 10.1. Market Analysis, Insights and Forecast - by Resin Type
- 11. North America UV Curable Resin Market Analysis, Insights and Forecast, 2019-2031
- 11.1. Market Analysis, Insights and Forecast - By Country/Sub-region
- 11.1.1 United States
- 11.1.2 Canada
- 11.1.3 Mexico
- 12. Europe UV Curable Resin Market Analysis, Insights and Forecast, 2019-2031
- 12.1. Market Analysis, Insights and Forecast - By Country/Sub-region
- 12.1.1 Germany
- 12.1.2 France
- 12.1.3 Italy
- 12.1.4 United Kingdom
- 12.1.5 Netherlands
- 12.1.6 Rest of Europe
- 13. Asia Pacific UV Curable Resin Market Analysis, Insights and Forecast, 2019-2031
- 13.1. Market Analysis, Insights and Forecast - By Country/Sub-region
- 13.1.1 China
- 13.1.2 Japan
- 13.1.3 India
- 13.1.4 South Korea
- 13.1.5 Taiwan
- 13.1.6 Australia
- 13.1.7 Rest of Asia-Pacific
- 14. South America UV Curable Resin Market Analysis, Insights and Forecast, 2019-2031
- 14.1. Market Analysis, Insights and Forecast - By Country/Sub-region
- 14.1.1 Brazil
- 14.1.2 Argentina
- 14.1.3 Rest of South America
- 15. MEA UV Curable Resin Market Analysis, Insights and Forecast, 2019-2031
- 15.1. Market Analysis, Insights and Forecast - By Country/Sub-region
- 15.1.1 Middle East
- 15.1.2 Africa
- 16. Competitive Analysis
- 16.1. Global Market Share Analysis 2024
- 16.2. Company Profiles
- 16.2.1 Jiangsu Litian Technology Co Ltd
- 16.2.1.1. Overview
- 16.2.1.2. Products
- 16.2.1.3. SWOT Analysis
- 16.2.1.4. Recent Developments
- 16.2.1.5. Financials (Based on Availability)
- 16.2.2 TOAGOSEI CO LTD
- 16.2.2.1. Overview
- 16.2.2.2. Products
- 16.2.2.3. SWOT Analysis
- 16.2.2.4. Recent Developments
- 16.2.2.5. Financials (Based on Availability)
- 16.2.3 SOLTECH LTD
- 16.2.3.1. Overview
- 16.2.3.2. Products
- 16.2.3.3. SWOT Analysis
- 16.2.3.4. Recent Developments
- 16.2.3.5. Financials (Based on Availability)
- 16.2.4 Dymax Corporation
- 16.2.4.1. Overview
- 16.2.4.2. Products
- 16.2.4.3. SWOT Analysis
- 16.2.4.4. Recent Developments
- 16.2.4.5. Financials (Based on Availability)
- 16.2.5 Wanhua Chemical Group Co Ltd
- 16.2.5.1. Overview
- 16.2.5.2. Products
- 16.2.5.3. SWOT Analysis
- 16.2.5.4. Recent Developments
- 16.2.5.5. Financials (Based on Availability)
- 16.2.6 BASF SE
- 16.2.6.1. Overview
- 16.2.6.2. Products
- 16.2.6.3. SWOT Analysis
- 16.2.6.4. Recent Developments
- 16.2.6.5. Financials (Based on Availability)
- 16.2.7 Arkema Group
- 16.2.7.1. Overview
- 16.2.7.2. Products
- 16.2.7.3. SWOT Analysis
- 16.2.7.4. Recent Developments
- 16.2.7.5. Financials (Based on Availability)
- 16.2.8 DSM
- 16.2.8.1. Overview
- 16.2.8.2. Products
- 16.2.8.3. SWOT Analysis
- 16.2.8.4. Recent Developments
- 16.2.8.5. Financials (Based on Availability)
- 16.2.9 Resonac Holdings Corporation
- 16.2.9.1. Overview
- 16.2.9.2. Products
- 16.2.9.3. SWOT Analysis
- 16.2.9.4. Recent Developments
- 16.2.9.5. Financials (Based on Availability)
- 16.2.10 Nippon-Gohsei
- 16.2.10.1. Overview
- 16.2.10.2. Products
- 16.2.10.3. SWOT Analysis
- 16.2.10.4. Recent Developments
- 16.2.10.5. Financials (Based on Availability)
- 16.2.11 Allnex
- 16.2.11.1. Overview
- 16.2.11.2. Products
- 16.2.11.3. SWOT Analysis
- 16.2.11.4. Recent Developments
- 16.2.11.5. Financials (Based on Availability)
- 16.2.12 Covestro AG
- 16.2.12.1. Overview
- 16.2.12.2. Products
- 16.2.12.3. SWOT Analysis
- 16.2.12.4. Recent Developments
- 16.2.12.5. Financials (Based on Availability)
- 16.2.13 DIC CORPORATION
- 16.2.13.1. Overview
- 16.2.13.2. Products
- 16.2.13.3. SWOT Analysis
- 16.2.13.4. Recent Developments
- 16.2.13.5. Financials (Based on Availability)
- 16.2.14 Eternal Materials Co Ltd
- 16.2.14.1. Overview
- 16.2.14.2. Products
- 16.2.14.3. SWOT Analysis
- 16.2.14.4. Recent Developments
- 16.2.14.5. Financials (Based on Availability)
- 16.2.15 IGM Resins
- 16.2.15.1. Overview
- 16.2.15.2. Products
- 16.2.15.3. SWOT Analysis
- 16.2.15.4. Recent Developments
- 16.2.15.5. Financials (Based on Availability)
- 16.2.1 Jiangsu Litian Technology Co Ltd
List of Figures
- Figure 1: Global UV Curable Resin Market Revenue Breakdown (Million, %) by Region 2024 & 2032
- Figure 2: Global UV Curable Resin Market Volume Breakdown (K Tons, %) by Region 2024 & 2032
- Figure 3: North America UV Curable Resin Market Revenue (Million), by Country 2024 & 2032
- Figure 4: North America UV Curable Resin Market Volume (K Tons), by Country 2024 & 2032
- Figure 5: North America UV Curable Resin Market Revenue Share (%), by Country 2024 & 2032
- Figure 6: North America UV Curable Resin Market Volume Share (%), by Country 2024 & 2032
- Figure 7: Europe UV Curable Resin Market Revenue (Million), by Country 2024 & 2032
- Figure 8: Europe UV Curable Resin Market Volume (K Tons), by Country 2024 & 2032
- Figure 9: Europe UV Curable Resin Market Revenue Share (%), by Country 2024 & 2032
- Figure 10: Europe UV Curable Resin Market Volume Share (%), by Country 2024 & 2032
- Figure 11: Asia Pacific UV Curable Resin Market Revenue (Million), by Country 2024 & 2032
- Figure 12: Asia Pacific UV Curable Resin Market Volume (K Tons), by Country 2024 & 2032
- Figure 13: Asia Pacific UV Curable Resin Market Revenue Share (%), by Country 2024 & 2032
- Figure 14: Asia Pacific UV Curable Resin Market Volume Share (%), by Country 2024 & 2032
- Figure 15: South America UV Curable Resin Market Revenue (Million), by Country 2024 & 2032
- Figure 16: South America UV Curable Resin Market Volume (K Tons), by Country 2024 & 2032
- Figure 17: South America UV Curable Resin Market Revenue Share (%), by Country 2024 & 2032
- Figure 18: South America UV Curable Resin Market Volume Share (%), by Country 2024 & 2032
- Figure 19: MEA UV Curable Resin Market Revenue (Million), by Country 2024 & 2032
- Figure 20: MEA UV Curable Resin Market Volume (K Tons), by Country 2024 & 2032
- Figure 21: MEA UV Curable Resin Market Revenue Share (%), by Country 2024 & 2032
- Figure 22: MEA UV Curable Resin Market Volume Share (%), by Country 2024 & 2032
- Figure 23: Asia Pacific UV Curable Resin Market Revenue (Million), by Resin Type 2024 & 2032
- Figure 24: Asia Pacific UV Curable Resin Market Volume (K Tons), by Resin Type 2024 & 2032
- Figure 25: Asia Pacific UV Curable Resin Market Revenue Share (%), by Resin Type 2024 & 2032
- Figure 26: Asia Pacific UV Curable Resin Market Volume Share (%), by Resin Type 2024 & 2032
- Figure 27: Asia Pacific UV Curable Resin Market Revenue (Million), by Composition 2024 & 2032
- Figure 28: Asia Pacific UV Curable Resin Market Volume (K Tons), by Composition 2024 & 2032
- Figure 29: Asia Pacific UV Curable Resin Market Revenue Share (%), by Composition 2024 & 2032
- Figure 30: Asia Pacific UV Curable Resin Market Volume Share (%), by Composition 2024 & 2032
- Figure 31: Asia Pacific UV Curable Resin Market Revenue (Million), by Application 2024 & 2032
- Figure 32: Asia Pacific UV Curable Resin Market Volume (K Tons), by Application 2024 & 2032
- Figure 33: Asia Pacific UV Curable Resin Market Revenue Share (%), by Application 2024 & 2032
- Figure 34: Asia Pacific UV Curable Resin Market Volume Share (%), by Application 2024 & 2032
- Figure 35: Asia Pacific UV Curable Resin Market Revenue (Million), by End-user Industry 2024 & 2032
- Figure 36: Asia Pacific UV Curable Resin Market Volume (K Tons), by End-user Industry 2024 & 2032
- Figure 37: Asia Pacific UV Curable Resin Market Revenue Share (%), by End-user Industry 2024 & 2032
- Figure 38: Asia Pacific UV Curable Resin Market Volume Share (%), by End-user Industry 2024 & 2032
- Figure 39: Asia Pacific UV Curable Resin Market Revenue (Million), by Country 2024 & 2032
- Figure 40: Asia Pacific UV Curable Resin Market Volume (K Tons), by Country 2024 & 2032
- Figure 41: Asia Pacific UV Curable Resin Market Revenue Share (%), by Country 2024 & 2032
- Figure 42: Asia Pacific UV Curable Resin Market Volume Share (%), by Country 2024 & 2032
- Figure 43: North America UV Curable Resin Market Revenue (Million), by Resin Type 2024 & 2032
- Figure 44: North America UV Curable Resin Market Volume (K Tons), by Resin Type 2024 & 2032
- Figure 45: North America UV Curable Resin Market Revenue Share (%), by Resin Type 2024 & 2032
- Figure 46: North America UV Curable Resin Market Volume Share (%), by Resin Type 2024 & 2032
- Figure 47: North America UV Curable Resin Market Revenue (Million), by Composition 2024 & 2032
- Figure 48: North America UV Curable Resin Market Volume (K Tons), by Composition 2024 & 2032
- Figure 49: North America UV Curable Resin Market Revenue Share (%), by Composition 2024 & 2032
- Figure 50: North America UV Curable Resin Market Volume Share (%), by Composition 2024 & 2032
- Figure 51: North America UV Curable Resin Market Revenue (Million), by Application 2024 & 2032
- Figure 52: North America UV Curable Resin Market Volume (K Tons), by Application 2024 & 2032
- Figure 53: North America UV Curable Resin Market Revenue Share (%), by Application 2024 & 2032
- Figure 54: North America UV Curable Resin Market Volume Share (%), by Application 2024 & 2032
- Figure 55: North America UV Curable Resin Market Revenue (Million), by End-user Industry 2024 & 2032
- Figure 56: North America UV Curable Resin Market Volume (K Tons), by End-user Industry 2024 & 2032
- Figure 57: North America UV Curable Resin Market Revenue Share (%), by End-user Industry 2024 & 2032
- Figure 58: North America UV Curable Resin Market Volume Share (%), by End-user Industry 2024 & 2032
- Figure 59: North America UV Curable Resin Market Revenue (Million), by Country 2024 & 2032
- Figure 60: North America UV Curable Resin Market Volume (K Tons), by Country 2024 & 2032
- Figure 61: North America UV Curable Resin Market Revenue Share (%), by Country 2024 & 2032
- Figure 62: North America UV Curable Resin Market Volume Share (%), by Country 2024 & 2032
- Figure 63: Europe UV Curable Resin Market Revenue (Million), by Resin Type 2024 & 2032
- Figure 64: Europe UV Curable Resin Market Volume (K Tons), by Resin Type 2024 & 2032
- Figure 65: Europe UV Curable Resin Market Revenue Share (%), by Resin Type 2024 & 2032
- Figure 66: Europe UV Curable Resin Market Volume Share (%), by Resin Type 2024 & 2032
- Figure 67: Europe UV Curable Resin Market Revenue (Million), by Composition 2024 & 2032
- Figure 68: Europe UV Curable Resin Market Volume (K Tons), by Composition 2024 & 2032
- Figure 69: Europe UV Curable Resin Market Revenue Share (%), by Composition 2024 & 2032
- Figure 70: Europe UV Curable Resin Market Volume Share (%), by Composition 2024 & 2032
- Figure 71: Europe UV Curable Resin Market Revenue (Million), by Application 2024 & 2032
- Figure 72: Europe UV Curable Resin Market Volume (K Tons), by Application 2024 & 2032
- Figure 73: Europe UV Curable Resin Market Revenue Share (%), by Application 2024 & 2032
- Figure 74: Europe UV Curable Resin Market Volume Share (%), by Application 2024 & 2032
- Figure 75: Europe UV Curable Resin Market Revenue (Million), by End-user Industry 2024 & 2032
- Figure 76: Europe UV Curable Resin Market Volume (K Tons), by End-user Industry 2024 & 2032
- Figure 77: Europe UV Curable Resin Market Revenue Share (%), by End-user Industry 2024 & 2032
- Figure 78: Europe UV Curable Resin Market Volume Share (%), by End-user Industry 2024 & 2032
- Figure 79: Europe UV Curable Resin Market Revenue (Million), by Country 2024 & 2032
- Figure 80: Europe UV Curable Resin Market Volume (K Tons), by Country 2024 & 2032
- Figure 81: Europe UV Curable Resin Market Revenue Share (%), by Country 2024 & 2032
- Figure 82: Europe UV Curable Resin Market Volume Share (%), by Country 2024 & 2032
- Figure 83: South America UV Curable Resin Market Revenue (Million), by Resin Type 2024 & 2032
- Figure 84: South America UV Curable Resin Market Volume (K Tons), by Resin Type 2024 & 2032
- Figure 85: South America UV Curable Resin Market Revenue Share (%), by Resin Type 2024 & 2032
- Figure 86: South America UV Curable Resin Market Volume Share (%), by Resin Type 2024 & 2032
- Figure 87: South America UV Curable Resin Market Revenue (Million), by Composition 2024 & 2032
- Figure 88: South America UV Curable Resin Market Volume (K Tons), by Composition 2024 & 2032
- Figure 89: South America UV Curable Resin Market Revenue Share (%), by Composition 2024 & 2032
- Figure 90: South America UV Curable Resin Market Volume Share (%), by Composition 2024 & 2032
- Figure 91: South America UV Curable Resin Market Revenue (Million), by Application 2024 & 2032
- Figure 92: South America UV Curable Resin Market Volume (K Tons), by Application 2024 & 2032
- Figure 93: South America UV Curable Resin Market Revenue Share (%), by Application 2024 & 2032
- Figure 94: South America UV Curable Resin Market Volume Share (%), by Application 2024 & 2032
- Figure 95: South America UV Curable Resin Market Revenue (Million), by End-user Industry 2024 & 2032
- Figure 96: South America UV Curable Resin Market Volume (K Tons), by End-user Industry 2024 & 2032
- Figure 97: South America UV Curable Resin Market Revenue Share (%), by End-user Industry 2024 & 2032
- Figure 98: South America UV Curable Resin Market Volume Share (%), by End-user Industry 2024 & 2032
- Figure 99: South America UV Curable Resin Market Revenue (Million), by Country 2024 & 2032
- Figure 100: South America UV Curable Resin Market Volume (K Tons), by Country 2024 & 2032
- Figure 101: South America UV Curable Resin Market Revenue Share (%), by Country 2024 & 2032
- Figure 102: South America UV Curable Resin Market Volume Share (%), by Country 2024 & 2032
- Figure 103: Middle East and Africa UV Curable Resin Market Revenue (Million), by Resin Type 2024 & 2032
- Figure 104: Middle East and Africa UV Curable Resin Market Volume (K Tons), by Resin Type 2024 & 2032
- Figure 105: Middle East and Africa UV Curable Resin Market Revenue Share (%), by Resin Type 2024 & 2032
- Figure 106: Middle East and Africa UV Curable Resin Market Volume Share (%), by Resin Type 2024 & 2032
- Figure 107: Middle East and Africa UV Curable Resin Market Revenue (Million), by Composition 2024 & 2032
- Figure 108: Middle East and Africa UV Curable Resin Market Volume (K Tons), by Composition 2024 & 2032
- Figure 109: Middle East and Africa UV Curable Resin Market Revenue Share (%), by Composition 2024 & 2032
- Figure 110: Middle East and Africa UV Curable Resin Market Volume Share (%), by Composition 2024 & 2032
- Figure 111: Middle East and Africa UV Curable Resin Market Revenue (Million), by Application 2024 & 2032
- Figure 112: Middle East and Africa UV Curable Resin Market Volume (K Tons), by Application 2024 & 2032
- Figure 113: Middle East and Africa UV Curable Resin Market Revenue Share (%), by Application 2024 & 2032
- Figure 114: Middle East and Africa UV Curable Resin Market Volume Share (%), by Application 2024 & 2032
- Figure 115: Middle East and Africa UV Curable Resin Market Revenue (Million), by End-user Industry 2024 & 2032
- Figure 116: Middle East and Africa UV Curable Resin Market Volume (K Tons), by End-user Industry 2024 & 2032
- Figure 117: Middle East and Africa UV Curable Resin Market Revenue Share (%), by End-user Industry 2024 & 2032
- Figure 118: Middle East and Africa UV Curable Resin Market Volume Share (%), by End-user Industry 2024 & 2032
- Figure 119: Middle East and Africa UV Curable Resin Market Revenue (Million), by Country 2024 & 2032
- Figure 120: Middle East and Africa UV Curable Resin Market Volume (K Tons), by Country 2024 & 2032
- Figure 121: Middle East and Africa UV Curable Resin Market Revenue Share (%), by Country 2024 & 2032
- Figure 122: Middle East and Africa UV Curable Resin Market Volume Share (%), by Country 2024 & 2032
List of Tables
- Table 1: Global UV Curable Resin Market Revenue Million Forecast, by Region 2019 & 2032
- Table 2: Global UV Curable Resin Market Volume K Tons Forecast, by Region 2019 & 2032
- Table 3: Global UV Curable Resin Market Revenue Million Forecast, by Resin Type 2019 & 2032
- Table 4: Global UV Curable Resin Market Volume K Tons Forecast, by Resin Type 2019 & 2032
- Table 5: Global UV Curable Resin Market Revenue Million Forecast, by Composition 2019 & 2032
- Table 6: Global UV Curable Resin Market Volume K Tons Forecast, by Composition 2019 & 2032
- Table 7: Global UV Curable Resin Market Revenue Million Forecast, by Application 2019 & 2032
- Table 8: Global UV Curable Resin Market Volume K Tons Forecast, by Application 2019 & 2032
- Table 9: Global UV Curable Resin Market Revenue Million Forecast, by End-user Industry 2019 & 2032
- Table 10: Global UV Curable Resin Market Volume K Tons Forecast, by End-user Industry 2019 & 2032
- Table 11: Global UV Curable Resin Market Revenue Million Forecast, by Region 2019 & 2032
- Table 12: Global UV Curable Resin Market Volume K Tons Forecast, by Region 2019 & 2032
- Table 13: Global UV Curable Resin Market Revenue Million Forecast, by Country 2019 & 2032
- Table 14: Global UV Curable Resin Market Volume K Tons Forecast, by Country 2019 & 2032
- Table 15: United States UV Curable Resin Market Revenue (Million) Forecast, by Application 2019 & 2032
- Table 16: United States UV Curable Resin Market Volume (K Tons) Forecast, by Application 2019 & 2032
- Table 17: Canada UV Curable Resin Market Revenue (Million) Forecast, by Application 2019 & 2032
- Table 18: Canada UV Curable Resin Market Volume (K Tons) Forecast, by Application 2019 & 2032
- Table 19: Mexico UV Curable Resin Market Revenue (Million) Forecast, by Application 2019 & 2032
- Table 20: Mexico UV Curable Resin Market Volume (K Tons) Forecast, by Application 2019 & 2032
- Table 21: Global UV Curable Resin Market Revenue Million Forecast, by Country 2019 & 2032
- Table 22: Global UV Curable Resin Market Volume K Tons Forecast, by Country 2019 & 2032
- Table 23: Germany UV Curable Resin Market Revenue (Million) Forecast, by Application 2019 & 2032
- Table 24: Germany UV Curable Resin Market Volume (K Tons) Forecast, by Application 2019 & 2032
- Table 25: France UV Curable Resin Market Revenue (Million) Forecast, by Application 2019 & 2032
- Table 26: France UV Curable Resin Market Volume (K Tons) Forecast, by Application 2019 & 2032
- Table 27: Italy UV Curable Resin Market Revenue (Million) Forecast, by Application 2019 & 2032
- Table 28: Italy UV Curable Resin Market Volume (K Tons) Forecast, by Application 2019 & 2032
- Table 29: United Kingdom UV Curable Resin Market Revenue (Million) Forecast, by Application 2019 & 2032
- Table 30: United Kingdom UV Curable Resin Market Volume (K Tons) Forecast, by Application 2019 & 2032
- Table 31: Netherlands UV Curable Resin Market Revenue (Million) Forecast, by Application 2019 & 2032
- Table 32: Netherlands UV Curable Resin Market Volume (K Tons) Forecast, by Application 2019 & 2032
- Table 33: Rest of Europe UV Curable Resin Market Revenue (Million) Forecast, by Application 2019 & 2032
- Table 34: Rest of Europe UV Curable Resin Market Volume (K Tons) Forecast, by Application 2019 & 2032
- Table 35: Global UV Curable Resin Market Revenue Million Forecast, by Country 2019 & 2032
- Table 36: Global UV Curable Resin Market Volume K Tons Forecast, by Country 2019 & 2032
- Table 37: China UV Curable Resin Market Revenue (Million) Forecast, by Application 2019 & 2032
- Table 38: China UV Curable Resin Market Volume (K Tons) Forecast, by Application 2019 & 2032
- Table 39: Japan UV Curable Resin Market Revenue (Million) Forecast, by Application 2019 & 2032
- Table 40: Japan UV Curable Resin Market Volume (K Tons) Forecast, by Application 2019 & 2032
- Table 41: India UV Curable Resin Market Revenue (Million) Forecast, by Application 2019 & 2032
- Table 42: India UV Curable Resin Market Volume (K Tons) Forecast, by Application 2019 & 2032
- Table 43: South Korea UV Curable Resin Market Revenue (Million) Forecast, by Application 2019 & 2032
- Table 44: South Korea UV Curable Resin Market Volume (K Tons) Forecast, by Application 2019 & 2032
- Table 45: Taiwan UV Curable Resin Market Revenue (Million) Forecast, by Application 2019 & 2032
- Table 46: Taiwan UV Curable Resin Market Volume (K Tons) Forecast, by Application 2019 & 2032
- Table 47: Australia UV Curable Resin Market Revenue (Million) Forecast, by Application 2019 & 2032
- Table 48: Australia UV Curable Resin Market Volume (K Tons) Forecast, by Application 2019 & 2032
- Table 49: Rest of Asia-Pacific UV Curable Resin Market Revenue (Million) Forecast, by Application 2019 & 2032
- Table 50: Rest of Asia-Pacific UV Curable Resin Market Volume (K Tons) Forecast, by Application 2019 & 2032
- Table 51: Global UV Curable Resin Market Revenue Million Forecast, by Country 2019 & 2032
- Table 52: Global UV Curable Resin Market Volume K Tons Forecast, by Country 2019 & 2032
- Table 53: Brazil UV Curable Resin Market Revenue (Million) Forecast, by Application 2019 & 2032
- Table 54: Brazil UV Curable Resin Market Volume (K Tons) Forecast, by Application 2019 & 2032
- Table 55: Argentina UV Curable Resin Market Revenue (Million) Forecast, by Application 2019 & 2032
- Table 56: Argentina UV Curable Resin Market Volume (K Tons) Forecast, by Application 2019 & 2032
- Table 57: Rest of South America UV Curable Resin Market Revenue (Million) Forecast, by Application 2019 & 2032
- Table 58: Rest of South America UV Curable Resin Market Volume (K Tons) Forecast, by Application 2019 & 2032
- Table 59: Global UV Curable Resin Market Revenue Million Forecast, by Country 2019 & 2032
- Table 60: Global UV Curable Resin Market Volume K Tons Forecast, by Country 2019 & 2032
- Table 61: Middle East UV Curable Resin Market Revenue (Million) Forecast, by Application 2019 & 2032
- Table 62: Middle East UV Curable Resin Market Volume (K Tons) Forecast, by Application 2019 & 2032
- Table 63: Africa UV Curable Resin Market Revenue (Million) Forecast, by Application 2019 & 2032
- Table 64: Africa UV Curable Resin Market Volume (K Tons) Forecast, by Application 2019 & 2032
- Table 65: Global UV Curable Resin Market Revenue Million Forecast, by Resin Type 2019 & 2032
- Table 66: Global UV Curable Resin Market Volume K Tons Forecast, by Resin Type 2019 & 2032
- Table 67: Global UV Curable Resin Market Revenue Million Forecast, by Composition 2019 & 2032
- Table 68: Global UV Curable Resin Market Volume K Tons Forecast, by Composition 2019 & 2032
- Table 69: Global UV Curable Resin Market Revenue Million Forecast, by Application 2019 & 2032
- Table 70: Global UV Curable Resin Market Volume K Tons Forecast, by Application 2019 & 2032
- Table 71: Global UV Curable Resin Market Revenue Million Forecast, by End-user Industry 2019 & 2032
- Table 72: Global UV Curable Resin Market Volume K Tons Forecast, by End-user Industry 2019 & 2032
- Table 73: Global UV Curable Resin Market Revenue Million Forecast, by Country 2019 & 2032
- Table 74: Global UV Curable Resin Market Volume K Tons Forecast, by Country 2019 & 2032
- Table 75: China UV Curable Resin Market Revenue (Million) Forecast, by Application 2019 & 2032
- Table 76: China UV Curable Resin Market Volume (K Tons) Forecast, by Application 2019 & 2032
- Table 77: India UV Curable Resin Market Revenue (Million) Forecast, by Application 2019 & 2032
- Table 78: India UV Curable Resin Market Volume (K Tons) Forecast, by Application 2019 & 2032
- Table 79: Japan UV Curable Resin Market Revenue (Million) Forecast, by Application 2019 & 2032
- Table 80: Japan UV Curable Resin Market Volume (K Tons) Forecast, by Application 2019 & 2032
- Table 81: South Korea UV Curable Resin Market Revenue (Million) Forecast, by Application 2019 & 2032
- Table 82: South Korea UV Curable Resin Market Volume (K Tons) Forecast, by Application 2019 & 2032
- Table 83: Rest of Asia Pacific UV Curable Resin Market Revenue (Million) Forecast, by Application 2019 & 2032
- Table 84: Rest of Asia Pacific UV Curable Resin Market Volume (K Tons) Forecast, by Application 2019 & 2032
- Table 85: Global UV Curable Resin Market Revenue Million Forecast, by Resin Type 2019 & 2032
- Table 86: Global UV Curable Resin Market Volume K Tons Forecast, by Resin Type 2019 & 2032
- Table 87: Global UV Curable Resin Market Revenue Million Forecast, by Composition 2019 & 2032
- Table 88: Global UV Curable Resin Market Volume K Tons Forecast, by Composition 2019 & 2032
- Table 89: Global UV Curable Resin Market Revenue Million Forecast, by Application 2019 & 2032
- Table 90: Global UV Curable Resin Market Volume K Tons Forecast, by Application 2019 & 2032
- Table 91: Global UV Curable Resin Market Revenue Million Forecast, by End-user Industry 2019 & 2032
- Table 92: Global UV Curable Resin Market Volume K Tons Forecast, by End-user Industry 2019 & 2032
- Table 93: Global UV Curable Resin Market Revenue Million Forecast, by Country 2019 & 2032
- Table 94: Global UV Curable Resin Market Volume K Tons Forecast, by Country 2019 & 2032
- Table 95: United States UV Curable Resin Market Revenue (Million) Forecast, by Application 2019 & 2032
- Table 96: United States UV Curable Resin Market Volume (K Tons) Forecast, by Application 2019 & 2032
- Table 97: Canada UV Curable Resin Market Revenue (Million) Forecast, by Application 2019 & 2032
- Table 98: Canada UV Curable Resin Market Volume (K Tons) Forecast, by Application 2019 & 2032
- Table 99: Mexico UV Curable Resin Market Revenue (Million) Forecast, by Application 2019 & 2032
- Table 100: Mexico UV Curable Resin Market Volume (K Tons) Forecast, by Application 2019 & 2032
- Table 101: Global UV Curable Resin Market Revenue Million Forecast, by Resin Type 2019 & 2032
- Table 102: Global UV Curable Resin Market Volume K Tons Forecast, by Resin Type 2019 & 2032
- Table 103: Global UV Curable Resin Market Revenue Million Forecast, by Composition 2019 & 2032
- Table 104: Global UV Curable Resin Market Volume K Tons Forecast, by Composition 2019 & 2032
- Table 105: Global UV Curable Resin Market Revenue Million Forecast, by Application 2019 & 2032
- Table 106: Global UV Curable Resin Market Volume K Tons Forecast, by Application 2019 & 2032
- Table 107: Global UV Curable Resin Market Revenue Million Forecast, by End-user Industry 2019 & 2032
- Table 108: Global UV Curable Resin Market Volume K Tons Forecast, by End-user Industry 2019 & 2032
- Table 109: Global UV Curable Resin Market Revenue Million Forecast, by Country 2019 & 2032
- Table 110: Global UV Curable Resin Market Volume K Tons Forecast, by Country 2019 & 2032
- Table 111: Germany UV Curable Resin Market Revenue (Million) Forecast, by Application 2019 & 2032
- Table 112: Germany UV Curable Resin Market Volume (K Tons) Forecast, by Application 2019 & 2032
- Table 113: United Kingdom UV Curable Resin Market Revenue (Million) Forecast, by Application 2019 & 2032
- Table 114: United Kingdom UV Curable Resin Market Volume (K Tons) Forecast, by Application 2019 & 2032
- Table 115: Italy UV Curable Resin Market Revenue (Million) Forecast, by Application 2019 & 2032
- Table 116: Italy UV Curable Resin Market Volume (K Tons) Forecast, by Application 2019 & 2032
- Table 117: France UV Curable Resin Market Revenue (Million) Forecast, by Application 2019 & 2032
- Table 118: France UV Curable Resin Market Volume (K Tons) Forecast, by Application 2019 & 2032
- Table 119: Rest of Europe UV Curable Resin Market Revenue (Million) Forecast, by Application 2019 & 2032
- Table 120: Rest of Europe UV Curable Resin Market Volume (K Tons) Forecast, by Application 2019 & 2032
- Table 121: Global UV Curable Resin Market Revenue Million Forecast, by Resin Type 2019 & 2032
- Table 122: Global UV Curable Resin Market Volume K Tons Forecast, by Resin Type 2019 & 2032
- Table 123: Global UV Curable Resin Market Revenue Million Forecast, by Composition 2019 & 2032
- Table 124: Global UV Curable Resin Market Volume K Tons Forecast, by Composition 2019 & 2032
- Table 125: Global UV Curable Resin Market Revenue Million Forecast, by Application 2019 & 2032
- Table 126: Global UV Curable Resin Market Volume K Tons Forecast, by Application 2019 & 2032
- Table 127: Global UV Curable Resin Market Revenue Million Forecast, by End-user Industry 2019 & 2032
- Table 128: Global UV Curable Resin Market Volume K Tons Forecast, by End-user Industry 2019 & 2032
- Table 129: Global UV Curable Resin Market Revenue Million Forecast, by Country 2019 & 2032
- Table 130: Global UV Curable Resin Market Volume K Tons Forecast, by Country 2019 & 2032
- Table 131: Brazil UV Curable Resin Market Revenue (Million) Forecast, by Application 2019 & 2032
- Table 132: Brazil UV Curable Resin Market Volume (K Tons) Forecast, by Application 2019 & 2032
- Table 133: Argentina UV Curable Resin Market Revenue (Million) Forecast, by Application 2019 & 2032
- Table 134: Argentina UV Curable Resin Market Volume (K Tons) Forecast, by Application 2019 & 2032
- Table 135: Rest of South America UV Curable Resin Market Revenue (Million) Forecast, by Application 2019 & 2032
- Table 136: Rest of South America UV Curable Resin Market Volume (K Tons) Forecast, by Application 2019 & 2032
- Table 137: Global UV Curable Resin Market Revenue Million Forecast, by Resin Type 2019 & 2032
- Table 138: Global UV Curable Resin Market Volume K Tons Forecast, by Resin Type 2019 & 2032
- Table 139: Global UV Curable Resin Market Revenue Million Forecast, by Composition 2019 & 2032
- Table 140: Global UV Curable Resin Market Volume K Tons Forecast, by Composition 2019 & 2032
- Table 141: Global UV Curable Resin Market Revenue Million Forecast, by Application 2019 & 2032
- Table 142: Global UV Curable Resin Market Volume K Tons Forecast, by Application 2019 & 2032
- Table 143: Global UV Curable Resin Market Revenue Million Forecast, by End-user Industry 2019 & 2032
- Table 144: Global UV Curable Resin Market Volume K Tons Forecast, by End-user Industry 2019 & 2032
- Table 145: Global UV Curable Resin Market Revenue Million Forecast, by Country 2019 & 2032
- Table 146: Global UV Curable Resin Market Volume K Tons Forecast, by Country 2019 & 2032
- Table 147: Saudi Arabia UV Curable Resin Market Revenue (Million) Forecast, by Application 2019 & 2032
- Table 148: Saudi Arabia UV Curable Resin Market Volume (K Tons) Forecast, by Application 2019 & 2032
- Table 149: South Africa UV Curable Resin Market Revenue (Million) Forecast, by Application 2019 & 2032
- Table 150: South Africa UV Curable Resin Market Volume (K Tons) Forecast, by Application 2019 & 2032
- Table 151: Rest of Middle East UV Curable Resin Market Revenue (Million) Forecast, by Application 2019 & 2032
- Table 152: Rest of Middle East UV Curable Resin Market Volume (K Tons) Forecast, by Application 2019 & 2032
Frequently Asked Questions
1. What is the projected Compound Annual Growth Rate (CAGR) of the UV Curable Resin Market?
The projected CAGR is approximately 6.76%.
2. Which companies are prominent players in the UV Curable Resin Market?
Key companies in the market include Jiangsu Litian Technology Co Ltd, TOAGOSEI CO LTD, SOLTECH LTD, Dymax Corporation, Wanhua Chemical Group Co Ltd , BASF SE, Arkema Group, DSM, Resonac Holdings Corporation, Nippon-Gohsei, Allnex, Covestro AG, DIC CORPORATION, Eternal Materials Co Ltd, IGM Resins.
3. What are the main segments of the UV Curable Resin Market?
The market segments include Resin Type, Composition, Application, End-user Industry.
4. Can you provide details about the market size?
The market size is estimated to be USD 5.05 Million as of 2022.
5. What are some drivers contributing to market growth?
Increase in Use of Environment-Friendly Industrial Coatings; Rising Demand for UV Curable Inks in Packaging Application; Other Drivers.
6. What are the notable trends driving market growth?
Increasing Demand from Packaging Industry.
7. Are there any restraints impacting market growth?
High Initial Capital Cost; Other Restraints.
8. Can you provide examples of recent developments in the market?
Recent developments in the market studied will be covered in the final report.
9. What pricing options are available for accessing the report?
Pricing options include single-user, multi-user, and enterprise licenses priced at USD 4750, USD 5250, and USD 8750 respectively.
10. Is the market size provided in terms of value or volume?
The market size is provided in terms of value, measured in Million and volume, measured in K Tons.
11. Are there any specific market keywords associated with the report?
Yes, the market keyword associated with the report is "UV Curable Resin Market," which aids in identifying and referencing the specific market segment covered.
12. How do I determine which pricing option suits my needs best?
The pricing options vary based on user requirements and access needs. Individual users may opt for single-user licenses, while businesses requiring broader access may choose multi-user or enterprise licenses for cost-effective access to the report.
13. Are there any additional resources or data provided in the UV Curable Resin Market report?
While the report offers comprehensive insights, it's advisable to review the specific contents or supplementary materials provided to ascertain if additional resources or data are available.
14. How can I stay updated on further developments or reports in the UV Curable Resin Market?
To stay informed about further developments, trends, and reports in the UV Curable Resin Market, consider subscribing to industry newsletters, following relevant companies and organizations, or regularly checking reputable industry news sources and publications.
Methodology
Step 1 - Identification of Relevant Samples Size from Population Database


Step 2 - Approaches for Defining Global Market Size (Value, Volume* & Price*)

Note*: In applicable scenarios
Step 3 - Data Sources
Primary Research
- Web Analytics
- Survey Reports
- Research Institute
- Latest Research Reports
- Opinion Leaders
Secondary Research
- Annual Reports
- White Paper
- Latest Press Release
- Industry Association
- Paid Database
- Investor Presentations

Step 4 - Data Triangulation
Involves using different sources of information in order to increase the validity of a study
These sources are likely to be stakeholders in a program - participants, other researchers, program staff, other community members, and so on.
Then we put all data in single framework & apply various statistical tools to find out the dynamic on the market.
During the analysis stage, feedback from the stakeholder groups would be compared to determine areas of agreement as well as areas of divergence
