

Key Insights
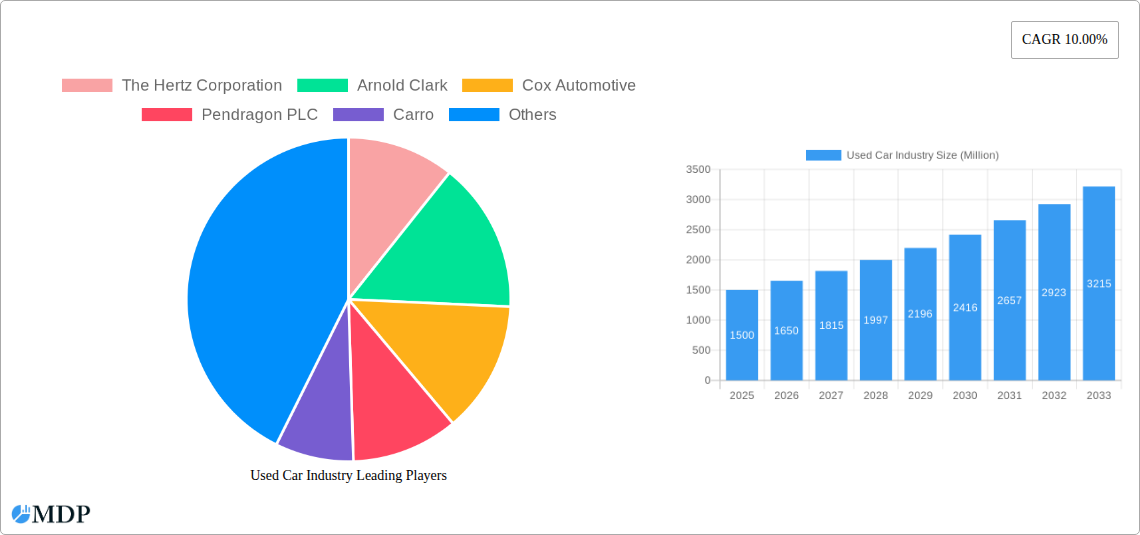
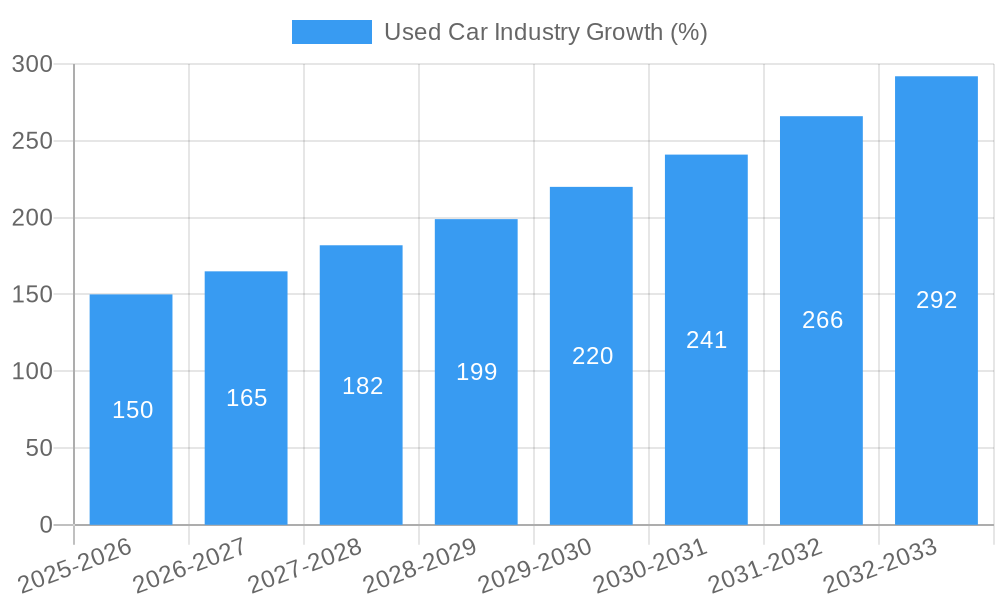
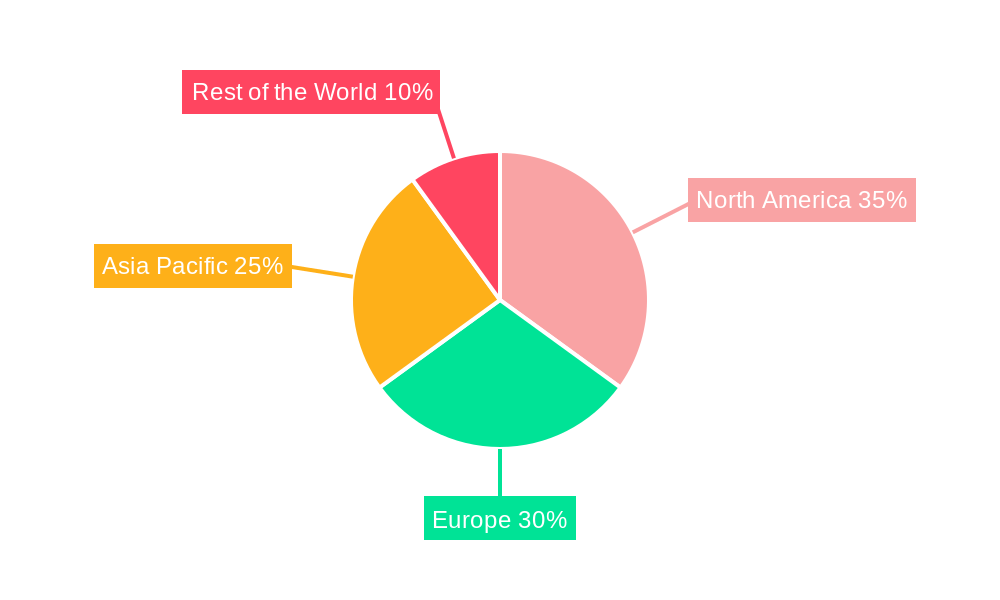
The global used car market, currently experiencing robust growth, is projected to maintain a Compound Annual Growth Rate (CAGR) of 10% from 2025 to 2033. This expansion is fueled by several key factors. Rising new car prices, coupled with economic uncertainty impacting affordability, are driving increased demand for pre-owned vehicles. Technological advancements, such as improved online marketplaces and enhanced vehicle inspection services, are boosting transparency and consumer confidence in used car purchases. Furthermore, the growing preference for flexible financing options and subscription models is also contributing to the market's upward trajectory. The segmentation of the used car market reveals a diverse landscape. The SUV and MPV segments are particularly strong, reflecting evolving consumer preferences for spacious and versatile vehicles. The organized sector is expected to witness faster growth compared to the unorganized sector due to factors like greater trust, better quality assurance, and broader reach. Key players like CarMax, AutoNation, and Cox Automotive are strategically expanding their operations and adopting innovative sales strategies to maintain their competitive edge. Geographic variations exist, with North America and Europe currently dominating the market, though the Asia-Pacific region is poised for significant growth, driven largely by the expanding middle class in countries like India and China.
The competitive landscape is characterized by a mix of large multinational corporations and regional players. Established players leverage their extensive networks, brand recognition, and financing capabilities to capture a significant market share. However, smaller, agile companies are also gaining traction through specialized services, focusing on niche segments, or leveraging digital platforms for efficient operations. Regulatory changes focusing on emission standards and vehicle safety will likely influence future market growth. Strategies to adapt to these regulations, coupled with advancements in technology like AI-powered valuation tools, will define the success of key market players in the coming years. Overall, the used car market offers significant growth potential, presenting various opportunities for both established and emerging players.
Used Car Industry Market Report: 2019-2033
Dive into the dynamic world of the used car market with our comprehensive report, providing a detailed analysis of market trends, key players, and future opportunities. This report covers the period from 2019 to 2033, with a focus on the year 2025. The market is valued at $XX Million in 2025 and is projected to reach $XX Million by 2033, representing a robust CAGR of XX%. This in-depth study offers actionable insights for investors, industry professionals, and stakeholders seeking to navigate this rapidly evolving sector.
Used Car Industry Market Dynamics & Concentration
The global used car market, valued at $XX Million in 2025, exhibits a moderately consolidated landscape. While a large number of unorganized players exist, a few dominant companies capture significant market share. Market concentration is influenced by factors including economies of scale, brand recognition, and access to financing. Innovation is driven by technological advancements, particularly in online platforms and vehicle inspection technologies. Regulatory frameworks, varying by region, impact market access and operational efficiency. Product substitutes, such as ride-sharing services, present competition. End-user trends, shifting towards convenience and online transactions, are reshaping the sales process. Mergers and acquisitions (M&A) activity remains significant, with an estimated XX M&A deals in the historical period (2019-2024), driving consolidation and expansion.
- Market Share: Top 5 players hold approximately XX% of the market share in 2025.
- M&A Activity: Increased consolidation with a predicted XX M&A deals in the forecast period (2025-2033).
- Innovation Drivers: Online marketplaces, AI-powered valuation tools, and improved financing options.
- Regulatory Impact: Varying emission standards, vehicle inspection regulations, and data privacy laws impact operations.
Used Car Industry Industry Trends & Analysis
The used car market is experiencing substantial growth, fueled by factors including rising disposable incomes, increasing urbanization, and the preference for cost-effective transportation. Technological disruptions, such as the rise of online marketplaces and digital financing solutions, are transforming the industry. Consumer preferences are shifting towards used vehicles offering better value for money, fuel efficiency, and technological features. Competitive dynamics are intense, with both established players and new entrants vying for market share. The market penetration of online platforms is growing rapidly, with XX% of used car transactions expected to occur online by 2033. This trend is accelerated by the convenience and transparency that online platforms offer.
Leading Markets & Segments in Used Car Industry
The used car market exhibits significant regional variations. [Dominant Region/Country – e.g., North America] currently holds the largest market share, driven by factors such as strong economic growth, a well-developed automotive infrastructure, and favorable consumer preferences. Within the vehicle type segment, Sports Utility Vehicles (SUVs) and Multi-Purpose Vehicles (MPVs) witness the highest demand due to their versatility and family-friendly features. The organized sector dominates the market in terms of sales volume and revenue generation.
- Key Drivers (Dominant Region): Strong economic growth, high vehicle ownership rates, robust financing options.
- Key Drivers (Organized Sector): Brand reputation, quality assurance, financing options, warranties.
- Key Drivers (SUVs & MPVs): Growing family sizes, increasing preference for spacious vehicles, rising disposable income.
- Dominance Analysis: The [Dominant Region/Country] market's robust automotive infrastructure and high vehicle ownership rates contribute to its leading position.
Used Car Industry Product Developments
Technological advancements are significantly impacting the used car market, leading to innovations in vehicle inspection technology, online marketplaces, and financing options. These advancements enhance transparency, convenience, and speed in the buying and selling process. The increasing integration of data analytics and AI is improving price prediction and risk assessment. The market is witnessing a shift towards enhanced digital experiences through applications and online platforms. The development of standardized vehicle inspection processes fosters consumer trust.
Key Drivers of Used Car Industry Growth
Several factors propel the growth of the used car industry. Technological advancements such as online platforms improve accessibility and transparency. Economic factors such as rising disposable incomes and affordability compared to new cars drive demand. Favorable government policies, including incentives for used vehicle purchases, further stimulate the market.
Challenges in the Used Car Industry Market
The used car industry faces challenges including regulatory hurdles related to vehicle emission standards and data privacy. Supply chain disruptions, impacting vehicle availability, and intense competition from organized and unorganized players pose significant difficulties. The fluctuating prices of used cars, influenced by macroeconomic factors, also present challenges. These factors can impact profitability and market stability.
Emerging Opportunities in Used Car Industry
The used car market presents several opportunities. Technological breakthroughs such as blockchain technology for transparent transactions and strategic partnerships between online platforms and financial institutions open new avenues. Market expansion into developing countries with growing vehicle ownership presents significant potential.
Leading Players in the Used Car Industry Sector
- The Hertz Corporation
- Arnold Clark
- Cox Automotive
- Pendragon PLC
- Carro
- AutoNation
- Asbury Automotive Group
- Mahindra First Choice Wheels
- Penske Cars
- CarMax Inc
- Maruti Suzuki True Value
- Emil Frey AG
Key Milestones in Used Car Industry Industry
- March 2022: TrueCar Inc. launches TrueCar+, a new online car-buying marketplace.
- January 2022: General Motors launches Carvago, a used car marketplace leveraging its inventory.
- September 2021: Mobil88 launches the Mo88i application for easy used car buying and selling.
- March 2021: Penske Automotive Group Inc. adopts CarShop as its global brand for used vehicle SuperCenters.
Strategic Outlook for Used Car Industry Market
The future of the used car industry is bright, with continued growth driven by technological advancements, changing consumer preferences, and expansion into new markets. Strategic partnerships, investments in technology, and focus on customer experience will be crucial for success in this dynamic sector. The market shows significant potential for further expansion, particularly in developing economies and through the adoption of innovative technologies.
Used Car Industry Segmentation
-
1. Vehicle Type
- 1.1. Hatchbacks
- 1.2. Sedan
- 1.3. Sports Utility Vehicles and Multi-Purpose Vehicles
-
2. Vendor
- 2.1. Organized
- 2.2. Unorganized
Used Car Industry Segmentation By Geography
-
1. North America
- 1.1. United States
- 1.2. Canada
- 1.3. Rest of North America
-
2. Europe
- 2.1. Germany
- 2.2. United Kingdom
- 2.3. France
- 2.4. Spain
- 2.5. Rest of Europe
-
3. Asia Pacific
- 3.1. China
- 3.2. India
- 3.3. Japan
- 3.4. South Korea
- 3.5. Rest of Asia Pacific
-
4. Rest of the World
- 4.1. Brazil
- 4.2. United Arab Emirates
- 4.3. South Africa
- 4.4. Other Countries
Used Car Industry REPORT HIGHLIGHTS
| Aspects | Details |
|---|---|
| Study Period | 2019-2033 |
| Base Year | 2024 |
| Estimated Year | 2025 |
| Forecast Period | 2025-2033 |
| Historical Period | 2019-2024 |
| Growth Rate | CAGR of 10.00% from 2019-2033 |
| Segmentation |
|
Table of Contents
- 1. Introduction
- 1.1. Research Scope
- 1.2. Market Segmentation
- 1.3. Research Methodology
- 1.4. Definitions and Assumptions
- 2. Executive Summary
- 2.1. Introduction
- 3. Market Dynamics
- 3.1. Introduction
- 3.2. Market Drivers
- 3.2.1. Increasing Demand For Electric School Buses
- 3.3. Market Restrains
- 3.3.1. Uncertainty of The Global Pandemic
- 3.4. Market Trends
- 3.4.1. Strengthening of Online Infrastructure Positively Affecting the Used Cars Market
- 4. Market Factor Analysis
- 4.1. Porters Five Forces
- 4.2. Supply/Value Chain
- 4.3. PESTEL analysis
- 4.4. Market Entropy
- 4.5. Patent/Trademark Analysis
- 5. Global Used Car Industry Analysis, Insights and Forecast, 2019-2031
- 5.1. Market Analysis, Insights and Forecast - by Vehicle Type
- 5.1.1. Hatchbacks
- 5.1.2. Sedan
- 5.1.3. Sports Utility Vehicles and Multi-Purpose Vehicles
- 5.2. Market Analysis, Insights and Forecast - by Vendor
- 5.2.1. Organized
- 5.2.2. Unorganized
- 5.3. Market Analysis, Insights and Forecast - by Region
- 5.3.1. North America
- 5.3.2. Europe
- 5.3.3. Asia Pacific
- 5.3.4. Rest of the World
- 5.1. Market Analysis, Insights and Forecast - by Vehicle Type
- 6. North America Used Car Industry Analysis, Insights and Forecast, 2019-2031
- 6.1. Market Analysis, Insights and Forecast - by Vehicle Type
- 6.1.1. Hatchbacks
- 6.1.2. Sedan
- 6.1.3. Sports Utility Vehicles and Multi-Purpose Vehicles
- 6.2. Market Analysis, Insights and Forecast - by Vendor
- 6.2.1. Organized
- 6.2.2. Unorganized
- 6.1. Market Analysis, Insights and Forecast - by Vehicle Type
- 7. Europe Used Car Industry Analysis, Insights and Forecast, 2019-2031
- 7.1. Market Analysis, Insights and Forecast - by Vehicle Type
- 7.1.1. Hatchbacks
- 7.1.2. Sedan
- 7.1.3. Sports Utility Vehicles and Multi-Purpose Vehicles
- 7.2. Market Analysis, Insights and Forecast - by Vendor
- 7.2.1. Organized
- 7.2.2. Unorganized
- 7.1. Market Analysis, Insights and Forecast - by Vehicle Type
- 8. Asia Pacific Used Car Industry Analysis, Insights and Forecast, 2019-2031
- 8.1. Market Analysis, Insights and Forecast - by Vehicle Type
- 8.1.1. Hatchbacks
- 8.1.2. Sedan
- 8.1.3. Sports Utility Vehicles and Multi-Purpose Vehicles
- 8.2. Market Analysis, Insights and Forecast - by Vendor
- 8.2.1. Organized
- 8.2.2. Unorganized
- 8.1. Market Analysis, Insights and Forecast - by Vehicle Type
- 9. Rest of the World Used Car Industry Analysis, Insights and Forecast, 2019-2031
- 9.1. Market Analysis, Insights and Forecast - by Vehicle Type
- 9.1.1. Hatchbacks
- 9.1.2. Sedan
- 9.1.3. Sports Utility Vehicles and Multi-Purpose Vehicles
- 9.2. Market Analysis, Insights and Forecast - by Vendor
- 9.2.1. Organized
- 9.2.2. Unorganized
- 9.1. Market Analysis, Insights and Forecast - by Vehicle Type
- 10. North America Used Car Industry Analysis, Insights and Forecast, 2019-2031
- 10.1. Market Analysis, Insights and Forecast - By Country/Sub-region
- 10.1.1 United States
- 10.1.2 Canada
- 10.1.3 Rest of North America
- 11. Europe Used Car Industry Analysis, Insights and Forecast, 2019-2031
- 11.1. Market Analysis, Insights and Forecast - By Country/Sub-region
- 11.1.1 Germany
- 11.1.2 United Kingdom
- 11.1.3 France
- 11.1.4 Spain
- 11.1.5 Rest of Europe
- 12. Asia Pacific Used Car Industry Analysis, Insights and Forecast, 2019-2031
- 12.1. Market Analysis, Insights and Forecast - By Country/Sub-region
- 12.1.1 China
- 12.1.2 India
- 12.1.3 Japan
- 12.1.4 South Korea
- 12.1.5 Rest of Asia Pacific
- 13. Rest of the World Used Car Industry Analysis, Insights and Forecast, 2019-2031
- 13.1. Market Analysis, Insights and Forecast - By Country/Sub-region
- 13.1.1 Brazil
- 13.1.2 United Arab Emirates
- 13.1.3 South Africa
- 13.1.4 Other Countries
- 14. Competitive Analysis
- 14.1. Global Market Share Analysis 2024
- 14.2. Company Profiles
- 14.2.1 The Hertz Corporation
- 14.2.1.1. Overview
- 14.2.1.2. Products
- 14.2.1.3. SWOT Analysis
- 14.2.1.4. Recent Developments
- 14.2.1.5. Financials (Based on Availability)
- 14.2.2 Arnold Clark
- 14.2.2.1. Overview
- 14.2.2.2. Products
- 14.2.2.3. SWOT Analysis
- 14.2.2.4. Recent Developments
- 14.2.2.5. Financials (Based on Availability)
- 14.2.3 Cox Automotive
- 14.2.3.1. Overview
- 14.2.3.2. Products
- 14.2.3.3. SWOT Analysis
- 14.2.3.4. Recent Developments
- 14.2.3.5. Financials (Based on Availability)
- 14.2.4 Pendragon PLC
- 14.2.4.1. Overview
- 14.2.4.2. Products
- 14.2.4.3. SWOT Analysis
- 14.2.4.4. Recent Developments
- 14.2.4.5. Financials (Based on Availability)
- 14.2.5 Carro
- 14.2.5.1. Overview
- 14.2.5.2. Products
- 14.2.5.3. SWOT Analysis
- 14.2.5.4. Recent Developments
- 14.2.5.5. Financials (Based on Availability)
- 14.2.6 AutoNation
- 14.2.6.1. Overview
- 14.2.6.2. Products
- 14.2.6.3. SWOT Analysis
- 14.2.6.4. Recent Developments
- 14.2.6.5. Financials (Based on Availability)
- 14.2.7 Asbury Automotive Grou
- 14.2.7.1. Overview
- 14.2.7.2. Products
- 14.2.7.3. SWOT Analysis
- 14.2.7.4. Recent Developments
- 14.2.7.5. Financials (Based on Availability)
- 14.2.8 Mahindra First Choice Wheels
- 14.2.8.1. Overview
- 14.2.8.2. Products
- 14.2.8.3. SWOT Analysis
- 14.2.8.4. Recent Developments
- 14.2.8.5. Financials (Based on Availability)
- 14.2.9 Penske Cars
- 14.2.9.1. Overview
- 14.2.9.2. Products
- 14.2.9.3. SWOT Analysis
- 14.2.9.4. Recent Developments
- 14.2.9.5. Financials (Based on Availability)
- 14.2.10 CarMax Inc
- 14.2.10.1. Overview
- 14.2.10.2. Products
- 14.2.10.3. SWOT Analysis
- 14.2.10.4. Recent Developments
- 14.2.10.5. Financials (Based on Availability)
- 14.2.11 Maruti Suzuki True Value
- 14.2.11.1. Overview
- 14.2.11.2. Products
- 14.2.11.3. SWOT Analysis
- 14.2.11.4. Recent Developments
- 14.2.11.5. Financials (Based on Availability)
- 14.2.12 Emil Frey AG
- 14.2.12.1. Overview
- 14.2.12.2. Products
- 14.2.12.3. SWOT Analysis
- 14.2.12.4. Recent Developments
- 14.2.12.5. Financials (Based on Availability)
- 14.2.1 The Hertz Corporation
List of Figures
- Figure 1: Global Used Car Industry Revenue Breakdown (Million, %) by Region 2024 & 2032
- Figure 2: North America Used Car Industry Revenue (Million), by Country 2024 & 2032
- Figure 3: North America Used Car Industry Revenue Share (%), by Country 2024 & 2032
- Figure 4: Europe Used Car Industry Revenue (Million), by Country 2024 & 2032
- Figure 5: Europe Used Car Industry Revenue Share (%), by Country 2024 & 2032
- Figure 6: Asia Pacific Used Car Industry Revenue (Million), by Country 2024 & 2032
- Figure 7: Asia Pacific Used Car Industry Revenue Share (%), by Country 2024 & 2032
- Figure 8: Rest of the World Used Car Industry Revenue (Million), by Country 2024 & 2032
- Figure 9: Rest of the World Used Car Industry Revenue Share (%), by Country 2024 & 2032
- Figure 10: North America Used Car Industry Revenue (Million), by Vehicle Type 2024 & 2032
- Figure 11: North America Used Car Industry Revenue Share (%), by Vehicle Type 2024 & 2032
- Figure 12: North America Used Car Industry Revenue (Million), by Vendor 2024 & 2032
- Figure 13: North America Used Car Industry Revenue Share (%), by Vendor 2024 & 2032
- Figure 14: North America Used Car Industry Revenue (Million), by Country 2024 & 2032
- Figure 15: North America Used Car Industry Revenue Share (%), by Country 2024 & 2032
- Figure 16: Europe Used Car Industry Revenue (Million), by Vehicle Type 2024 & 2032
- Figure 17: Europe Used Car Industry Revenue Share (%), by Vehicle Type 2024 & 2032
- Figure 18: Europe Used Car Industry Revenue (Million), by Vendor 2024 & 2032
- Figure 19: Europe Used Car Industry Revenue Share (%), by Vendor 2024 & 2032
- Figure 20: Europe Used Car Industry Revenue (Million), by Country 2024 & 2032
- Figure 21: Europe Used Car Industry Revenue Share (%), by Country 2024 & 2032
- Figure 22: Asia Pacific Used Car Industry Revenue (Million), by Vehicle Type 2024 & 2032
- Figure 23: Asia Pacific Used Car Industry Revenue Share (%), by Vehicle Type 2024 & 2032
- Figure 24: Asia Pacific Used Car Industry Revenue (Million), by Vendor 2024 & 2032
- Figure 25: Asia Pacific Used Car Industry Revenue Share (%), by Vendor 2024 & 2032
- Figure 26: Asia Pacific Used Car Industry Revenue (Million), by Country 2024 & 2032
- Figure 27: Asia Pacific Used Car Industry Revenue Share (%), by Country 2024 & 2032
- Figure 28: Rest of the World Used Car Industry Revenue (Million), by Vehicle Type 2024 & 2032
- Figure 29: Rest of the World Used Car Industry Revenue Share (%), by Vehicle Type 2024 & 2032
- Figure 30: Rest of the World Used Car Industry Revenue (Million), by Vendor 2024 & 2032
- Figure 31: Rest of the World Used Car Industry Revenue Share (%), by Vendor 2024 & 2032
- Figure 32: Rest of the World Used Car Industry Revenue (Million), by Country 2024 & 2032
- Figure 33: Rest of the World Used Car Industry Revenue Share (%), by Country 2024 & 2032
List of Tables
- Table 1: Global Used Car Industry Revenue Million Forecast, by Region 2019 & 2032
- Table 2: Global Used Car Industry Revenue Million Forecast, by Vehicle Type 2019 & 2032
- Table 3: Global Used Car Industry Revenue Million Forecast, by Vendor 2019 & 2032
- Table 4: Global Used Car Industry Revenue Million Forecast, by Region 2019 & 2032
- Table 5: Global Used Car Industry Revenue Million Forecast, by Country 2019 & 2032
- Table 6: United States Used Car Industry Revenue (Million) Forecast, by Application 2019 & 2032
- Table 7: Canada Used Car Industry Revenue (Million) Forecast, by Application 2019 & 2032
- Table 8: Rest of North America Used Car Industry Revenue (Million) Forecast, by Application 2019 & 2032
- Table 9: Global Used Car Industry Revenue Million Forecast, by Country 2019 & 2032
- Table 10: Germany Used Car Industry Revenue (Million) Forecast, by Application 2019 & 2032
- Table 11: United Kingdom Used Car Industry Revenue (Million) Forecast, by Application 2019 & 2032
- Table 12: France Used Car Industry Revenue (Million) Forecast, by Application 2019 & 2032
- Table 13: Spain Used Car Industry Revenue (Million) Forecast, by Application 2019 & 2032
- Table 14: Rest of Europe Used Car Industry Revenue (Million) Forecast, by Application 2019 & 2032
- Table 15: Global Used Car Industry Revenue Million Forecast, by Country 2019 & 2032
- Table 16: China Used Car Industry Revenue (Million) Forecast, by Application 2019 & 2032
- Table 17: India Used Car Industry Revenue (Million) Forecast, by Application 2019 & 2032
- Table 18: Japan Used Car Industry Revenue (Million) Forecast, by Application 2019 & 2032
- Table 19: South Korea Used Car Industry Revenue (Million) Forecast, by Application 2019 & 2032
- Table 20: Rest of Asia Pacific Used Car Industry Revenue (Million) Forecast, by Application 2019 & 2032
- Table 21: Global Used Car Industry Revenue Million Forecast, by Country 2019 & 2032
- Table 22: Brazil Used Car Industry Revenue (Million) Forecast, by Application 2019 & 2032
- Table 23: United Arab Emirates Used Car Industry Revenue (Million) Forecast, by Application 2019 & 2032
- Table 24: South Africa Used Car Industry Revenue (Million) Forecast, by Application 2019 & 2032
- Table 25: Other Countries Used Car Industry Revenue (Million) Forecast, by Application 2019 & 2032
- Table 26: Global Used Car Industry Revenue Million Forecast, by Vehicle Type 2019 & 2032
- Table 27: Global Used Car Industry Revenue Million Forecast, by Vendor 2019 & 2032
- Table 28: Global Used Car Industry Revenue Million Forecast, by Country 2019 & 2032
- Table 29: United States Used Car Industry Revenue (Million) Forecast, by Application 2019 & 2032
- Table 30: Canada Used Car Industry Revenue (Million) Forecast, by Application 2019 & 2032
- Table 31: Rest of North America Used Car Industry Revenue (Million) Forecast, by Application 2019 & 2032
- Table 32: Global Used Car Industry Revenue Million Forecast, by Vehicle Type 2019 & 2032
- Table 33: Global Used Car Industry Revenue Million Forecast, by Vendor 2019 & 2032
- Table 34: Global Used Car Industry Revenue Million Forecast, by Country 2019 & 2032
- Table 35: Germany Used Car Industry Revenue (Million) Forecast, by Application 2019 & 2032
- Table 36: United Kingdom Used Car Industry Revenue (Million) Forecast, by Application 2019 & 2032
- Table 37: France Used Car Industry Revenue (Million) Forecast, by Application 2019 & 2032
- Table 38: Spain Used Car Industry Revenue (Million) Forecast, by Application 2019 & 2032
- Table 39: Rest of Europe Used Car Industry Revenue (Million) Forecast, by Application 2019 & 2032
- Table 40: Global Used Car Industry Revenue Million Forecast, by Vehicle Type 2019 & 2032
- Table 41: Global Used Car Industry Revenue Million Forecast, by Vendor 2019 & 2032
- Table 42: Global Used Car Industry Revenue Million Forecast, by Country 2019 & 2032
- Table 43: China Used Car Industry Revenue (Million) Forecast, by Application 2019 & 2032
- Table 44: India Used Car Industry Revenue (Million) Forecast, by Application 2019 & 2032
- Table 45: Japan Used Car Industry Revenue (Million) Forecast, by Application 2019 & 2032
- Table 46: South Korea Used Car Industry Revenue (Million) Forecast, by Application 2019 & 2032
- Table 47: Rest of Asia Pacific Used Car Industry Revenue (Million) Forecast, by Application 2019 & 2032
- Table 48: Global Used Car Industry Revenue Million Forecast, by Vehicle Type 2019 & 2032
- Table 49: Global Used Car Industry Revenue Million Forecast, by Vendor 2019 & 2032
- Table 50: Global Used Car Industry Revenue Million Forecast, by Country 2019 & 2032
- Table 51: Brazil Used Car Industry Revenue (Million) Forecast, by Application 2019 & 2032
- Table 52: United Arab Emirates Used Car Industry Revenue (Million) Forecast, by Application 2019 & 2032
- Table 53: South Africa Used Car Industry Revenue (Million) Forecast, by Application 2019 & 2032
- Table 54: Other Countries Used Car Industry Revenue (Million) Forecast, by Application 2019 & 2032
Frequently Asked Questions
1. What is the projected Compound Annual Growth Rate (CAGR) of the Used Car Industry?
The projected CAGR is approximately 10.00%.
2. Which companies are prominent players in the Used Car Industry?
Key companies in the market include The Hertz Corporation, Arnold Clark, Cox Automotive, Pendragon PLC, Carro, AutoNation, Asbury Automotive Grou, Mahindra First Choice Wheels, Penske Cars, CarMax Inc, Maruti Suzuki True Value, Emil Frey AG.
3. What are the main segments of the Used Car Industry?
The market segments include Vehicle Type, Vendor.
4. Can you provide details about the market size?
The market size is estimated to be USD XX Million as of 2022.
5. What are some drivers contributing to market growth?
Increasing Demand For Electric School Buses.
6. What are the notable trends driving market growth?
Strengthening of Online Infrastructure Positively Affecting the Used Cars Market.
7. Are there any restraints impacting market growth?
Uncertainty of The Global Pandemic.
8. Can you provide examples of recent developments in the market?
March 2022: TrueCar Inc. launched a new online car-buying marketplace called TrueCar+. TrueCar+ will provide consumers with a more flexible and personalized car buying experience for new and used vehicles.
9. What pricing options are available for accessing the report?
Pricing options include single-user, multi-user, and enterprise licenses priced at USD 4750, USD 5250, and USD 8750 respectively.
10. Is the market size provided in terms of value or volume?
The market size is provided in terms of value, measured in Million.
11. Are there any specific market keywords associated with the report?
Yes, the market keyword associated with the report is "Used Car Industry," which aids in identifying and referencing the specific market segment covered.
12. How do I determine which pricing option suits my needs best?
The pricing options vary based on user requirements and access needs. Individual users may opt for single-user licenses, while businesses requiring broader access may choose multi-user or enterprise licenses for cost-effective access to the report.
13. Are there any additional resources or data provided in the Used Car Industry report?
While the report offers comprehensive insights, it's advisable to review the specific contents or supplementary materials provided to ascertain if additional resources or data are available.
14. How can I stay updated on further developments or reports in the Used Car Industry?
To stay informed about further developments, trends, and reports in the Used Car Industry, consider subscribing to industry newsletters, following relevant companies and organizations, or regularly checking reputable industry news sources and publications.
Methodology
Step 1 - Identification of Relevant Samples Size from Population Database


Step 2 - Approaches for Defining Global Market Size (Value, Volume* & Price*)

Note*: In applicable scenarios
Step 3 - Data Sources
Primary Research
- Web Analytics
- Survey Reports
- Research Institute
- Latest Research Reports
- Opinion Leaders
Secondary Research
- Annual Reports
- White Paper
- Latest Press Release
- Industry Association
- Paid Database
- Investor Presentations

Step 4 - Data Triangulation
Involves using different sources of information in order to increase the validity of a study
These sources are likely to be stakeholders in a program - participants, other researchers, program staff, other community members, and so on.
Then we put all data in single framework & apply various statistical tools to find out the dynamic on the market.
During the analysis stage, feedback from the stakeholder groups would be compared to determine areas of agreement as well as areas of divergence
