

Key Insights
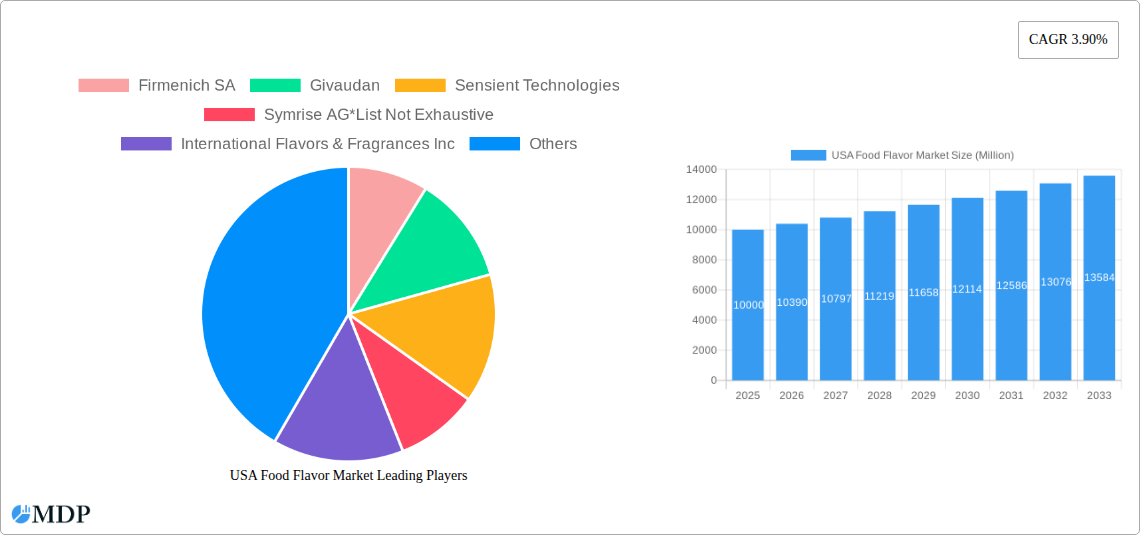
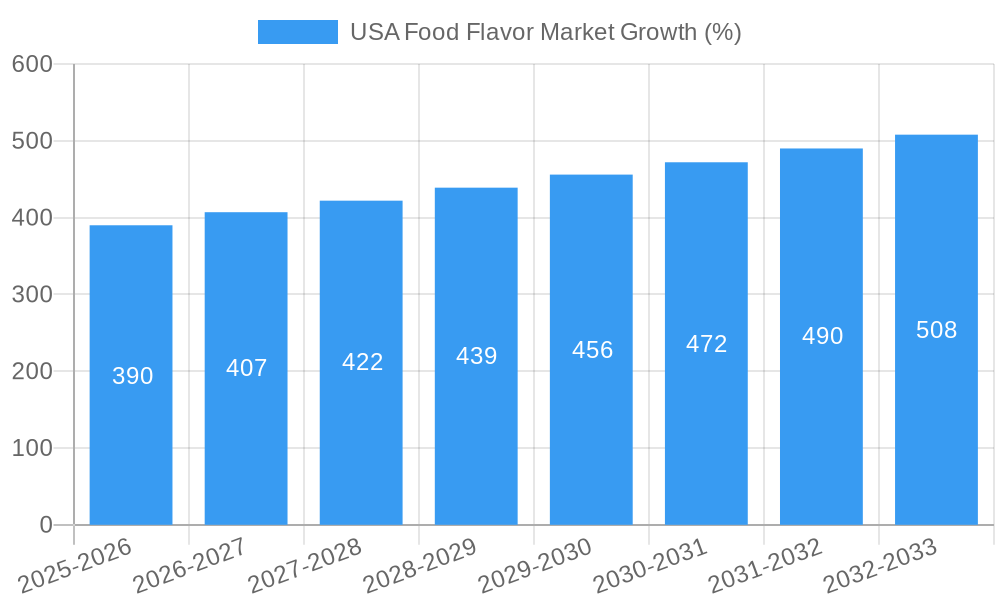
The USA food flavor market, a significant segment of the global food and beverage industry, is experiencing steady growth, projected to maintain a CAGR of 3.90% from 2025 to 2033. This expansion is fueled by several key drivers, including the increasing demand for convenient and ready-to-eat meals, the rising popularity of diverse and globally-inspired cuisines, and the growing consumer preference for enhanced taste and sensory experiences in food products. The market's segmentation reveals substantial opportunities across various product types, with natural flavors witnessing strong growth driven by health-conscious consumers. Application-wise, the dairy, bakery, and confectionery sectors constitute major end-use industries, while the beverage and meat, poultry, and seafood segments are exhibiting robust growth potential. Key players like Firmenich SA, Givaudan, and International Flavors & Fragrances Inc. are strategically investing in research and development to introduce innovative flavor profiles and cater to evolving consumer preferences. Competitive dynamics are characterized by both established multinational corporations and specialized regional players.
The market's growth trajectory, however, isn't without challenges. Rising raw material costs and stringent regulatory requirements concerning the use of artificial flavors are potential restraints. Furthermore, fluctuating consumer preferences and the increasing demand for clean-label ingredients necessitate continuous innovation and adaptation by market participants. Despite these challenges, the overall outlook remains positive, driven by the enduring demand for palatable food products and the ongoing evolution of consumer tastes across various demographics. The continued growth in the food processing industry, along with the expansion of food service sectors, provides a strong foundation for future expansion in the US food flavor market. This market shows significant potential for expansion through targeted product development focused on natural and clean-label ingredients, particularly in the rapidly expanding functional foods and beverages sector.
Unlock the Flavors of Success: A Comprehensive Analysis of the USA Food Flavor Market (2019-2033)
This meticulously researched report provides a comprehensive overview of the dynamic USA Food Flavor Market, offering invaluable insights for industry stakeholders, investors, and strategic decision-makers. With a detailed analysis spanning the period 2019-2033, this report unveils the market's current state, future trajectory, and key players shaping its evolution. The market is projected to reach xx Million by 2033, presenting lucrative opportunities for growth and innovation.
USA Food Flavor Market Market Dynamics & Concentration
The USA Food Flavor Market exhibits a moderately concentrated landscape, with key players such as Firmenich SA, Givaudan, Sensient Technologies, Symrise AG, International Flavors & Fragrances Inc, Archer Daniels Midland Company, and Flavorchem Corporation holding significant market share. However, the market also accommodates numerous smaller specialized companies. Market concentration is influenced by factors such as economies of scale in production, R&D investments, and established distribution networks. The market's dynamic nature is driven by continuous innovation in flavor profiles, a growing demand for natural and clean-label products, stringent regulatory frameworks governing food additives, the emergence of product substitutes (e.g., plant-based alternatives), and evolving consumer preferences towards diverse and healthier food options.
- Market Share: Firmenich SA and Givaudan collectively hold approximately xx% of the market share (estimated), while other major players share the remaining percentage.
- Innovation Drivers: Consumer demand for novel flavor experiences, the rise of personalized nutrition, and the increasing focus on natural and organic ingredients are fueling innovation.
- Regulatory Framework: The FDA's regulations concerning food additives and labeling significantly influence product development and market access.
- M&A Activities: The past five years have witnessed xx M&A deals in the USA Food Flavor Market (estimated), reflecting strategic consolidation and expansion efforts by key players.
USA Food Flavor Market Industry Trends & Analysis
The USA Food Flavor Market is experiencing robust growth, driven by several key trends. The market's CAGR during the forecast period (2025-2033) is projected at xx%, exceeding the global average. This growth is fueled by rising disposable incomes, increasing consumer spending on food and beverages, a growing preference for convenience foods, and the expanding food service sector. Technological advancements in flavor creation and delivery systems are further enhancing the market's dynamics. The market penetration of natural and clean-label flavors is steadily increasing, exceeding xx% in 2025 (estimated). However, increasing competition, fluctuating raw material prices, and evolving consumer preferences present challenges to sustained growth.
Leading Markets & Segments in USA Food Flavor Market
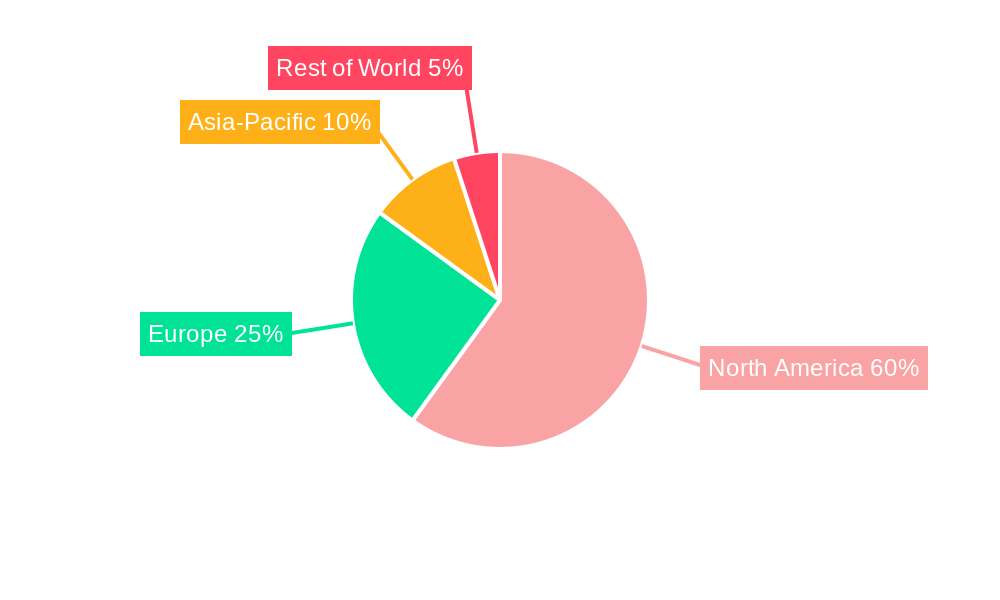
The Beverage segment dominates the USA Food Flavor Market by application, accounting for an estimated xx% of the market value in 2025. The strong growth in the ready-to-drink beverage sector and the increasing demand for flavored beverages are key drivers. Within product types, Natural Flavors represent a significant and rapidly growing segment, driven by escalating health consciousness among consumers.
Key Drivers by Segment:
- Beverage: Strong growth in ready-to-drink beverages, increasing demand for flavored water and functional beverages.
- Dairy: Growing popularity of flavored yogurts, ice creams, and milk-based beverages.
- Natural Flavors: Increased consumer preference for natural ingredients and clean-label products.
- Synthetic Flavors: Cost-effectiveness and ability to create specific flavor profiles.
Dominance Analysis:
The significant market share held by the beverage segment stems from the high volume consumption of flavored drinks and the constant innovation within this sector. The rising demand for natural flavors reflects the overall shift towards healthier lifestyles.
USA Food Flavor Market Product Developments
Recent product developments focus on creating novel flavor profiles to cater to evolving consumer preferences, such as the integration of ethnic flavors and the creation of unique flavor combinations. The use of clean-label ingredients and sustainable sourcing practices is gaining prominence. Technological advancements in flavor encapsulation and delivery systems are improving the stability and sensory experience of flavored products. This innovation is crucial for maintaining a competitive advantage in this dynamic market.
Key Drivers of USA Food Flavor Market Growth
Several factors contribute to the USA Food Flavor Market's growth. The increasing demand for convenient, ready-to-eat meals, coupled with the rise of the food service industry, fuels demand for flavorful ingredients. Technological advancements in flavor extraction and creation, allowing for the development of more complex and nuanced flavors, are another major driver. Furthermore, the growing interest in personalized nutrition and unique flavor experiences further fuels market expansion.
Challenges in the USA Food Flavor Market Market
The USA Food Flavor Market faces significant challenges. Strict regulatory frameworks surrounding food additives and labeling can increase development costs and complicate product launches. Fluctuations in raw material prices, especially for natural ingredients, impact profitability. Furthermore, intense competition from both established and emerging players necessitates continuous innovation and strategic maneuvering to maintain market share. The market's susceptibility to economic downturns also presents a considerable challenge.
Emerging Opportunities in USA Food Flavor Market
Significant opportunities exist within the USA Food Flavor Market. The growing demand for customized flavor solutions for specific dietary needs, such as vegan or gluten-free products, opens avenues for targeted product development. Technological breakthroughs in flavor technology, like the use of precision fermentation, present opportunities for creating novel flavor profiles and expanding the range of available flavors. Furthermore, strategic partnerships with food and beverage companies can provide access to wider distribution networks and increased market penetration.
Leading Players in the USA Food Flavor Market Sector
- Firmenich SA
- Givaudan
- Sensient Technologies
- Symrise AG
- International Flavors & Fragrances Inc
- Archer Daniels Midland Company
- Flavorchem Corporation
Key Milestones in USA Food Flavor Market Industry
- 2020: Increased focus on natural and clean-label ingredients.
- 2021: Several key players launched new product lines focusing on unique flavor profiles.
- 2022: Significant investments in R&D for advanced flavor technologies.
- 2023: Several mergers and acquisitions reshaped the market landscape.
- 2024: Growing adoption of sustainable sourcing practices by major players.
Strategic Outlook for USA Food Flavor Market Market
The USA Food Flavor Market is poised for continued growth, driven by the enduring demand for diverse and flavorful food products. Strategic partnerships, investments in R&D, and the development of innovative flavor solutions will be critical success factors for industry players. Companies that successfully adapt to evolving consumer preferences and regulatory changes while embracing sustainable practices are well-positioned to capture significant market share in the years to come.
USA Food Flavor Market Segmentation
-
1. Product Type
- 1.1. Natural Flavor
- 1.2. Synthetic Flavor
- 1.3. Nature Identical Flavoring
-
2. Application
- 2.1. Dairy
- 2.2. Bakery
- 2.3. Confectionery
- 2.4. Meat, Poultry, and Seafood
- 2.5. Beverage
- 2.6. Others
USA Food Flavor Market Segmentation By Geography
-
1. North America
- 1.1. United States
- 1.2. Canada
- 1.3. Mexico
-
2. South America
- 2.1. Brazil
- 2.2. Argentina
- 2.3. Rest of South America
-
3. Europe
- 3.1. United Kingdom
- 3.2. Germany
- 3.3. France
- 3.4. Italy
- 3.5. Spain
- 3.6. Russia
- 3.7. Benelux
- 3.8. Nordics
- 3.9. Rest of Europe
-
4. Middle East & Africa
- 4.1. Turkey
- 4.2. Israel
- 4.3. GCC
- 4.4. North Africa
- 4.5. South Africa
- 4.6. Rest of Middle East & Africa
-
5. Asia Pacific
- 5.1. China
- 5.2. India
- 5.3. Japan
- 5.4. South Korea
- 5.5. ASEAN
- 5.6. Oceania
- 5.7. Rest of Asia Pacific
USA Food Flavor Market REPORT HIGHLIGHTS
| Aspects | Details |
|---|---|
| Study Period | 2019-2033 |
| Base Year | 2024 |
| Estimated Year | 2025 |
| Forecast Period | 2025-2033 |
| Historical Period | 2019-2024 |
| Growth Rate | CAGR of 3.90% from 2019-2033 |
| Segmentation |
|
Table of Contents
- 1. Introduction
- 1.1. Research Scope
- 1.2. Market Segmentation
- 1.3. Research Methodology
- 1.4. Definitions and Assumptions
- 2. Executive Summary
- 2.1. Introduction
- 3. Market Dynamics
- 3.1. Introduction
- 3.2. Market Drivers
- 3.2.1. Surge in Demand for 'Free-from' Food Products; Demand For Convenient And Healthy On-the-go Snacking Options
- 3.3. Market Restrains
- 3.3.1. Health Risk Associated with Certain Ingredients
- 3.4. Market Trends
- 3.4.1. Elevating Demand for Natural Food Flavors
- 4. Market Factor Analysis
- 4.1. Porters Five Forces
- 4.2. Supply/Value Chain
- 4.3. PESTEL analysis
- 4.4. Market Entropy
- 4.5. Patent/Trademark Analysis
- 5. Global USA Food Flavor Market Analysis, Insights and Forecast, 2019-2031
- 5.1. Market Analysis, Insights and Forecast - by Product Type
- 5.1.1. Natural Flavor
- 5.1.2. Synthetic Flavor
- 5.1.3. Nature Identical Flavoring
- 5.2. Market Analysis, Insights and Forecast - by Application
- 5.2.1. Dairy
- 5.2.2. Bakery
- 5.2.3. Confectionery
- 5.2.4. Meat, Poultry, and Seafood
- 5.2.5. Beverage
- 5.2.6. Others
- 5.3. Market Analysis, Insights and Forecast - by Region
- 5.3.1. North America
- 5.3.2. South America
- 5.3.3. Europe
- 5.3.4. Middle East & Africa
- 5.3.5. Asia Pacific
- 5.1. Market Analysis, Insights and Forecast - by Product Type
- 6. North America USA Food Flavor Market Analysis, Insights and Forecast, 2019-2031
- 6.1. Market Analysis, Insights and Forecast - by Product Type
- 6.1.1. Natural Flavor
- 6.1.2. Synthetic Flavor
- 6.1.3. Nature Identical Flavoring
- 6.2. Market Analysis, Insights and Forecast - by Application
- 6.2.1. Dairy
- 6.2.2. Bakery
- 6.2.3. Confectionery
- 6.2.4. Meat, Poultry, and Seafood
- 6.2.5. Beverage
- 6.2.6. Others
- 6.1. Market Analysis, Insights and Forecast - by Product Type
- 7. South America USA Food Flavor Market Analysis, Insights and Forecast, 2019-2031
- 7.1. Market Analysis, Insights and Forecast - by Product Type
- 7.1.1. Natural Flavor
- 7.1.2. Synthetic Flavor
- 7.1.3. Nature Identical Flavoring
- 7.2. Market Analysis, Insights and Forecast - by Application
- 7.2.1. Dairy
- 7.2.2. Bakery
- 7.2.3. Confectionery
- 7.2.4. Meat, Poultry, and Seafood
- 7.2.5. Beverage
- 7.2.6. Others
- 7.1. Market Analysis, Insights and Forecast - by Product Type
- 8. Europe USA Food Flavor Market Analysis, Insights and Forecast, 2019-2031
- 8.1. Market Analysis, Insights and Forecast - by Product Type
- 8.1.1. Natural Flavor
- 8.1.2. Synthetic Flavor
- 8.1.3. Nature Identical Flavoring
- 8.2. Market Analysis, Insights and Forecast - by Application
- 8.2.1. Dairy
- 8.2.2. Bakery
- 8.2.3. Confectionery
- 8.2.4. Meat, Poultry, and Seafood
- 8.2.5. Beverage
- 8.2.6. Others
- 8.1. Market Analysis, Insights and Forecast - by Product Type
- 9. Middle East & Africa USA Food Flavor Market Analysis, Insights and Forecast, 2019-2031
- 9.1. Market Analysis, Insights and Forecast - by Product Type
- 9.1.1. Natural Flavor
- 9.1.2. Synthetic Flavor
- 9.1.3. Nature Identical Flavoring
- 9.2. Market Analysis, Insights and Forecast - by Application
- 9.2.1. Dairy
- 9.2.2. Bakery
- 9.2.3. Confectionery
- 9.2.4. Meat, Poultry, and Seafood
- 9.2.5. Beverage
- 9.2.6. Others
- 9.1. Market Analysis, Insights and Forecast - by Product Type
- 10. Asia Pacific USA Food Flavor Market Analysis, Insights and Forecast, 2019-2031
- 10.1. Market Analysis, Insights and Forecast - by Product Type
- 10.1.1. Natural Flavor
- 10.1.2. Synthetic Flavor
- 10.1.3. Nature Identical Flavoring
- 10.2. Market Analysis, Insights and Forecast - by Application
- 10.2.1. Dairy
- 10.2.2. Bakery
- 10.2.3. Confectionery
- 10.2.4. Meat, Poultry, and Seafood
- 10.2.5. Beverage
- 10.2.6. Others
- 10.1. Market Analysis, Insights and Forecast - by Product Type
- 11. United States USA Food Flavor Market Analysis, Insights and Forecast, 2019-2031
- 12. Canada USA Food Flavor Market Analysis, Insights and Forecast, 2019-2031
- 13. Mexico USA Food Flavor Market Analysis, Insights and Forecast, 2019-2031
- 14. Competitive Analysis
- 14.1. Global Market Share Analysis 2024
- 14.2. Company Profiles
- 14.2.1 Firmenich SA
- 14.2.1.1. Overview
- 14.2.1.2. Products
- 14.2.1.3. SWOT Analysis
- 14.2.1.4. Recent Developments
- 14.2.1.5. Financials (Based on Availability)
- 14.2.2 Givaudan
- 14.2.2.1. Overview
- 14.2.2.2. Products
- 14.2.2.3. SWOT Analysis
- 14.2.2.4. Recent Developments
- 14.2.2.5. Financials (Based on Availability)
- 14.2.3 Sensient Technologies
- 14.2.3.1. Overview
- 14.2.3.2. Products
- 14.2.3.3. SWOT Analysis
- 14.2.3.4. Recent Developments
- 14.2.3.5. Financials (Based on Availability)
- 14.2.4 Symrise AG*List Not Exhaustive
- 14.2.4.1. Overview
- 14.2.4.2. Products
- 14.2.4.3. SWOT Analysis
- 14.2.4.4. Recent Developments
- 14.2.4.5. Financials (Based on Availability)
- 14.2.5 International Flavors & Fragrances Inc
- 14.2.5.1. Overview
- 14.2.5.2. Products
- 14.2.5.3. SWOT Analysis
- 14.2.5.4. Recent Developments
- 14.2.5.5. Financials (Based on Availability)
- 14.2.6 Archer Daniels Midland Company
- 14.2.6.1. Overview
- 14.2.6.2. Products
- 14.2.6.3. SWOT Analysis
- 14.2.6.4. Recent Developments
- 14.2.6.5. Financials (Based on Availability)
- 14.2.7 Flavorchem Corporation
- 14.2.7.1. Overview
- 14.2.7.2. Products
- 14.2.7.3. SWOT Analysis
- 14.2.7.4. Recent Developments
- 14.2.7.5. Financials (Based on Availability)
- 14.2.1 Firmenich SA
List of Figures
- Figure 1: Global USA Food Flavor Market Revenue Breakdown (Million, %) by Region 2024 & 2032
- Figure 2: Global USA Food Flavor Market Volume Breakdown (K Units, %) by Region 2024 & 2032
- Figure 3: North America USA Food Flavor Market Revenue (Million), by Country 2024 & 2032
- Figure 4: North America USA Food Flavor Market Volume (K Units), by Country 2024 & 2032
- Figure 5: North America USA Food Flavor Market Revenue Share (%), by Country 2024 & 2032
- Figure 6: North America USA Food Flavor Market Volume Share (%), by Country 2024 & 2032
- Figure 7: North America USA Food Flavor Market Revenue (Million), by Product Type 2024 & 2032
- Figure 8: North America USA Food Flavor Market Volume (K Units), by Product Type 2024 & 2032
- Figure 9: North America USA Food Flavor Market Revenue Share (%), by Product Type 2024 & 2032
- Figure 10: North America USA Food Flavor Market Volume Share (%), by Product Type 2024 & 2032
- Figure 11: North America USA Food Flavor Market Revenue (Million), by Application 2024 & 2032
- Figure 12: North America USA Food Flavor Market Volume (K Units), by Application 2024 & 2032
- Figure 13: North America USA Food Flavor Market Revenue Share (%), by Application 2024 & 2032
- Figure 14: North America USA Food Flavor Market Volume Share (%), by Application 2024 & 2032
- Figure 15: North America USA Food Flavor Market Revenue (Million), by Country 2024 & 2032
- Figure 16: North America USA Food Flavor Market Volume (K Units), by Country 2024 & 2032
- Figure 17: North America USA Food Flavor Market Revenue Share (%), by Country 2024 & 2032
- Figure 18: North America USA Food Flavor Market Volume Share (%), by Country 2024 & 2032
- Figure 19: South America USA Food Flavor Market Revenue (Million), by Product Type 2024 & 2032
- Figure 20: South America USA Food Flavor Market Volume (K Units), by Product Type 2024 & 2032
- Figure 21: South America USA Food Flavor Market Revenue Share (%), by Product Type 2024 & 2032
- Figure 22: South America USA Food Flavor Market Volume Share (%), by Product Type 2024 & 2032
- Figure 23: South America USA Food Flavor Market Revenue (Million), by Application 2024 & 2032
- Figure 24: South America USA Food Flavor Market Volume (K Units), by Application 2024 & 2032
- Figure 25: South America USA Food Flavor Market Revenue Share (%), by Application 2024 & 2032
- Figure 26: South America USA Food Flavor Market Volume Share (%), by Application 2024 & 2032
- Figure 27: South America USA Food Flavor Market Revenue (Million), by Country 2024 & 2032
- Figure 28: South America USA Food Flavor Market Volume (K Units), by Country 2024 & 2032
- Figure 29: South America USA Food Flavor Market Revenue Share (%), by Country 2024 & 2032
- Figure 30: South America USA Food Flavor Market Volume Share (%), by Country 2024 & 2032
- Figure 31: Europe USA Food Flavor Market Revenue (Million), by Product Type 2024 & 2032
- Figure 32: Europe USA Food Flavor Market Volume (K Units), by Product Type 2024 & 2032
- Figure 33: Europe USA Food Flavor Market Revenue Share (%), by Product Type 2024 & 2032
- Figure 34: Europe USA Food Flavor Market Volume Share (%), by Product Type 2024 & 2032
- Figure 35: Europe USA Food Flavor Market Revenue (Million), by Application 2024 & 2032
- Figure 36: Europe USA Food Flavor Market Volume (K Units), by Application 2024 & 2032
- Figure 37: Europe USA Food Flavor Market Revenue Share (%), by Application 2024 & 2032
- Figure 38: Europe USA Food Flavor Market Volume Share (%), by Application 2024 & 2032
- Figure 39: Europe USA Food Flavor Market Revenue (Million), by Country 2024 & 2032
- Figure 40: Europe USA Food Flavor Market Volume (K Units), by Country 2024 & 2032
- Figure 41: Europe USA Food Flavor Market Revenue Share (%), by Country 2024 & 2032
- Figure 42: Europe USA Food Flavor Market Volume Share (%), by Country 2024 & 2032
- Figure 43: Middle East & Africa USA Food Flavor Market Revenue (Million), by Product Type 2024 & 2032
- Figure 44: Middle East & Africa USA Food Flavor Market Volume (K Units), by Product Type 2024 & 2032
- Figure 45: Middle East & Africa USA Food Flavor Market Revenue Share (%), by Product Type 2024 & 2032
- Figure 46: Middle East & Africa USA Food Flavor Market Volume Share (%), by Product Type 2024 & 2032
- Figure 47: Middle East & Africa USA Food Flavor Market Revenue (Million), by Application 2024 & 2032
- Figure 48: Middle East & Africa USA Food Flavor Market Volume (K Units), by Application 2024 & 2032
- Figure 49: Middle East & Africa USA Food Flavor Market Revenue Share (%), by Application 2024 & 2032
- Figure 50: Middle East & Africa USA Food Flavor Market Volume Share (%), by Application 2024 & 2032
- Figure 51: Middle East & Africa USA Food Flavor Market Revenue (Million), by Country 2024 & 2032
- Figure 52: Middle East & Africa USA Food Flavor Market Volume (K Units), by Country 2024 & 2032
- Figure 53: Middle East & Africa USA Food Flavor Market Revenue Share (%), by Country 2024 & 2032
- Figure 54: Middle East & Africa USA Food Flavor Market Volume Share (%), by Country 2024 & 2032
- Figure 55: Asia Pacific USA Food Flavor Market Revenue (Million), by Product Type 2024 & 2032
- Figure 56: Asia Pacific USA Food Flavor Market Volume (K Units), by Product Type 2024 & 2032
- Figure 57: Asia Pacific USA Food Flavor Market Revenue Share (%), by Product Type 2024 & 2032
- Figure 58: Asia Pacific USA Food Flavor Market Volume Share (%), by Product Type 2024 & 2032
- Figure 59: Asia Pacific USA Food Flavor Market Revenue (Million), by Application 2024 & 2032
- Figure 60: Asia Pacific USA Food Flavor Market Volume (K Units), by Application 2024 & 2032
- Figure 61: Asia Pacific USA Food Flavor Market Revenue Share (%), by Application 2024 & 2032
- Figure 62: Asia Pacific USA Food Flavor Market Volume Share (%), by Application 2024 & 2032
- Figure 63: Asia Pacific USA Food Flavor Market Revenue (Million), by Country 2024 & 2032
- Figure 64: Asia Pacific USA Food Flavor Market Volume (K Units), by Country 2024 & 2032
- Figure 65: Asia Pacific USA Food Flavor Market Revenue Share (%), by Country 2024 & 2032
- Figure 66: Asia Pacific USA Food Flavor Market Volume Share (%), by Country 2024 & 2032
List of Tables
- Table 1: Global USA Food Flavor Market Revenue Million Forecast, by Region 2019 & 2032
- Table 2: Global USA Food Flavor Market Volume K Units Forecast, by Region 2019 & 2032
- Table 3: Global USA Food Flavor Market Revenue Million Forecast, by Product Type 2019 & 2032
- Table 4: Global USA Food Flavor Market Volume K Units Forecast, by Product Type 2019 & 2032
- Table 5: Global USA Food Flavor Market Revenue Million Forecast, by Application 2019 & 2032
- Table 6: Global USA Food Flavor Market Volume K Units Forecast, by Application 2019 & 2032
- Table 7: Global USA Food Flavor Market Revenue Million Forecast, by Region 2019 & 2032
- Table 8: Global USA Food Flavor Market Volume K Units Forecast, by Region 2019 & 2032
- Table 9: Global USA Food Flavor Market Revenue Million Forecast, by Country 2019 & 2032
- Table 10: Global USA Food Flavor Market Volume K Units Forecast, by Country 2019 & 2032
- Table 11: United States USA Food Flavor Market Revenue (Million) Forecast, by Application 2019 & 2032
- Table 12: United States USA Food Flavor Market Volume (K Units) Forecast, by Application 2019 & 2032
- Table 13: Canada USA Food Flavor Market Revenue (Million) Forecast, by Application 2019 & 2032
- Table 14: Canada USA Food Flavor Market Volume (K Units) Forecast, by Application 2019 & 2032
- Table 15: Mexico USA Food Flavor Market Revenue (Million) Forecast, by Application 2019 & 2032
- Table 16: Mexico USA Food Flavor Market Volume (K Units) Forecast, by Application 2019 & 2032
- Table 17: Global USA Food Flavor Market Revenue Million Forecast, by Product Type 2019 & 2032
- Table 18: Global USA Food Flavor Market Volume K Units Forecast, by Product Type 2019 & 2032
- Table 19: Global USA Food Flavor Market Revenue Million Forecast, by Application 2019 & 2032
- Table 20: Global USA Food Flavor Market Volume K Units Forecast, by Application 2019 & 2032
- Table 21: Global USA Food Flavor Market Revenue Million Forecast, by Country 2019 & 2032
- Table 22: Global USA Food Flavor Market Volume K Units Forecast, by Country 2019 & 2032
- Table 23: United States USA Food Flavor Market Revenue (Million) Forecast, by Application 2019 & 2032
- Table 24: United States USA Food Flavor Market Volume (K Units) Forecast, by Application 2019 & 2032
- Table 25: Canada USA Food Flavor Market Revenue (Million) Forecast, by Application 2019 & 2032
- Table 26: Canada USA Food Flavor Market Volume (K Units) Forecast, by Application 2019 & 2032
- Table 27: Mexico USA Food Flavor Market Revenue (Million) Forecast, by Application 2019 & 2032
- Table 28: Mexico USA Food Flavor Market Volume (K Units) Forecast, by Application 2019 & 2032
- Table 29: Global USA Food Flavor Market Revenue Million Forecast, by Product Type 2019 & 2032
- Table 30: Global USA Food Flavor Market Volume K Units Forecast, by Product Type 2019 & 2032
- Table 31: Global USA Food Flavor Market Revenue Million Forecast, by Application 2019 & 2032
- Table 32: Global USA Food Flavor Market Volume K Units Forecast, by Application 2019 & 2032
- Table 33: Global USA Food Flavor Market Revenue Million Forecast, by Country 2019 & 2032
- Table 34: Global USA Food Flavor Market Volume K Units Forecast, by Country 2019 & 2032
- Table 35: Brazil USA Food Flavor Market Revenue (Million) Forecast, by Application 2019 & 2032
- Table 36: Brazil USA Food Flavor Market Volume (K Units) Forecast, by Application 2019 & 2032
- Table 37: Argentina USA Food Flavor Market Revenue (Million) Forecast, by Application 2019 & 2032
- Table 38: Argentina USA Food Flavor Market Volume (K Units) Forecast, by Application 2019 & 2032
- Table 39: Rest of South America USA Food Flavor Market Revenue (Million) Forecast, by Application 2019 & 2032
- Table 40: Rest of South America USA Food Flavor Market Volume (K Units) Forecast, by Application 2019 & 2032
- Table 41: Global USA Food Flavor Market Revenue Million Forecast, by Product Type 2019 & 2032
- Table 42: Global USA Food Flavor Market Volume K Units Forecast, by Product Type 2019 & 2032
- Table 43: Global USA Food Flavor Market Revenue Million Forecast, by Application 2019 & 2032
- Table 44: Global USA Food Flavor Market Volume K Units Forecast, by Application 2019 & 2032
- Table 45: Global USA Food Flavor Market Revenue Million Forecast, by Country 2019 & 2032
- Table 46: Global USA Food Flavor Market Volume K Units Forecast, by Country 2019 & 2032
- Table 47: United Kingdom USA Food Flavor Market Revenue (Million) Forecast, by Application 2019 & 2032
- Table 48: United Kingdom USA Food Flavor Market Volume (K Units) Forecast, by Application 2019 & 2032
- Table 49: Germany USA Food Flavor Market Revenue (Million) Forecast, by Application 2019 & 2032
- Table 50: Germany USA Food Flavor Market Volume (K Units) Forecast, by Application 2019 & 2032
- Table 51: France USA Food Flavor Market Revenue (Million) Forecast, by Application 2019 & 2032
- Table 52: France USA Food Flavor Market Volume (K Units) Forecast, by Application 2019 & 2032
- Table 53: Italy USA Food Flavor Market Revenue (Million) Forecast, by Application 2019 & 2032
- Table 54: Italy USA Food Flavor Market Volume (K Units) Forecast, by Application 2019 & 2032
- Table 55: Spain USA Food Flavor Market Revenue (Million) Forecast, by Application 2019 & 2032
- Table 56: Spain USA Food Flavor Market Volume (K Units) Forecast, by Application 2019 & 2032
- Table 57: Russia USA Food Flavor Market Revenue (Million) Forecast, by Application 2019 & 2032
- Table 58: Russia USA Food Flavor Market Volume (K Units) Forecast, by Application 2019 & 2032
- Table 59: Benelux USA Food Flavor Market Revenue (Million) Forecast, by Application 2019 & 2032
- Table 60: Benelux USA Food Flavor Market Volume (K Units) Forecast, by Application 2019 & 2032
- Table 61: Nordics USA Food Flavor Market Revenue (Million) Forecast, by Application 2019 & 2032
- Table 62: Nordics USA Food Flavor Market Volume (K Units) Forecast, by Application 2019 & 2032
- Table 63: Rest of Europe USA Food Flavor Market Revenue (Million) Forecast, by Application 2019 & 2032
- Table 64: Rest of Europe USA Food Flavor Market Volume (K Units) Forecast, by Application 2019 & 2032
- Table 65: Global USA Food Flavor Market Revenue Million Forecast, by Product Type 2019 & 2032
- Table 66: Global USA Food Flavor Market Volume K Units Forecast, by Product Type 2019 & 2032
- Table 67: Global USA Food Flavor Market Revenue Million Forecast, by Application 2019 & 2032
- Table 68: Global USA Food Flavor Market Volume K Units Forecast, by Application 2019 & 2032
- Table 69: Global USA Food Flavor Market Revenue Million Forecast, by Country 2019 & 2032
- Table 70: Global USA Food Flavor Market Volume K Units Forecast, by Country 2019 & 2032
- Table 71: Turkey USA Food Flavor Market Revenue (Million) Forecast, by Application 2019 & 2032
- Table 72: Turkey USA Food Flavor Market Volume (K Units) Forecast, by Application 2019 & 2032
- Table 73: Israel USA Food Flavor Market Revenue (Million) Forecast, by Application 2019 & 2032
- Table 74: Israel USA Food Flavor Market Volume (K Units) Forecast, by Application 2019 & 2032
- Table 75: GCC USA Food Flavor Market Revenue (Million) Forecast, by Application 2019 & 2032
- Table 76: GCC USA Food Flavor Market Volume (K Units) Forecast, by Application 2019 & 2032
- Table 77: North Africa USA Food Flavor Market Revenue (Million) Forecast, by Application 2019 & 2032
- Table 78: North Africa USA Food Flavor Market Volume (K Units) Forecast, by Application 2019 & 2032
- Table 79: South Africa USA Food Flavor Market Revenue (Million) Forecast, by Application 2019 & 2032
- Table 80: South Africa USA Food Flavor Market Volume (K Units) Forecast, by Application 2019 & 2032
- Table 81: Rest of Middle East & Africa USA Food Flavor Market Revenue (Million) Forecast, by Application 2019 & 2032
- Table 82: Rest of Middle East & Africa USA Food Flavor Market Volume (K Units) Forecast, by Application 2019 & 2032
- Table 83: Global USA Food Flavor Market Revenue Million Forecast, by Product Type 2019 & 2032
- Table 84: Global USA Food Flavor Market Volume K Units Forecast, by Product Type 2019 & 2032
- Table 85: Global USA Food Flavor Market Revenue Million Forecast, by Application 2019 & 2032
- Table 86: Global USA Food Flavor Market Volume K Units Forecast, by Application 2019 & 2032
- Table 87: Global USA Food Flavor Market Revenue Million Forecast, by Country 2019 & 2032
- Table 88: Global USA Food Flavor Market Volume K Units Forecast, by Country 2019 & 2032
- Table 89: China USA Food Flavor Market Revenue (Million) Forecast, by Application 2019 & 2032
- Table 90: China USA Food Flavor Market Volume (K Units) Forecast, by Application 2019 & 2032
- Table 91: India USA Food Flavor Market Revenue (Million) Forecast, by Application 2019 & 2032
- Table 92: India USA Food Flavor Market Volume (K Units) Forecast, by Application 2019 & 2032
- Table 93: Japan USA Food Flavor Market Revenue (Million) Forecast, by Application 2019 & 2032
- Table 94: Japan USA Food Flavor Market Volume (K Units) Forecast, by Application 2019 & 2032
- Table 95: South Korea USA Food Flavor Market Revenue (Million) Forecast, by Application 2019 & 2032
- Table 96: South Korea USA Food Flavor Market Volume (K Units) Forecast, by Application 2019 & 2032
- Table 97: ASEAN USA Food Flavor Market Revenue (Million) Forecast, by Application 2019 & 2032
- Table 98: ASEAN USA Food Flavor Market Volume (K Units) Forecast, by Application 2019 & 2032
- Table 99: Oceania USA Food Flavor Market Revenue (Million) Forecast, by Application 2019 & 2032
- Table 100: Oceania USA Food Flavor Market Volume (K Units) Forecast, by Application 2019 & 2032
- Table 101: Rest of Asia Pacific USA Food Flavor Market Revenue (Million) Forecast, by Application 2019 & 2032
- Table 102: Rest of Asia Pacific USA Food Flavor Market Volume (K Units) Forecast, by Application 2019 & 2032
Frequently Asked Questions
1. What is the projected Compound Annual Growth Rate (CAGR) of the USA Food Flavor Market?
The projected CAGR is approximately 3.90%.
2. Which companies are prominent players in the USA Food Flavor Market?
Key companies in the market include Firmenich SA, Givaudan, Sensient Technologies, Symrise AG*List Not Exhaustive, International Flavors & Fragrances Inc, Archer Daniels Midland Company, Flavorchem Corporation.
3. What are the main segments of the USA Food Flavor Market?
The market segments include Product Type, Application.
4. Can you provide details about the market size?
The market size is estimated to be USD XX Million as of 2022.
5. What are some drivers contributing to market growth?
Surge in Demand for 'Free-from' Food Products; Demand For Convenient And Healthy On-the-go Snacking Options.
6. What are the notable trends driving market growth?
Elevating Demand for Natural Food Flavors.
7. Are there any restraints impacting market growth?
Health Risk Associated with Certain Ingredients.
8. Can you provide examples of recent developments in the market?
N/A
9. What pricing options are available for accessing the report?
Pricing options include single-user, multi-user, and enterprise licenses priced at USD 3800, USD 4500, and USD 5800 respectively.
10. Is the market size provided in terms of value or volume?
The market size is provided in terms of value, measured in Million and volume, measured in K Units.
11. Are there any specific market keywords associated with the report?
Yes, the market keyword associated with the report is "USA Food Flavor Market," which aids in identifying and referencing the specific market segment covered.
12. How do I determine which pricing option suits my needs best?
The pricing options vary based on user requirements and access needs. Individual users may opt for single-user licenses, while businesses requiring broader access may choose multi-user or enterprise licenses for cost-effective access to the report.
13. Are there any additional resources or data provided in the USA Food Flavor Market report?
While the report offers comprehensive insights, it's advisable to review the specific contents or supplementary materials provided to ascertain if additional resources or data are available.
14. How can I stay updated on further developments or reports in the USA Food Flavor Market?
To stay informed about further developments, trends, and reports in the USA Food Flavor Market, consider subscribing to industry newsletters, following relevant companies and organizations, or regularly checking reputable industry news sources and publications.
Methodology
Step 1 - Identification of Relevant Samples Size from Population Database


Step 2 - Approaches for Defining Global Market Size (Value, Volume* & Price*)

Note*: In applicable scenarios
Step 3 - Data Sources
Primary Research
- Web Analytics
- Survey Reports
- Research Institute
- Latest Research Reports
- Opinion Leaders
Secondary Research
- Annual Reports
- White Paper
- Latest Press Release
- Industry Association
- Paid Database
- Investor Presentations

Step 4 - Data Triangulation
Involves using different sources of information in order to increase the validity of a study
These sources are likely to be stakeholders in a program - participants, other researchers, program staff, other community members, and so on.
Then we put all data in single framework & apply various statistical tools to find out the dynamic on the market.
During the analysis stage, feedback from the stakeholder groups would be compared to determine areas of agreement as well as areas of divergence
