

Key Insights
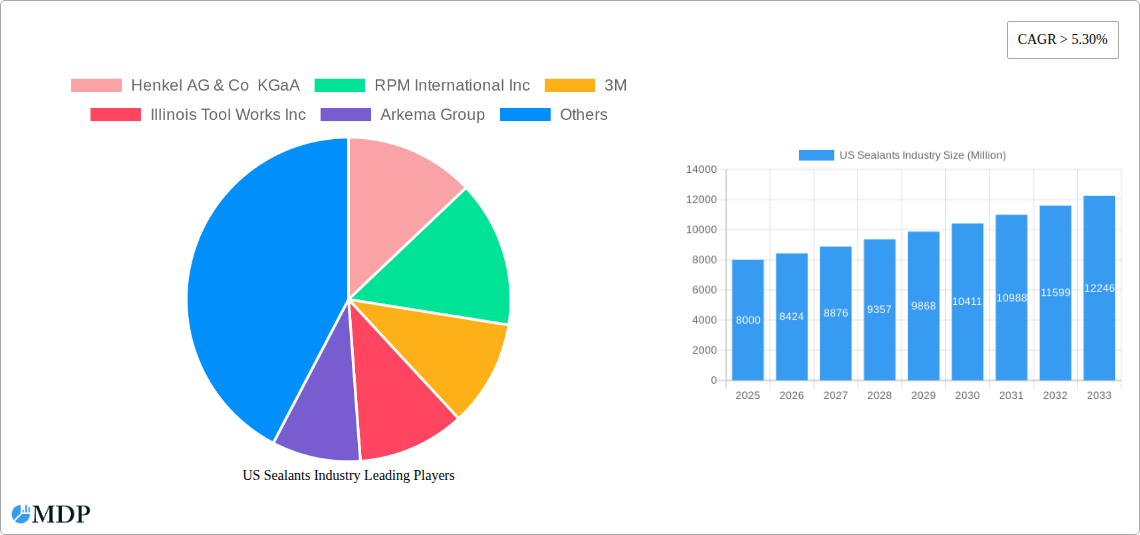
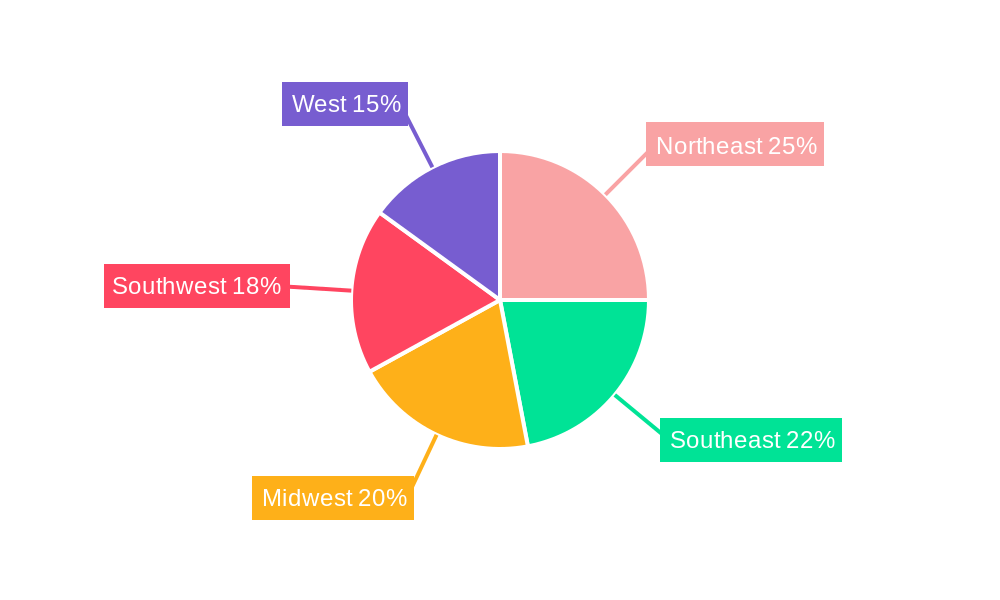
The US sealants market, valued at approximately $8 billion in 2025, is experiencing robust growth, projected to maintain a Compound Annual Growth Rate (CAGR) exceeding 5.3% through 2033. This expansion is fueled by several key drivers. The burgeoning construction industry, particularly in residential and commercial sectors, significantly boosts demand for sealants across various applications. Furthermore, the growing automotive and aerospace industries require high-performance sealants for superior durability and weather resistance. The increasing adoption of sustainable building practices and the rising focus on energy efficiency further stimulate market growth, as sealants play a crucial role in improving building insulation and reducing energy consumption. Technological advancements leading to the development of innovative sealant formulations, such as those with enhanced durability, flexibility, and adhesion properties, also contribute to market expansion. While raw material price fluctuations and potential supply chain disruptions represent challenges, the overall market outlook remains positive. The market segmentation reveals a significant contribution from the building and construction end-user industry, along with strong demand for acrylic, epoxy, and polyurethane resins. Regional analysis indicates a strong market presence across all US regions, with potential for growth variations based on specific construction activity and infrastructure development projects within each region.
The competitive landscape is characterized by a mix of established multinational corporations and specialized regional players. Companies like Henkel, 3M, and Dow hold significant market share, leveraging their extensive product portfolios and established distribution networks. However, smaller, specialized firms are also gaining traction, focusing on niche applications or offering innovative sealant solutions. The market's future trajectory will likely be shaped by the continued growth of the construction sector, advancements in sealant technology, and the increasing focus on environmentally friendly and sustainable products. Successful players will be those who can adapt to evolving industry standards, maintain robust supply chains, and effectively address the specific needs of diverse end-user industries. The integration of smart technologies and data analytics will also play a crucial role in optimizing manufacturing processes and improving product performance.
US Sealants Industry Market Report: 2019-2033
This comprehensive report provides an in-depth analysis of the US sealants industry, covering market dynamics, leading players, key trends, and future growth prospects. The study period spans from 2019 to 2033, with 2025 as the base and estimated year. This report is crucial for industry stakeholders, investors, and strategic decision-makers seeking to navigate this dynamic market. Discover actionable insights and strategic recommendations to capitalize on emerging opportunities.
US Sealants Industry Market Dynamics & Concentration
The US sealants market, valued at $xx Million in 2024, is characterized by moderate concentration, with key players holding significant market share. The industry witnesses continuous innovation driven by the need for high-performance, sustainable, and specialized sealants across diverse applications. Stringent regulatory frameworks, particularly concerning VOC emissions and environmental impact, shape product development and manufacturing processes. Existing sealants face competition from alternative materials, such as advanced tapes and gaskets, although sealants maintain a strong market position due to their versatility and performance characteristics. End-user trends, such as the growing demand for energy-efficient buildings and advanced automotive technologies, significantly influence market growth. Mergers and acquisitions (M&A) are frequent, reflecting the industry's consolidation and the pursuit of technological advancements.
- Market Share: The top 5 players account for approximately xx% of the market share.
- M&A Activity: An estimated xx M&A deals occurred between 2019 and 2024.
US Sealants Industry Industry Trends & Analysis
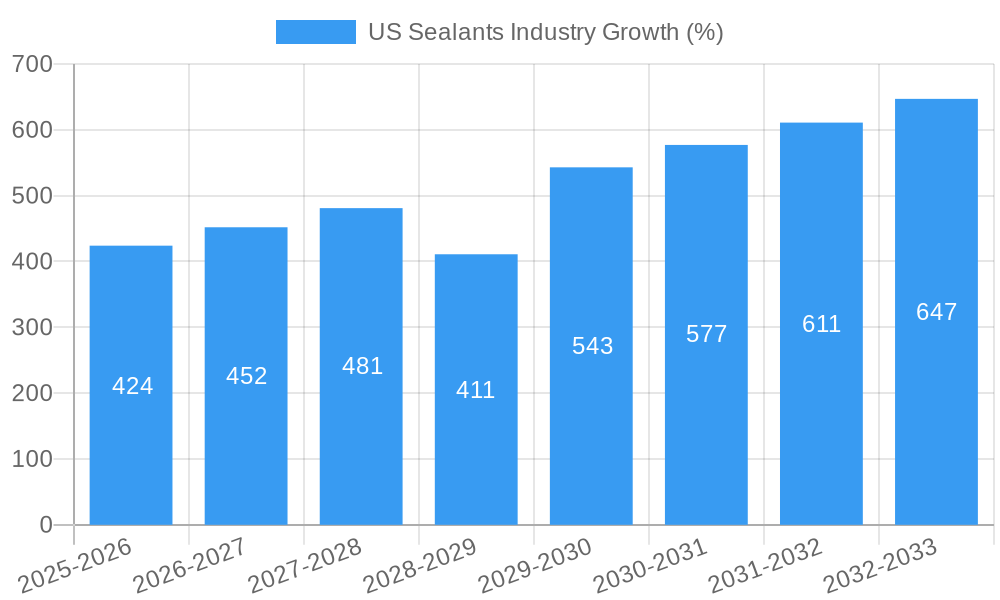
The US sealants market exhibits a robust Compound Annual Growth Rate (CAGR) of xx% during the forecast period (2025-2033). Several factors drive this growth, including the booming construction sector, the increasing demand for high-performance sealants in aerospace and automotive applications, and the growing focus on sustainable building practices. Technological advancements, such as the development of self-healing sealants and advanced curing technologies, are further transforming the industry. Consumer preferences are shifting towards environmentally friendly and durable sealants, influencing product innovation and market penetration. Intense competition among established players and emerging companies fosters innovation and pricing pressures. Market penetration of advanced sealant types, like silicone and polyurethane sealants, is steadily increasing, replacing traditional acrylic sealants in niche applications.
Leading Markets & Segments in US Sealants Industry
The building and construction sector dominates the US sealants market, driven by the robust infrastructure development and renovation activities. Within resins, silicone sealants hold the largest market share due to their superior performance and durability across various applications.
Key Drivers for Leading Segments:
- Building & Construction: Government infrastructure investments, new construction projects, and building renovations.
- Automotive: Stringent automotive regulations, increasing vehicle production, and the rising demand for lightweight vehicles.
- Silicone Resin: Superior properties such as weather resistance, flexibility, and durability compared to other resins.
Dominance Analysis:
The building and construction segment consistently accounts for the largest revenue share, benefiting from the cyclical nature of the construction industry and government spending. Silicone resins exhibit strong dominance due to their versatile properties and suitability across various applications in the construction, automotive and other industries. However, the growth of other resin types like polyurethane is noteworthy due to their expanding use in specific high-performance applications.
US Sealants Industry Product Developments
Recent innovations include the introduction of self-healing sealants, advanced UV-resistant formulations, and improved fire-retardant sealants. These advancements cater to the growing demand for high-performance sealants with extended lifespans and enhanced safety features. Manufacturers are focusing on developing eco-friendly, low-VOC sealants to comply with stringent environmental regulations and meet consumer demand for sustainable products. This focus on sustainability and performance drives competitive advantages in the market.
Key Drivers of US Sealants Industry Growth
Several factors contribute to the growth of the US sealants industry. Firstly, the robust construction sector, driven by infrastructure investments and residential construction, is a key driver. Secondly, technological advancements, such as the development of high-performance sealants with enhanced properties (e.g., UV resistance, durability), fuel market growth. Finally, stringent environmental regulations, pushing for eco-friendly sealants, also contribute to this growth as manufacturers adapt to meet these demands.
Challenges in the US Sealants Industry Market
The industry faces challenges such as fluctuating raw material prices, impacting profitability. Supply chain disruptions can lead to production delays and increased costs. Intense competition from both established players and new entrants puts pressure on pricing and margins. Furthermore, compliance with stringent environmental regulations adds to the cost of production. These factors collectively impact market dynamics and growth trajectories.
Emerging Opportunities in US Sealants Industry
The industry is poised for growth due to several opportunities. The increasing adoption of green building technologies and sustainable materials presents opportunities for eco-friendly sealants. Strategic partnerships and collaborations between sealant manufacturers and end-users to develop customized solutions will create niche markets. Expansion into emerging markets and regions with significant construction activities offers potential for market expansion and revenue growth.
Leading Players in the US Sealants Industry Sector
- Henkel AG & Co KGaA
- RPM International Inc
- 3M
- Illinois Tool Works Inc
- Arkema Group
- Dow
- H B Fuller Company
- Sika A
- MAPEI S p A
- Pecora Corporation
Key Milestones in US Sealants Industry Industry
- July 2021: RPM International Inc. expands its manufacturing capacity with a new facility in Texas, strengthening its supply chain.
- April 2021: Sika AG acquires Hamatite, expanding its product portfolio and market presence in the automotive and construction sectors.
- January 2020: H.B. Fuller Company launches a new line of Gorilla professional-grade adhesives and sealants, targeting the MRO industrial market.
Strategic Outlook for US Sealants Industry Market
The US sealants market is expected to witness sustained growth, driven by ongoing infrastructure development, technological advancements in sealant formulations, and the growing demand for sustainable and high-performance products. Strategic partnerships, product diversification, and expansion into niche applications will be crucial for success. Companies focusing on innovation, sustainability, and supply chain resilience will be best positioned to capitalize on the market's potential for growth in the coming years.
US Sealants Industry Segmentation
-
1. End User Industry
- 1.1. Aerospace
- 1.2. Automotive
- 1.3. Building and Construction
- 1.4. Healthcare
- 1.5. Other End-user Industries
-
2. Resin
- 2.1. Acrylic
- 2.2. Epoxy
- 2.3. Polyurethane
- 2.4. Silicone
- 2.5. Other Resins
US Sealants Industry Segmentation By Geography
-
1. North America
- 1.1. United States
- 1.2. Canada
- 1.3. Mexico
-
2. South America
- 2.1. Brazil
- 2.2. Argentina
- 2.3. Rest of South America
-
3. Europe
- 3.1. United Kingdom
- 3.2. Germany
- 3.3. France
- 3.4. Italy
- 3.5. Spain
- 3.6. Russia
- 3.7. Benelux
- 3.8. Nordics
- 3.9. Rest of Europe
-
4. Middle East & Africa
- 4.1. Turkey
- 4.2. Israel
- 4.3. GCC
- 4.4. North Africa
- 4.5. South Africa
- 4.6. Rest of Middle East & Africa
-
5. Asia Pacific
- 5.1. China
- 5.2. India
- 5.3. Japan
- 5.4. South Korea
- 5.5. ASEAN
- 5.6. Oceania
- 5.7. Rest of Asia Pacific
US Sealants Industry REPORT HIGHLIGHTS
| Aspects | Details |
|---|---|
| Study Period | 2019-2033 |
| Base Year | 2024 |
| Estimated Year | 2025 |
| Forecast Period | 2025-2033 |
| Historical Period | 2019-2024 |
| Growth Rate | CAGR of > 5.30% from 2019-2033 |
| Segmentation |
|
Table of Contents
- 1. Introduction
- 1.1. Research Scope
- 1.2. Market Segmentation
- 1.3. Research Methodology
- 1.4. Definitions and Assumptions
- 2. Executive Summary
- 2.1. Introduction
- 3. Market Dynamics
- 3.1. Introduction
- 3.2. Market Drivers
- 3.2.1. Rising Demand from the Construction Industry in Saudi Arabia; Other Drivers
- 3.3. Market Restrains
- 3.3.1. ; Impact of COVID-19 Pandemic on Global Economy
- 3.4. Market Trends
- 3.4.1. OTHER KEY INDUSTRY TRENDS COVERED IN THE REPORT
- 4. Market Factor Analysis
- 4.1. Porters Five Forces
- 4.2. Supply/Value Chain
- 4.3. PESTEL analysis
- 4.4. Market Entropy
- 4.5. Patent/Trademark Analysis
- 5. Global US Sealants Industry Analysis, Insights and Forecast, 2019-2031
- 5.1. Market Analysis, Insights and Forecast - by End User Industry
- 5.1.1. Aerospace
- 5.1.2. Automotive
- 5.1.3. Building and Construction
- 5.1.4. Healthcare
- 5.1.5. Other End-user Industries
- 5.2. Market Analysis, Insights and Forecast - by Resin
- 5.2.1. Acrylic
- 5.2.2. Epoxy
- 5.2.3. Polyurethane
- 5.2.4. Silicone
- 5.2.5. Other Resins
- 5.3. Market Analysis, Insights and Forecast - by Region
- 5.3.1. North America
- 5.3.2. South America
- 5.3.3. Europe
- 5.3.4. Middle East & Africa
- 5.3.5. Asia Pacific
- 5.1. Market Analysis, Insights and Forecast - by End User Industry
- 6. North America US Sealants Industry Analysis, Insights and Forecast, 2019-2031
- 6.1. Market Analysis, Insights and Forecast - by End User Industry
- 6.1.1. Aerospace
- 6.1.2. Automotive
- 6.1.3. Building and Construction
- 6.1.4. Healthcare
- 6.1.5. Other End-user Industries
- 6.2. Market Analysis, Insights and Forecast - by Resin
- 6.2.1. Acrylic
- 6.2.2. Epoxy
- 6.2.3. Polyurethane
- 6.2.4. Silicone
- 6.2.5. Other Resins
- 6.1. Market Analysis, Insights and Forecast - by End User Industry
- 7. South America US Sealants Industry Analysis, Insights and Forecast, 2019-2031
- 7.1. Market Analysis, Insights and Forecast - by End User Industry
- 7.1.1. Aerospace
- 7.1.2. Automotive
- 7.1.3. Building and Construction
- 7.1.4. Healthcare
- 7.1.5. Other End-user Industries
- 7.2. Market Analysis, Insights and Forecast - by Resin
- 7.2.1. Acrylic
- 7.2.2. Epoxy
- 7.2.3. Polyurethane
- 7.2.4. Silicone
- 7.2.5. Other Resins
- 7.1. Market Analysis, Insights and Forecast - by End User Industry
- 8. Europe US Sealants Industry Analysis, Insights and Forecast, 2019-2031
- 8.1. Market Analysis, Insights and Forecast - by End User Industry
- 8.1.1. Aerospace
- 8.1.2. Automotive
- 8.1.3. Building and Construction
- 8.1.4. Healthcare
- 8.1.5. Other End-user Industries
- 8.2. Market Analysis, Insights and Forecast - by Resin
- 8.2.1. Acrylic
- 8.2.2. Epoxy
- 8.2.3. Polyurethane
- 8.2.4. Silicone
- 8.2.5. Other Resins
- 8.1. Market Analysis, Insights and Forecast - by End User Industry
- 9. Middle East & Africa US Sealants Industry Analysis, Insights and Forecast, 2019-2031
- 9.1. Market Analysis, Insights and Forecast - by End User Industry
- 9.1.1. Aerospace
- 9.1.2. Automotive
- 9.1.3. Building and Construction
- 9.1.4. Healthcare
- 9.1.5. Other End-user Industries
- 9.2. Market Analysis, Insights and Forecast - by Resin
- 9.2.1. Acrylic
- 9.2.2. Epoxy
- 9.2.3. Polyurethane
- 9.2.4. Silicone
- 9.2.5. Other Resins
- 9.1. Market Analysis, Insights and Forecast - by End User Industry
- 10. Asia Pacific US Sealants Industry Analysis, Insights and Forecast, 2019-2031
- 10.1. Market Analysis, Insights and Forecast - by End User Industry
- 10.1.1. Aerospace
- 10.1.2. Automotive
- 10.1.3. Building and Construction
- 10.1.4. Healthcare
- 10.1.5. Other End-user Industries
- 10.2. Market Analysis, Insights and Forecast - by Resin
- 10.2.1. Acrylic
- 10.2.2. Epoxy
- 10.2.3. Polyurethane
- 10.2.4. Silicone
- 10.2.5. Other Resins
- 10.1. Market Analysis, Insights and Forecast - by End User Industry
- 11. Northeast US Sealants Industry Analysis, Insights and Forecast, 2019-2031
- 12. Southeast US Sealants Industry Analysis, Insights and Forecast, 2019-2031
- 13. Midwest US Sealants Industry Analysis, Insights and Forecast, 2019-2031
- 14. Southwest US Sealants Industry Analysis, Insights and Forecast, 2019-2031
- 15. West US Sealants Industry Analysis, Insights and Forecast, 2019-2031
- 16. Competitive Analysis
- 16.1. Global Market Share Analysis 2024
- 16.2. Company Profiles
- 16.2.1 Henkel AG & Co KGaA
- 16.2.1.1. Overview
- 16.2.1.2. Products
- 16.2.1.3. SWOT Analysis
- 16.2.1.4. Recent Developments
- 16.2.1.5. Financials (Based on Availability)
- 16.2.2 RPM International Inc
- 16.2.2.1. Overview
- 16.2.2.2. Products
- 16.2.2.3. SWOT Analysis
- 16.2.2.4. Recent Developments
- 16.2.2.5. Financials (Based on Availability)
- 16.2.3 3M
- 16.2.3.1. Overview
- 16.2.3.2. Products
- 16.2.3.3. SWOT Analysis
- 16.2.3.4. Recent Developments
- 16.2.3.5. Financials (Based on Availability)
- 16.2.4 Illinois Tool Works Inc
- 16.2.4.1. Overview
- 16.2.4.2. Products
- 16.2.4.3. SWOT Analysis
- 16.2.4.4. Recent Developments
- 16.2.4.5. Financials (Based on Availability)
- 16.2.5 Arkema Group
- 16.2.5.1. Overview
- 16.2.5.2. Products
- 16.2.5.3. SWOT Analysis
- 16.2.5.4. Recent Developments
- 16.2.5.5. Financials (Based on Availability)
- 16.2.6 Dow
- 16.2.6.1. Overview
- 16.2.6.2. Products
- 16.2.6.3. SWOT Analysis
- 16.2.6.4. Recent Developments
- 16.2.6.5. Financials (Based on Availability)
- 16.2.7 H B Fuller Company
- 16.2.7.1. Overview
- 16.2.7.2. Products
- 16.2.7.3. SWOT Analysis
- 16.2.7.4. Recent Developments
- 16.2.7.5. Financials (Based on Availability)
- 16.2.8 Sika A
- 16.2.8.1. Overview
- 16.2.8.2. Products
- 16.2.8.3. SWOT Analysis
- 16.2.8.4. Recent Developments
- 16.2.8.5. Financials (Based on Availability)
- 16.2.9 MAPEI S p A
- 16.2.9.1. Overview
- 16.2.9.2. Products
- 16.2.9.3. SWOT Analysis
- 16.2.9.4. Recent Developments
- 16.2.9.5. Financials (Based on Availability)
- 16.2.10 Pecora Corporation
- 16.2.10.1. Overview
- 16.2.10.2. Products
- 16.2.10.3. SWOT Analysis
- 16.2.10.4. Recent Developments
- 16.2.10.5. Financials (Based on Availability)
- 16.2.1 Henkel AG & Co KGaA
List of Figures
- Figure 1: Global US Sealants Industry Revenue Breakdown (Million, %) by Region 2024 & 2032
- Figure 2: United states US Sealants Industry Revenue (Million), by Country 2024 & 2032
- Figure 3: United states US Sealants Industry Revenue Share (%), by Country 2024 & 2032
- Figure 4: North America US Sealants Industry Revenue (Million), by End User Industry 2024 & 2032
- Figure 5: North America US Sealants Industry Revenue Share (%), by End User Industry 2024 & 2032
- Figure 6: North America US Sealants Industry Revenue (Million), by Resin 2024 & 2032
- Figure 7: North America US Sealants Industry Revenue Share (%), by Resin 2024 & 2032
- Figure 8: North America US Sealants Industry Revenue (Million), by Country 2024 & 2032
- Figure 9: North America US Sealants Industry Revenue Share (%), by Country 2024 & 2032
- Figure 10: South America US Sealants Industry Revenue (Million), by End User Industry 2024 & 2032
- Figure 11: South America US Sealants Industry Revenue Share (%), by End User Industry 2024 & 2032
- Figure 12: South America US Sealants Industry Revenue (Million), by Resin 2024 & 2032
- Figure 13: South America US Sealants Industry Revenue Share (%), by Resin 2024 & 2032
- Figure 14: South America US Sealants Industry Revenue (Million), by Country 2024 & 2032
- Figure 15: South America US Sealants Industry Revenue Share (%), by Country 2024 & 2032
- Figure 16: Europe US Sealants Industry Revenue (Million), by End User Industry 2024 & 2032
- Figure 17: Europe US Sealants Industry Revenue Share (%), by End User Industry 2024 & 2032
- Figure 18: Europe US Sealants Industry Revenue (Million), by Resin 2024 & 2032
- Figure 19: Europe US Sealants Industry Revenue Share (%), by Resin 2024 & 2032
- Figure 20: Europe US Sealants Industry Revenue (Million), by Country 2024 & 2032
- Figure 21: Europe US Sealants Industry Revenue Share (%), by Country 2024 & 2032
- Figure 22: Middle East & Africa US Sealants Industry Revenue (Million), by End User Industry 2024 & 2032
- Figure 23: Middle East & Africa US Sealants Industry Revenue Share (%), by End User Industry 2024 & 2032
- Figure 24: Middle East & Africa US Sealants Industry Revenue (Million), by Resin 2024 & 2032
- Figure 25: Middle East & Africa US Sealants Industry Revenue Share (%), by Resin 2024 & 2032
- Figure 26: Middle East & Africa US Sealants Industry Revenue (Million), by Country 2024 & 2032
- Figure 27: Middle East & Africa US Sealants Industry Revenue Share (%), by Country 2024 & 2032
- Figure 28: Asia Pacific US Sealants Industry Revenue (Million), by End User Industry 2024 & 2032
- Figure 29: Asia Pacific US Sealants Industry Revenue Share (%), by End User Industry 2024 & 2032
- Figure 30: Asia Pacific US Sealants Industry Revenue (Million), by Resin 2024 & 2032
- Figure 31: Asia Pacific US Sealants Industry Revenue Share (%), by Resin 2024 & 2032
- Figure 32: Asia Pacific US Sealants Industry Revenue (Million), by Country 2024 & 2032
- Figure 33: Asia Pacific US Sealants Industry Revenue Share (%), by Country 2024 & 2032
List of Tables
- Table 1: Global US Sealants Industry Revenue Million Forecast, by Region 2019 & 2032
- Table 2: Global US Sealants Industry Revenue Million Forecast, by End User Industry 2019 & 2032
- Table 3: Global US Sealants Industry Revenue Million Forecast, by Resin 2019 & 2032
- Table 4: Global US Sealants Industry Revenue Million Forecast, by Region 2019 & 2032
- Table 5: Global US Sealants Industry Revenue Million Forecast, by Country 2019 & 2032
- Table 6: Northeast US Sealants Industry Revenue (Million) Forecast, by Application 2019 & 2032
- Table 7: Southeast US Sealants Industry Revenue (Million) Forecast, by Application 2019 & 2032
- Table 8: Midwest US Sealants Industry Revenue (Million) Forecast, by Application 2019 & 2032
- Table 9: Southwest US Sealants Industry Revenue (Million) Forecast, by Application 2019 & 2032
- Table 10: West US Sealants Industry Revenue (Million) Forecast, by Application 2019 & 2032
- Table 11: Global US Sealants Industry Revenue Million Forecast, by End User Industry 2019 & 2032
- Table 12: Global US Sealants Industry Revenue Million Forecast, by Resin 2019 & 2032
- Table 13: Global US Sealants Industry Revenue Million Forecast, by Country 2019 & 2032
- Table 14: United States US Sealants Industry Revenue (Million) Forecast, by Application 2019 & 2032
- Table 15: Canada US Sealants Industry Revenue (Million) Forecast, by Application 2019 & 2032
- Table 16: Mexico US Sealants Industry Revenue (Million) Forecast, by Application 2019 & 2032
- Table 17: Global US Sealants Industry Revenue Million Forecast, by End User Industry 2019 & 2032
- Table 18: Global US Sealants Industry Revenue Million Forecast, by Resin 2019 & 2032
- Table 19: Global US Sealants Industry Revenue Million Forecast, by Country 2019 & 2032
- Table 20: Brazil US Sealants Industry Revenue (Million) Forecast, by Application 2019 & 2032
- Table 21: Argentina US Sealants Industry Revenue (Million) Forecast, by Application 2019 & 2032
- Table 22: Rest of South America US Sealants Industry Revenue (Million) Forecast, by Application 2019 & 2032
- Table 23: Global US Sealants Industry Revenue Million Forecast, by End User Industry 2019 & 2032
- Table 24: Global US Sealants Industry Revenue Million Forecast, by Resin 2019 & 2032
- Table 25: Global US Sealants Industry Revenue Million Forecast, by Country 2019 & 2032
- Table 26: United Kingdom US Sealants Industry Revenue (Million) Forecast, by Application 2019 & 2032
- Table 27: Germany US Sealants Industry Revenue (Million) Forecast, by Application 2019 & 2032
- Table 28: France US Sealants Industry Revenue (Million) Forecast, by Application 2019 & 2032
- Table 29: Italy US Sealants Industry Revenue (Million) Forecast, by Application 2019 & 2032
- Table 30: Spain US Sealants Industry Revenue (Million) Forecast, by Application 2019 & 2032
- Table 31: Russia US Sealants Industry Revenue (Million) Forecast, by Application 2019 & 2032
- Table 32: Benelux US Sealants Industry Revenue (Million) Forecast, by Application 2019 & 2032
- Table 33: Nordics US Sealants Industry Revenue (Million) Forecast, by Application 2019 & 2032
- Table 34: Rest of Europe US Sealants Industry Revenue (Million) Forecast, by Application 2019 & 2032
- Table 35: Global US Sealants Industry Revenue Million Forecast, by End User Industry 2019 & 2032
- Table 36: Global US Sealants Industry Revenue Million Forecast, by Resin 2019 & 2032
- Table 37: Global US Sealants Industry Revenue Million Forecast, by Country 2019 & 2032
- Table 38: Turkey US Sealants Industry Revenue (Million) Forecast, by Application 2019 & 2032
- Table 39: Israel US Sealants Industry Revenue (Million) Forecast, by Application 2019 & 2032
- Table 40: GCC US Sealants Industry Revenue (Million) Forecast, by Application 2019 & 2032
- Table 41: North Africa US Sealants Industry Revenue (Million) Forecast, by Application 2019 & 2032
- Table 42: South Africa US Sealants Industry Revenue (Million) Forecast, by Application 2019 & 2032
- Table 43: Rest of Middle East & Africa US Sealants Industry Revenue (Million) Forecast, by Application 2019 & 2032
- Table 44: Global US Sealants Industry Revenue Million Forecast, by End User Industry 2019 & 2032
- Table 45: Global US Sealants Industry Revenue Million Forecast, by Resin 2019 & 2032
- Table 46: Global US Sealants Industry Revenue Million Forecast, by Country 2019 & 2032
- Table 47: China US Sealants Industry Revenue (Million) Forecast, by Application 2019 & 2032
- Table 48: India US Sealants Industry Revenue (Million) Forecast, by Application 2019 & 2032
- Table 49: Japan US Sealants Industry Revenue (Million) Forecast, by Application 2019 & 2032
- Table 50: South Korea US Sealants Industry Revenue (Million) Forecast, by Application 2019 & 2032
- Table 51: ASEAN US Sealants Industry Revenue (Million) Forecast, by Application 2019 & 2032
- Table 52: Oceania US Sealants Industry Revenue (Million) Forecast, by Application 2019 & 2032
- Table 53: Rest of Asia Pacific US Sealants Industry Revenue (Million) Forecast, by Application 2019 & 2032
Frequently Asked Questions
1. What is the projected Compound Annual Growth Rate (CAGR) of the US Sealants Industry?
The projected CAGR is approximately > 5.30%.
2. Which companies are prominent players in the US Sealants Industry?
Key companies in the market include Henkel AG & Co KGaA, RPM International Inc, 3M, Illinois Tool Works Inc, Arkema Group, Dow, H B Fuller Company, Sika A, MAPEI S p A, Pecora Corporation.
3. What are the main segments of the US Sealants Industry?
The market segments include End User Industry, Resin.
4. Can you provide details about the market size?
The market size is estimated to be USD XX Million as of 2022.
5. What are some drivers contributing to market growth?
Rising Demand from the Construction Industry in Saudi Arabia; Other Drivers.
6. What are the notable trends driving market growth?
OTHER KEY INDUSTRY TRENDS COVERED IN THE REPORT.
7. Are there any restraints impacting market growth?
; Impact of COVID-19 Pandemic on Global Economy.
8. Can you provide examples of recent developments in the market?
July 2021: RPM International Inc. procured a 178,000-square-foot chemical manufacturing facility in Texas to act as a manufacturing campus, owned and operated by RPM’s Tremco Construction Products Group, to meet customer demand and strengthen its supply chain.April 2021: Sika AG signed an agreement to acquire The Yokohama Rubber Co. Ltd's adhesives division, Hamatite, based in Japan. Hamatite offers polyurethanes, hot melts, and modified silicones technology adhesives and sealants for the automotive and construction industries.January 2020: H.B. Fuller Company introduced a new range of Gorilla professional-grade adhesives and sealants for MRO industrial applications.
9. What pricing options are available for accessing the report?
Pricing options include single-user, multi-user, and enterprise licenses priced at USD 3800, USD 4500, and USD 5800 respectively.
10. Is the market size provided in terms of value or volume?
The market size is provided in terms of value, measured in Million.
11. Are there any specific market keywords associated with the report?
Yes, the market keyword associated with the report is "US Sealants Industry," which aids in identifying and referencing the specific market segment covered.
12. How do I determine which pricing option suits my needs best?
The pricing options vary based on user requirements and access needs. Individual users may opt for single-user licenses, while businesses requiring broader access may choose multi-user or enterprise licenses for cost-effective access to the report.
13. Are there any additional resources or data provided in the US Sealants Industry report?
While the report offers comprehensive insights, it's advisable to review the specific contents or supplementary materials provided to ascertain if additional resources or data are available.
14. How can I stay updated on further developments or reports in the US Sealants Industry?
To stay informed about further developments, trends, and reports in the US Sealants Industry, consider subscribing to industry newsletters, following relevant companies and organizations, or regularly checking reputable industry news sources and publications.
Methodology
Step 1 - Identification of Relevant Samples Size from Population Database


Step 2 - Approaches for Defining Global Market Size (Value, Volume* & Price*)

Note*: In applicable scenarios
Step 3 - Data Sources
Primary Research
- Web Analytics
- Survey Reports
- Research Institute
- Latest Research Reports
- Opinion Leaders
Secondary Research
- Annual Reports
- White Paper
- Latest Press Release
- Industry Association
- Paid Database
- Investor Presentations

Step 4 - Data Triangulation
Involves using different sources of information in order to increase the validity of a study
These sources are likely to be stakeholders in a program - participants, other researchers, program staff, other community members, and so on.
Then we put all data in single framework & apply various statistical tools to find out the dynamic on the market.
During the analysis stage, feedback from the stakeholder groups would be compared to determine areas of agreement as well as areas of divergence
