

Key Insights
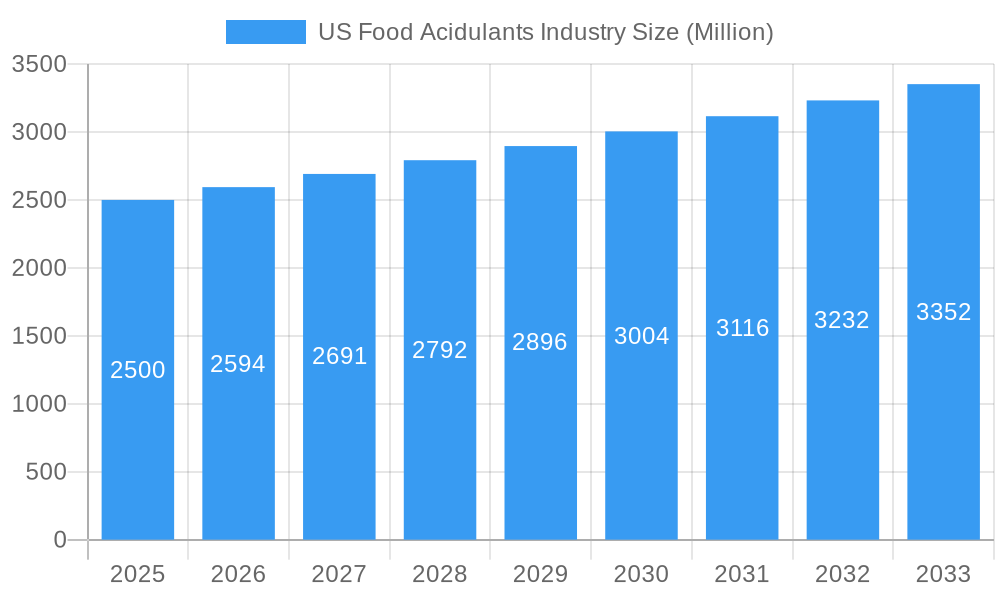
The US food acidulants market, valued at approximately $XX million in 2025, is projected to experience steady growth with a Compound Annual Growth Rate (CAGR) of 3.72% from 2025 to 2033. This growth is driven by several key factors. Increasing consumer demand for processed foods and beverages, particularly within the bakery, confectionery, and beverage sectors, fuels the need for acidulants to enhance flavor, extend shelf life, and control pH. Furthermore, the rising popularity of healthier food options is indirectly boosting the market as manufacturers seek natural and organic acidulants like citric and lactic acid to cater to health-conscious consumers. The diverse applications across various food categories, including dairy, meat & poultry, and others, contribute to the market's robustness. However, potential restraints include fluctuating raw material prices and concerns surrounding the potential negative health impacts of certain artificial acidulants, leading some manufacturers to explore more natural alternatives. Geographic segmentation reveals strong growth potential across all US regions, particularly in areas with significant food processing industries. Key players like Bartek Ingredients Inc, Cargill Incorporated, and Corbion NV are strategically investing in research and development, as well as exploring expansion opportunities to maintain their market share in this competitive landscape.
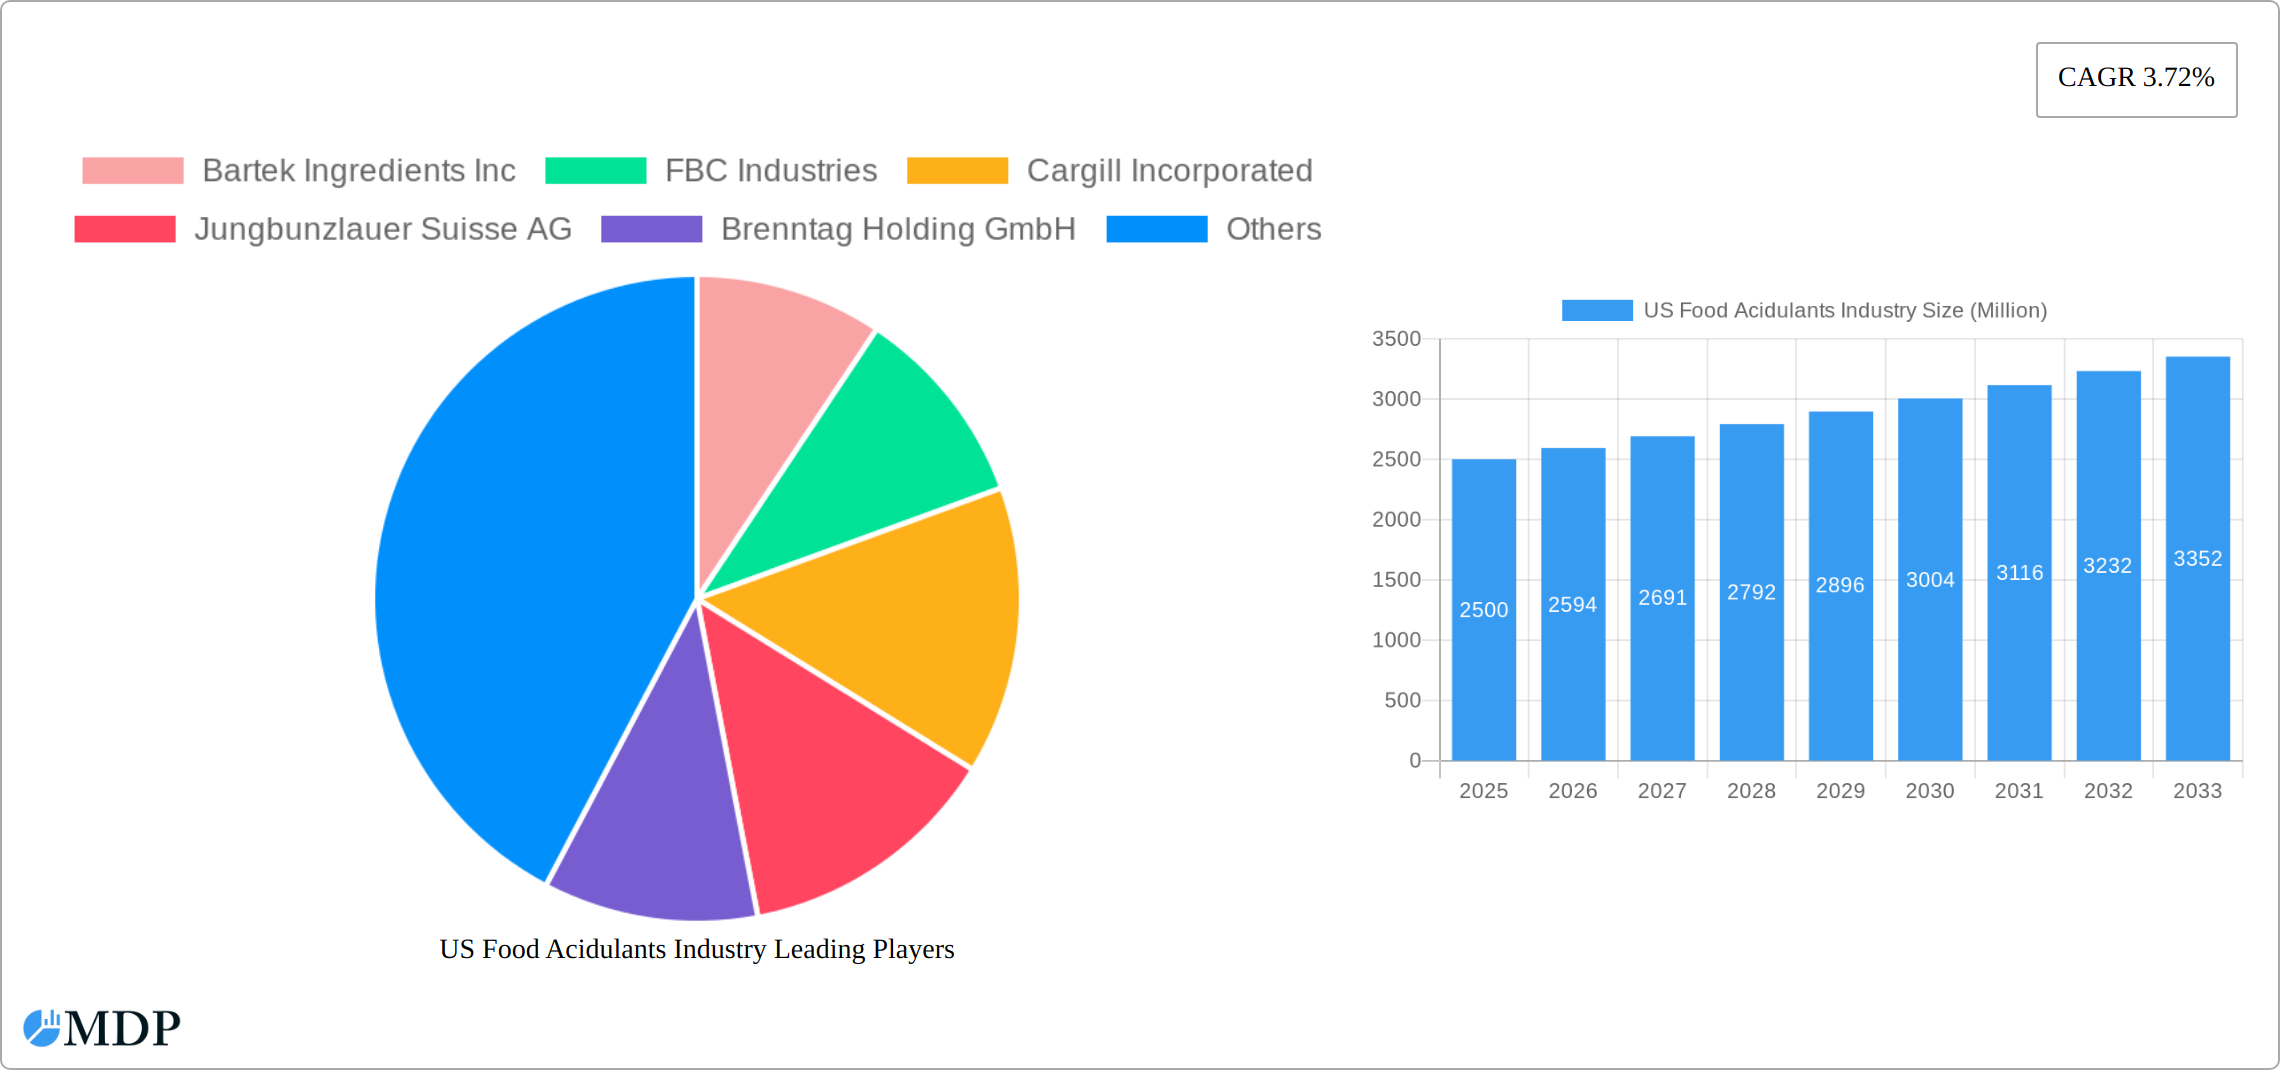
US Food Acidulants Industry Market Size (In Billion)
The market segmentation reveals that citric acid, lactic acid, and acetic acid dominate the product type segment, with a preference shifting towards natural and organic options. Within the application segment, the beverages sector leads due to the widespread use of acidulants in carbonated soft drinks, juices, and other beverages. The dairy and bakery industries also demonstrate substantial demand, driven by the use of acidulants in cheese making, yogurt production, and baking applications. The competitive landscape is characterized by established players and emerging companies, each vying to meet the growing demand while innovating in areas like sustainable sourcing and the development of novel acidulants. The forecast period shows a consistent growth trajectory reflecting the enduring significance of acidulants in the US food industry. The ongoing shift toward clean-label products and increasing consumer awareness of ingredients will likely shape future market dynamics.
US Food Acidulants Industry Company Market Share
US Food Acidulants Industry Market Report: 2019-2033
Uncover lucrative growth opportunities and strategic insights within the dynamic US Food Acidulants market. This comprehensive report provides a detailed analysis of the US Food Acidulants industry, encompassing market dynamics, leading players, segment performance, and future growth projections from 2019 to 2033. With a focus on key segments like Citric Acid, Lactic Acid, and Acetic Acid, and applications across Beverages, Dairy, Bakery, and more, this report is an invaluable resource for industry stakeholders, investors, and strategic planners.
US Food Acidulants Industry Market Dynamics & Concentration
The US food acidulants market, a multi-million dollar industry in 2025, exhibits a moderately consolidated structure. A handful of major players control a significant portion of the market, with the top five companies holding approximately 60% of the market share. Driving innovation are the increasing demands for clean-label ingredients, high-performing functional acidulants, and environmentally sustainable production methods. The industry's practices are heavily influenced by stringent regulatory frameworks, primarily the FDA's comprehensive guidelines on food additives. Competition from substitute products, especially naturally occurring acids, is notable, particularly within niche market segments. Consumer trends favoring healthier and more convenient food products are significantly shaping demand patterns. Mergers and acquisitions (M&A) activity has remained steady in recent years, with an average of 5-7 deals annually since 2019, predominantly focused on expanding product portfolios and achieving broader geographic reach. This consolidation and strategic growth are expected to further shape the market landscape in the coming years.
- Market Concentration: Highly concentrated, with the top 5 companies holding approximately 60% of the market share in 2025, indicating significant market power among key players.
- Innovation Drivers: The pursuit of clean-label certifications, development of functional acidulants offering enhanced performance, and adoption of sustainable production processes are key innovation drivers.
- Regulatory Landscape: Adherence to stringent FDA guidelines for food additives significantly impacts production processes, labeling requirements, and overall market dynamics.
- Substitute Products: Naturally-occurring acids represent a competitive challenge, particularly in specialized market segments where consumers prioritize natural ingredients.
- M&A Activity: Consistent M&A activity (5-7 deals annually since 2019) points to strategic growth strategies focused on expanding product lines and geographical presence.
US Food Acidulants Industry Industry Trends & Analysis
The US food acidulants market is projected to register a CAGR of XX% during the forecast period (2025-2033), driven by several factors. The increasing demand for processed foods and beverages is a key growth driver, fueling the consumption of acidulants as preservatives, flavor enhancers, and pH regulators. Technological advancements in fermentation and extraction processes are leading to more efficient and cost-effective production. Consumer preferences for healthier options and clean-label products are influencing the demand for natural and organically sourced acidulants. However, price volatility in raw materials and intense competition among established players pose challenges. Market penetration of natural acidulants is gradually increasing, currently estimated at approximately 30% in 2025, driven by consumer health consciousness and the growing appeal of clean-label ingredients.
Leading Markets & Segments in US Food Acidulants Industry
The Beverages sector commands a dominant position in the application landscape, accounting for approximately 40% of the total market value in 2025. Among the various types of food acidulants, Citric Acid holds the largest market share, driven by its remarkable versatility, cost-effectiveness, and widespread applicability across diverse food categories. This dominance reflects the significant role of citric acid in enhancing flavor, preserving freshness, and meeting diverse functional needs across the food industry.
- Dominant Application: The Beverages sector's 40% market share in 2025 is driven by the substantial demand for carbonated soft drinks, juices, and ready-to-drink beverages, all of which heavily utilize food acidulants.
- Dominant Type: Citric Acid's leading market share stems from its versatile functionalities, cost-efficiency, and widespread use as a preservative and flavor enhancer across a broad range of food products.
Key Drivers for Dominant Segments:
- Beverages: The continued growth in consumption of carbonated soft drinks, juices, and ready-to-drink beverages fuels the high demand for food acidulants in this sector.
- Citric Acid: The cost-effectiveness and diverse functional roles of citric acid as a preservative and flavor enhancer solidify its dominant position.
- Geographic Factors: The robust food processing industry concentrated in the Eastern and Southern US regions contributes significantly to the market's strength in these areas.
US Food Acidulants Industry Product Developments
Recent advancements in the food acidulants industry center on creating products with superior functionality, improved stability, and cleaner labels. Key innovations include the introduction of organically certified acidulants, the adoption of fermentation-based production methods for enhanced purity and functionality, and the development of customized blends to meet specific application requirements. These improvements are directly in response to the increasing consumer preference for natural and clean-label ingredients while simultaneously enhancing product shelf life and sensory appeal.
Key Drivers of US Food Acidulants Industry Growth
The growth trajectory of the US food acidulants industry is propelled by a confluence of factors. The worldwide surge in demand for processed foods and beverages serves as a primary driver. Simultaneously, technological breakthroughs in production processes are boosting efficiency and driving down costs. Government regulations that favor specific acidulants are also playing a shaping role in market dynamics. Furthermore, the evolution of consumer preferences towards healthier and more convenient food options is fueling demand for clean-label acidulants, leading to innovation and market diversification.
Challenges in the US Food Acidulants Industry Market
The industry faces challenges such as fluctuating raw material prices, intense competition among established players, and stringent regulatory compliance requirements. Supply chain disruptions can impact production and delivery, increasing operational costs. The increasing demand for natural and organic acidulants has also increased production costs. The market is sensitive to price fluctuations of essential raw materials.
Emerging Opportunities in US Food Acidulants Industry
Significant opportunities exist in the development and commercialization of novel acidulants with enhanced functionality and cleaner labels. Strategic partnerships and collaborations are crucial for expanding market reach and accessing new technologies. Moreover, exploring emerging markets and expanding product offerings to cater to diverse consumer needs will create new avenues for growth.
Leading Players in the US Food Acidulants Industry Sector
Key Milestones in US Food Acidulants Industry Industry
- 2020: Increased demand for clean-label acidulants.
- 2021: Several key players announced investments in sustainable production facilities.
- 2022: New regulations impacting labeling requirements for certain acidulants.
- 2023: Introduction of several novel acidulant blends optimized for specific applications.
- 2024: Increased M&A activity consolidating the market.
Strategic Outlook for US Food Acidulants Industry Market
The US food acidulants market presents substantial growth potential, fueled by a convergence of factors: the escalating demand for processed foods, technological advancements driving innovation, and the evolving preferences of health-conscious consumers. Strategic opportunities abound in the development and commercialization of novel, functional acidulants, expansion into emerging markets, and the forging of strategic partnerships to bolster market reach and competitiveness. Prioritizing sustainability and clean-label initiatives will be crucial in solidifying market positioning and attracting a growing base of environmentally and health-conscious consumers.
US Food Acidulants Industry Segmentation
-
1. Type
- 1.1. Citric Acid
- 1.2. Lactic Acid
- 1.3. Acetic Acid
- 1.4. Others
-
2. Application
- 2.1. Beverages
- 2.2. Dairy
- 2.3. Bakery
- 2.4. Meat & Poultry
- 2.5. Confectionery
- 2.6. Others
US Food Acidulants Industry Segmentation By Geography
-
1. North America
- 1.1. United States
- 1.2. Canada
- 1.3. Mexico
-
2. South America
- 2.1. Brazil
- 2.2. Argentina
- 2.3. Rest of South America
-
3. Europe
- 3.1. United Kingdom
- 3.2. Germany
- 3.3. France
- 3.4. Italy
- 3.5. Spain
- 3.6. Russia
- 3.7. Benelux
- 3.8. Nordics
- 3.9. Rest of Europe
-
4. Middle East & Africa
- 4.1. Turkey
- 4.2. Israel
- 4.3. GCC
- 4.4. North Africa
- 4.5. South Africa
- 4.6. Rest of Middle East & Africa
-
5. Asia Pacific
- 5.1. China
- 5.2. India
- 5.3. Japan
- 5.4. South Korea
- 5.5. ASEAN
- 5.6. Oceania
- 5.7. Rest of Asia Pacific
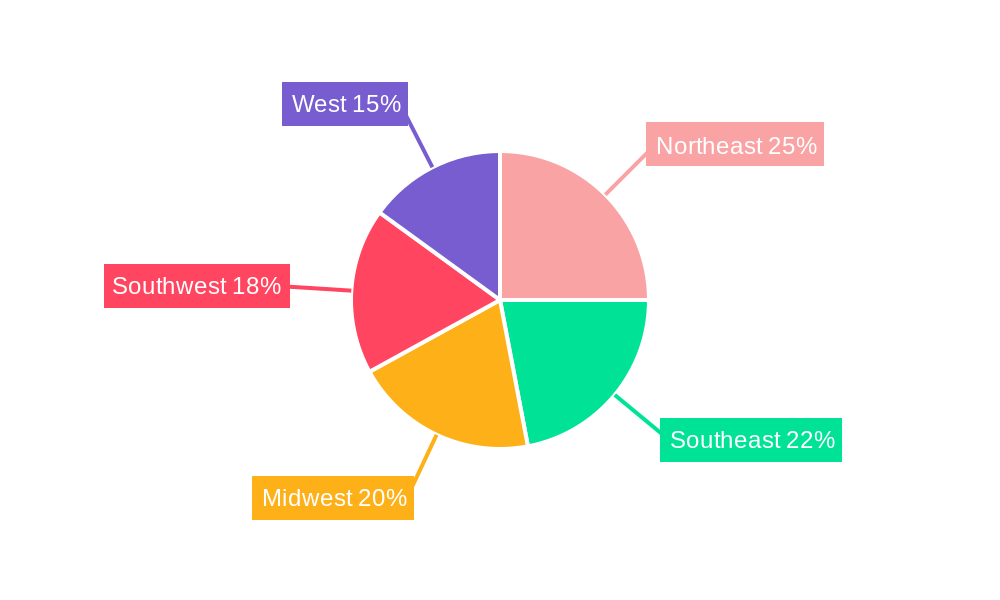
US Food Acidulants Industry Regional Market Share
Geographic Coverage of US Food Acidulants Industry
US Food Acidulants Industry REPORT HIGHLIGHTS
| Aspects | Details |
|---|---|
| Study Period | 2020-2034 |
| Base Year | 2025 |
| Estimated Year | 2026 |
| Forecast Period | 2026-2034 |
| Historical Period | 2020-2025 |
| Growth Rate | CAGR of 5.4% from 2020-2034 |
| Segmentation |
|
Table of Contents
- 1. Introduction
- 1.1. Research Scope
- 1.2. Market Segmentation
- 1.3. Research Methodology
- 1.4. Definitions and Assumptions
- 2. Executive Summary
- 2.1. Introduction
- 3. Market Dynamics
- 3.1. Introduction
- 3.2. Market Drivers
- 3.2.1. Increasing Demand for Low-Fat and Low-Calorie Food; Increasing Product Innovation
- 3.3. Market Restrains
- 3.3.1. ; Threat of New Entrants; Bargaining Power of Buyers/Consumers; Bargaining Power of Suppliers; Threat of Substitute Products; Degree Of Competition
- 3.4. Market Trends
- 3.4.1. Citric Acid holds the Largest Market
- 4. Market Factor Analysis
- 4.1. Porters Five Forces
- 4.2. Supply/Value Chain
- 4.3. PESTEL analysis
- 4.4. Market Entropy
- 4.5. Patent/Trademark Analysis
- 5. Global US Food Acidulants Industry Analysis, Insights and Forecast, 2020-2032
- 5.1. Market Analysis, Insights and Forecast - by Type
- 5.1.1. Citric Acid
- 5.1.2. Lactic Acid
- 5.1.3. Acetic Acid
- 5.1.4. Others
- 5.2. Market Analysis, Insights and Forecast - by Application
- 5.2.1. Beverages
- 5.2.2. Dairy
- 5.2.3. Bakery
- 5.2.4. Meat & Poultry
- 5.2.5. Confectionery
- 5.2.6. Others
- 5.3. Market Analysis, Insights and Forecast - by Region
- 5.3.1. North America
- 5.3.2. South America
- 5.3.3. Europe
- 5.3.4. Middle East & Africa
- 5.3.5. Asia Pacific
- 5.1. Market Analysis, Insights and Forecast - by Type
- 6. North America US Food Acidulants Industry Analysis, Insights and Forecast, 2020-2032
- 6.1. Market Analysis, Insights and Forecast - by Type
- 6.1.1. Citric Acid
- 6.1.2. Lactic Acid
- 6.1.3. Acetic Acid
- 6.1.4. Others
- 6.2. Market Analysis, Insights and Forecast - by Application
- 6.2.1. Beverages
- 6.2.2. Dairy
- 6.2.3. Bakery
- 6.2.4. Meat & Poultry
- 6.2.5. Confectionery
- 6.2.6. Others
- 6.1. Market Analysis, Insights and Forecast - by Type
- 7. South America US Food Acidulants Industry Analysis, Insights and Forecast, 2020-2032
- 7.1. Market Analysis, Insights and Forecast - by Type
- 7.1.1. Citric Acid
- 7.1.2. Lactic Acid
- 7.1.3. Acetic Acid
- 7.1.4. Others
- 7.2. Market Analysis, Insights and Forecast - by Application
- 7.2.1. Beverages
- 7.2.2. Dairy
- 7.2.3. Bakery
- 7.2.4. Meat & Poultry
- 7.2.5. Confectionery
- 7.2.6. Others
- 7.1. Market Analysis, Insights and Forecast - by Type
- 8. Europe US Food Acidulants Industry Analysis, Insights and Forecast, 2020-2032
- 8.1. Market Analysis, Insights and Forecast - by Type
- 8.1.1. Citric Acid
- 8.1.2. Lactic Acid
- 8.1.3. Acetic Acid
- 8.1.4. Others
- 8.2. Market Analysis, Insights and Forecast - by Application
- 8.2.1. Beverages
- 8.2.2. Dairy
- 8.2.3. Bakery
- 8.2.4. Meat & Poultry
- 8.2.5. Confectionery
- 8.2.6. Others
- 8.1. Market Analysis, Insights and Forecast - by Type
- 9. Middle East & Africa US Food Acidulants Industry Analysis, Insights and Forecast, 2020-2032
- 9.1. Market Analysis, Insights and Forecast - by Type
- 9.1.1. Citric Acid
- 9.1.2. Lactic Acid
- 9.1.3. Acetic Acid
- 9.1.4. Others
- 9.2. Market Analysis, Insights and Forecast - by Application
- 9.2.1. Beverages
- 9.2.2. Dairy
- 9.2.3. Bakery
- 9.2.4. Meat & Poultry
- 9.2.5. Confectionery
- 9.2.6. Others
- 9.1. Market Analysis, Insights and Forecast - by Type
- 10. Asia Pacific US Food Acidulants Industry Analysis, Insights and Forecast, 2020-2032
- 10.1. Market Analysis, Insights and Forecast - by Type
- 10.1.1. Citric Acid
- 10.1.2. Lactic Acid
- 10.1.3. Acetic Acid
- 10.1.4. Others
- 10.2. Market Analysis, Insights and Forecast - by Application
- 10.2.1. Beverages
- 10.2.2. Dairy
- 10.2.3. Bakery
- 10.2.4. Meat & Poultry
- 10.2.5. Confectionery
- 10.2.6. Others
- 10.1. Market Analysis, Insights and Forecast - by Type
- 11. Competitive Analysis
- 11.1. Global Market Share Analysis 2025
- 11.2. Company Profiles
- 11.2.1 Bartek Ingredients Inc
- 11.2.1.1. Overview
- 11.2.1.2. Products
- 11.2.1.3. SWOT Analysis
- 11.2.1.4. Recent Developments
- 11.2.1.5. Financials (Based on Availability)
- 11.2.2 FBC Industries
- 11.2.2.1. Overview
- 11.2.2.2. Products
- 11.2.2.3. SWOT Analysis
- 11.2.2.4. Recent Developments
- 11.2.2.5. Financials (Based on Availability)
- 11.2.3 Cargill Incorporated
- 11.2.3.1. Overview
- 11.2.3.2. Products
- 11.2.3.3. SWOT Analysis
- 11.2.3.4. Recent Developments
- 11.2.3.5. Financials (Based on Availability)
- 11.2.4 Jungbunzlauer Suisse AG
- 11.2.4.1. Overview
- 11.2.4.2. Products
- 11.2.4.3. SWOT Analysis
- 11.2.4.4. Recent Developments
- 11.2.4.5. Financials (Based on Availability)
- 11.2.5 Brenntag Holding GmbH
- 11.2.5.1. Overview
- 11.2.5.2. Products
- 11.2.5.3. SWOT Analysis
- 11.2.5.4. Recent Developments
- 11.2.5.5. Financials (Based on Availability)
- 11.2.6 Tate & Lyle PLC
- 11.2.6.1. Overview
- 11.2.6.2. Products
- 11.2.6.3. SWOT Analysis
- 11.2.6.4. Recent Developments
- 11.2.6.5. Financials (Based on Availability)
- 11.2.7 Corbion NV
- 11.2.7.1. Overview
- 11.2.7.2. Products
- 11.2.7.3. SWOT Analysis
- 11.2.7.4. Recent Developments
- 11.2.7.5. Financials (Based on Availability)
- 11.2.8 Archer Daniels Midland Company*List Not Exhaustive
- 11.2.8.1. Overview
- 11.2.8.2. Products
- 11.2.8.3. SWOT Analysis
- 11.2.8.4. Recent Developments
- 11.2.8.5. Financials (Based on Availability)
- 11.2.1 Bartek Ingredients Inc
List of Figures
- Figure 1: Global US Food Acidulants Industry Revenue Breakdown (undefined, %) by Region 2025 & 2033
- Figure 2: North America US Food Acidulants Industry Revenue (undefined), by Type 2025 & 2033
- Figure 3: North America US Food Acidulants Industry Revenue Share (%), by Type 2025 & 2033
- Figure 4: North America US Food Acidulants Industry Revenue (undefined), by Application 2025 & 2033
- Figure 5: North America US Food Acidulants Industry Revenue Share (%), by Application 2025 & 2033
- Figure 6: North America US Food Acidulants Industry Revenue (undefined), by Country 2025 & 2033
- Figure 7: North America US Food Acidulants Industry Revenue Share (%), by Country 2025 & 2033
- Figure 8: South America US Food Acidulants Industry Revenue (undefined), by Type 2025 & 2033
- Figure 9: South America US Food Acidulants Industry Revenue Share (%), by Type 2025 & 2033
- Figure 10: South America US Food Acidulants Industry Revenue (undefined), by Application 2025 & 2033
- Figure 11: South America US Food Acidulants Industry Revenue Share (%), by Application 2025 & 2033
- Figure 12: South America US Food Acidulants Industry Revenue (undefined), by Country 2025 & 2033
- Figure 13: South America US Food Acidulants Industry Revenue Share (%), by Country 2025 & 2033
- Figure 14: Europe US Food Acidulants Industry Revenue (undefined), by Type 2025 & 2033
- Figure 15: Europe US Food Acidulants Industry Revenue Share (%), by Type 2025 & 2033
- Figure 16: Europe US Food Acidulants Industry Revenue (undefined), by Application 2025 & 2033
- Figure 17: Europe US Food Acidulants Industry Revenue Share (%), by Application 2025 & 2033
- Figure 18: Europe US Food Acidulants Industry Revenue (undefined), by Country 2025 & 2033
- Figure 19: Europe US Food Acidulants Industry Revenue Share (%), by Country 2025 & 2033
- Figure 20: Middle East & Africa US Food Acidulants Industry Revenue (undefined), by Type 2025 & 2033
- Figure 21: Middle East & Africa US Food Acidulants Industry Revenue Share (%), by Type 2025 & 2033
- Figure 22: Middle East & Africa US Food Acidulants Industry Revenue (undefined), by Application 2025 & 2033
- Figure 23: Middle East & Africa US Food Acidulants Industry Revenue Share (%), by Application 2025 & 2033
- Figure 24: Middle East & Africa US Food Acidulants Industry Revenue (undefined), by Country 2025 & 2033
- Figure 25: Middle East & Africa US Food Acidulants Industry Revenue Share (%), by Country 2025 & 2033
- Figure 26: Asia Pacific US Food Acidulants Industry Revenue (undefined), by Type 2025 & 2033
- Figure 27: Asia Pacific US Food Acidulants Industry Revenue Share (%), by Type 2025 & 2033
- Figure 28: Asia Pacific US Food Acidulants Industry Revenue (undefined), by Application 2025 & 2033
- Figure 29: Asia Pacific US Food Acidulants Industry Revenue Share (%), by Application 2025 & 2033
- Figure 30: Asia Pacific US Food Acidulants Industry Revenue (undefined), by Country 2025 & 2033
- Figure 31: Asia Pacific US Food Acidulants Industry Revenue Share (%), by Country 2025 & 2033
List of Tables
- Table 1: Global US Food Acidulants Industry Revenue undefined Forecast, by Type 2020 & 2033
- Table 2: Global US Food Acidulants Industry Revenue undefined Forecast, by Application 2020 & 2033
- Table 3: Global US Food Acidulants Industry Revenue undefined Forecast, by Region 2020 & 2033
- Table 4: Global US Food Acidulants Industry Revenue undefined Forecast, by Type 2020 & 2033
- Table 5: Global US Food Acidulants Industry Revenue undefined Forecast, by Application 2020 & 2033
- Table 6: Global US Food Acidulants Industry Revenue undefined Forecast, by Country 2020 & 2033
- Table 7: United States US Food Acidulants Industry Revenue (undefined) Forecast, by Application 2020 & 2033
- Table 8: Canada US Food Acidulants Industry Revenue (undefined) Forecast, by Application 2020 & 2033
- Table 9: Mexico US Food Acidulants Industry Revenue (undefined) Forecast, by Application 2020 & 2033
- Table 10: Global US Food Acidulants Industry Revenue undefined Forecast, by Type 2020 & 2033
- Table 11: Global US Food Acidulants Industry Revenue undefined Forecast, by Application 2020 & 2033
- Table 12: Global US Food Acidulants Industry Revenue undefined Forecast, by Country 2020 & 2033
- Table 13: Brazil US Food Acidulants Industry Revenue (undefined) Forecast, by Application 2020 & 2033
- Table 14: Argentina US Food Acidulants Industry Revenue (undefined) Forecast, by Application 2020 & 2033
- Table 15: Rest of South America US Food Acidulants Industry Revenue (undefined) Forecast, by Application 2020 & 2033
- Table 16: Global US Food Acidulants Industry Revenue undefined Forecast, by Type 2020 & 2033
- Table 17: Global US Food Acidulants Industry Revenue undefined Forecast, by Application 2020 & 2033
- Table 18: Global US Food Acidulants Industry Revenue undefined Forecast, by Country 2020 & 2033
- Table 19: United Kingdom US Food Acidulants Industry Revenue (undefined) Forecast, by Application 2020 & 2033
- Table 20: Germany US Food Acidulants Industry Revenue (undefined) Forecast, by Application 2020 & 2033
- Table 21: France US Food Acidulants Industry Revenue (undefined) Forecast, by Application 2020 & 2033
- Table 22: Italy US Food Acidulants Industry Revenue (undefined) Forecast, by Application 2020 & 2033
- Table 23: Spain US Food Acidulants Industry Revenue (undefined) Forecast, by Application 2020 & 2033
- Table 24: Russia US Food Acidulants Industry Revenue (undefined) Forecast, by Application 2020 & 2033
- Table 25: Benelux US Food Acidulants Industry Revenue (undefined) Forecast, by Application 2020 & 2033
- Table 26: Nordics US Food Acidulants Industry Revenue (undefined) Forecast, by Application 2020 & 2033
- Table 27: Rest of Europe US Food Acidulants Industry Revenue (undefined) Forecast, by Application 2020 & 2033
- Table 28: Global US Food Acidulants Industry Revenue undefined Forecast, by Type 2020 & 2033
- Table 29: Global US Food Acidulants Industry Revenue undefined Forecast, by Application 2020 & 2033
- Table 30: Global US Food Acidulants Industry Revenue undefined Forecast, by Country 2020 & 2033
- Table 31: Turkey US Food Acidulants Industry Revenue (undefined) Forecast, by Application 2020 & 2033
- Table 32: Israel US Food Acidulants Industry Revenue (undefined) Forecast, by Application 2020 & 2033
- Table 33: GCC US Food Acidulants Industry Revenue (undefined) Forecast, by Application 2020 & 2033
- Table 34: North Africa US Food Acidulants Industry Revenue (undefined) Forecast, by Application 2020 & 2033
- Table 35: South Africa US Food Acidulants Industry Revenue (undefined) Forecast, by Application 2020 & 2033
- Table 36: Rest of Middle East & Africa US Food Acidulants Industry Revenue (undefined) Forecast, by Application 2020 & 2033
- Table 37: Global US Food Acidulants Industry Revenue undefined Forecast, by Type 2020 & 2033
- Table 38: Global US Food Acidulants Industry Revenue undefined Forecast, by Application 2020 & 2033
- Table 39: Global US Food Acidulants Industry Revenue undefined Forecast, by Country 2020 & 2033
- Table 40: China US Food Acidulants Industry Revenue (undefined) Forecast, by Application 2020 & 2033
- Table 41: India US Food Acidulants Industry Revenue (undefined) Forecast, by Application 2020 & 2033
- Table 42: Japan US Food Acidulants Industry Revenue (undefined) Forecast, by Application 2020 & 2033
- Table 43: South Korea US Food Acidulants Industry Revenue (undefined) Forecast, by Application 2020 & 2033
- Table 44: ASEAN US Food Acidulants Industry Revenue (undefined) Forecast, by Application 2020 & 2033
- Table 45: Oceania US Food Acidulants Industry Revenue (undefined) Forecast, by Application 2020 & 2033
- Table 46: Rest of Asia Pacific US Food Acidulants Industry Revenue (undefined) Forecast, by Application 2020 & 2033
Frequently Asked Questions
1. What is the projected Compound Annual Growth Rate (CAGR) of the US Food Acidulants Industry?
The projected CAGR is approximately 5.4%.
2. Which companies are prominent players in the US Food Acidulants Industry?
Key companies in the market include Bartek Ingredients Inc, FBC Industries, Cargill Incorporated, Jungbunzlauer Suisse AG, Brenntag Holding GmbH, Tate & Lyle PLC, Corbion NV, Archer Daniels Midland Company*List Not Exhaustive.
3. What are the main segments of the US Food Acidulants Industry?
The market segments include Type, Application.
4. Can you provide details about the market size?
The market size is estimated to be USD XXX N/A as of 2022.
5. What are some drivers contributing to market growth?
Increasing Demand for Low-Fat and Low-Calorie Food; Increasing Product Innovation.
6. What are the notable trends driving market growth?
Citric Acid holds the Largest Market.
7. Are there any restraints impacting market growth?
; Threat of New Entrants; Bargaining Power of Buyers/Consumers; Bargaining Power of Suppliers; Threat of Substitute Products; Degree Of Competition.
8. Can you provide examples of recent developments in the market?
N/A
9. What pricing options are available for accessing the report?
Pricing options include single-user, multi-user, and enterprise licenses priced at USD 3800, USD 4500, and USD 5800 respectively.
10. Is the market size provided in terms of value or volume?
The market size is provided in terms of value, measured in N/A.
11. Are there any specific market keywords associated with the report?
Yes, the market keyword associated with the report is "US Food Acidulants Industry," which aids in identifying and referencing the specific market segment covered.
12. How do I determine which pricing option suits my needs best?
The pricing options vary based on user requirements and access needs. Individual users may opt for single-user licenses, while businesses requiring broader access may choose multi-user or enterprise licenses for cost-effective access to the report.
13. Are there any additional resources or data provided in the US Food Acidulants Industry report?
While the report offers comprehensive insights, it's advisable to review the specific contents or supplementary materials provided to ascertain if additional resources or data are available.
14. How can I stay updated on further developments or reports in the US Food Acidulants Industry?
To stay informed about further developments, trends, and reports in the US Food Acidulants Industry, consider subscribing to industry newsletters, following relevant companies and organizations, or regularly checking reputable industry news sources and publications.
Methodology
Step 1 - Identification of Relevant Samples Size from Population Database


Step 2 - Approaches for Defining Global Market Size (Value, Volume* & Price*)

Note*: In applicable scenarios
Step 3 - Data Sources
Primary Research
- Web Analytics
- Survey Reports
- Research Institute
- Latest Research Reports
- Opinion Leaders
Secondary Research
- Annual Reports
- White Paper
- Latest Press Release
- Industry Association
- Paid Database
- Investor Presentations

Step 4 - Data Triangulation
Involves using different sources of information in order to increase the validity of a study
These sources are likely to be stakeholders in a program - participants, other researchers, program staff, other community members, and so on.
Then we put all data in single framework & apply various statistical tools to find out the dynamic on the market.
During the analysis stage, feedback from the stakeholder groups would be compared to determine areas of agreement as well as areas of divergence