

Key Insights
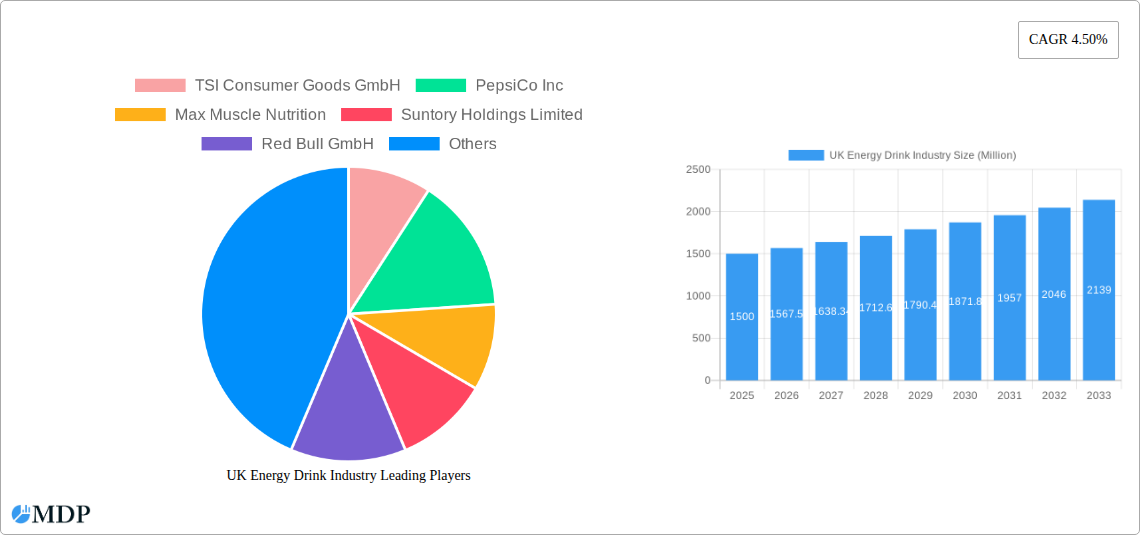
The UK energy drink market, valued at approximately £1.5 billion in 2025, exhibits robust growth potential, projected to expand at a compound annual growth rate (CAGR) of 4.5% from 2025 to 2033. This growth is fueled by several key drivers. Increasing consumer awareness of functional beverages and the rising popularity of active lifestyles contribute significantly to market expansion. The diverse range of product offerings, encompassing energy drinks, shots, and mixers, caters to a broad spectrum of consumer preferences. Furthermore, the strategic expansion of distribution channels, including supermarkets, convenience stores, specialized retailers, and online platforms, enhances market accessibility and drives sales. However, growing concerns regarding the high sugar and caffeine content of energy drinks, coupled with increasing health consciousness among consumers, pose a significant restraint on market growth. The market is segmented by packaging type (cans and PET bottles), product type (drinks, shots, and mixers), and distribution channels, reflecting diverse consumer preferences and purchasing behaviors. Key players like PepsiCo, Red Bull, Coca-Cola, and Monster Energy dominate the market, engaging in intense competition through product innovation, strategic partnerships, and effective marketing campaigns. The competitive landscape is dynamic, characterized by ongoing innovation in flavors, ingredients, and packaging to cater to evolving consumer demands.
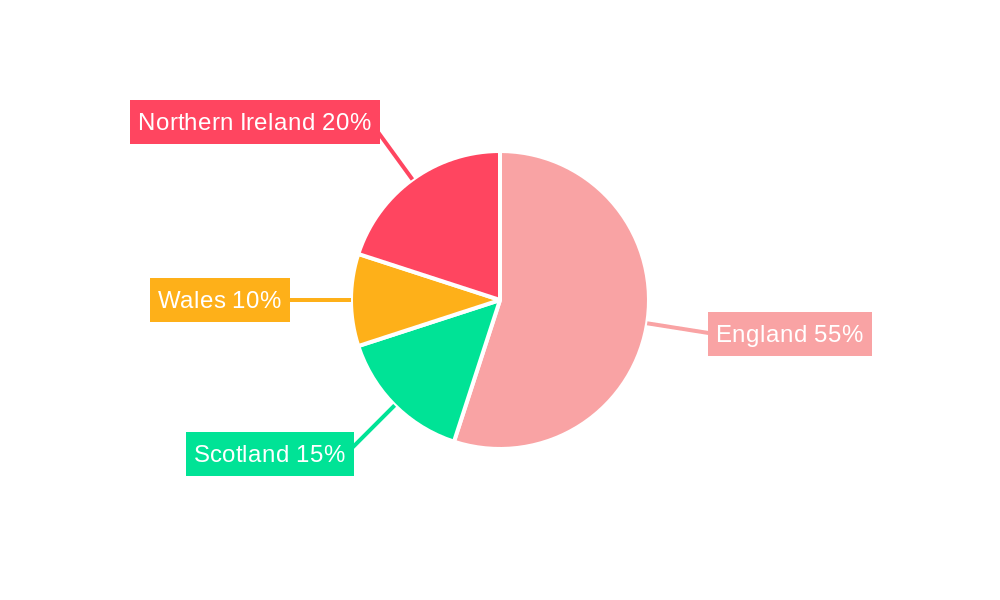
The market's regional performance across England, Wales, Scotland, and Northern Ireland shows variations in consumption patterns influenced by demographic factors and regional preferences. The projected growth trajectory suggests substantial opportunities for established players and new entrants alike. However, successful navigation of the market requires a keen understanding of consumer health concerns and the need for product diversification to cater to evolving preferences. The focus on healthier alternatives, such as low-sugar or natural energy drinks, will be crucial for sustained growth in this segment. Strategic investments in marketing and distribution channels will be key to maximizing market share in this competitive landscape. The increasing popularity of functional beverages, coupled with ongoing innovations in product formulations and packaging, positions the UK energy drink market for continued expansion, albeit with a focus on addressing health-related concerns.
UK Energy Drink Industry: Market Report 2019-2033
This comprehensive report provides a detailed analysis of the UK energy drink industry, offering invaluable insights for stakeholders, investors, and businesses operating within this dynamic sector. Covering the period 2019-2033, with a focus on 2025, this report unveils market trends, competitive landscapes, and future growth opportunities within the £xx Million market.
Keywords: UK Energy Drink Market, Energy Drink Industry, UK Energy Drinks, Energy Drink Trends, Energy Drink Market Size, Energy Drink Consumption, Energy Drink Companies UK, Energy Drink Sales, UK Beverage Market, Market Analysis, Market Report, Market Forecast, Market Research
UK Energy Drink Industry Market Dynamics & Concentration
The UK energy drink market, valued at £xx Million in 2025, exhibits a moderately concentrated structure. Key players like Red Bull GmbH, The Coca-Cola Company, and Monster Energy Company hold significant market share, while smaller, specialized brands are carving out niches with innovative product offerings. The market is characterized by intense competition, fueled by continuous innovation in product formulation, packaging, and marketing strategies.
- Market Concentration: The top 5 players account for approximately xx% of the market share in 2025.
- Innovation Drivers: Health-conscious formulations (low/zero sugar, natural ingredients), functional benefits (enhanced performance, cognitive enhancement), and sustainable packaging are driving innovation.
- Regulatory Framework: The UK's regulatory environment concerning sugar content, labeling, and marketing of energy drinks impacts industry practices and product development.
- Product Substitutes: Other beverages like sports drinks, coffee, tea, and functional waters compete for consumer attention.
- End-User Trends: Growing health awareness and demand for natural and functional beverages are shaping consumer preferences.
- M&A Activities: The number of M&A deals in the UK energy drink sector has averaged xx per year during the historical period (2019-2024), indicating consolidation and expansion strategies by major players.
UK Energy Drink Industry Industry Trends & Analysis
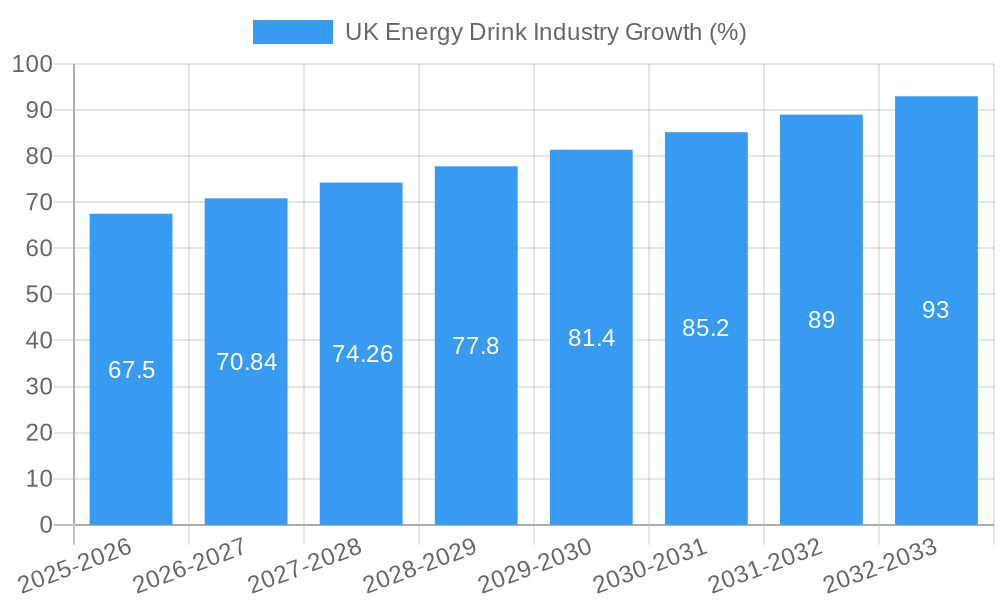
The UK energy drink market is experiencing robust growth, driven by factors like increasing disposable incomes, changing lifestyles, and evolving consumer preferences. The Compound Annual Growth Rate (CAGR) during the forecast period (2025-2033) is estimated at xx%, reflecting the market's dynamic nature. Technological disruptions, such as the rise of e-commerce and personalized marketing campaigns, have significantly influenced market penetration. Consumer preferences are shifting towards healthier, functional options, with a growing focus on natural ingredients, low sugar content, and sustainable packaging. This shift is impacting the competitive landscape, as brands adapt their offerings to cater to these evolving needs. Market penetration of energy drinks among young adults and health-conscious consumers is steadily increasing.
Leading Markets & Segments in UK Energy Drink Industry
The UK energy drink market displays varied segment performance across packaging types, product types, and distribution channels.
- By Packaging Type: Cans dominate the market, representing approximately xx% of total sales in 2025, followed by PET bottles at xx%.
- Key Drivers (Cans): Established consumer preference, cost-effectiveness, and ease of portability.
- Key Drivers (PET Bottles): Growing preference for larger sizes, better suited for certain product types.
- By Product Type: Energy drinks are the most prominent segment, constituting approximately xx% of the market, followed by shots and mixers, holding xx% and xx%, respectively. Growth in shots and mixers is fuelled by convenience and portability.
- By Distribution Channel: Supermarkets/Hypermarkets remain the dominant distribution channel, controlling xx% of sales, followed by convenience stores at xx%, while online retail stores are exhibiting rapid growth, reflecting the shift in consumer behaviour.
UK Energy Drink Industry Product Developments
Recent years have witnessed a surge in innovative energy drink products catering to growing health consciousness. Brands are incorporating natural ingredients, reducing sugar content, and offering functional benefits beyond a simple energy boost. This shift aligns with current consumer trends and aims to mitigate health concerns associated with traditional high-sugar energy drinks. The emergence of plant-based and clean energy options highlights the evolving landscape of the market.
Key Drivers of UK Energy Drink Industry Growth
Several factors underpin the growth of the UK energy drink market:
- Changing Lifestyles: Busy schedules and demanding lifestyles drive demand for convenient energy boosts.
- Rising Disposable Incomes: Increased purchasing power allows consumers to indulge in premium beverages.
- Health and Wellness Trend: Growth in healthier options such as low-sugar, natural, and functional drinks.
Challenges in the UK Energy Drink Industry Market
The UK energy drink market faces challenges including:
- Health Concerns: Negative perceptions surrounding sugar content and potential health risks.
- Intense Competition: A highly competitive market with established brands and emerging players.
- Regulatory Scrutiny: Growing regulatory pressure to reduce sugar content and improve labeling.
Emerging Opportunities in UK Energy Drink Industry
The UK energy drink sector offers significant long-term growth potential through:
- Premiumization: Growing demand for premium, functional, and health-conscious drinks.
- Strategic Partnerships: Collaborations with fitness and wellness brands can broaden market reach.
- Product Diversification: Expansion into new product segments like plant-based or functional energy shots.
Leading Players in the UK Energy Drink Industry Sector
- TSI Consumer Goods GmbH
- PepsiCo Inc
- Max Muscle Nutrition
- Suntory Holdings Limited
- Red Bull GmbH
- The Coca-Cola Company
- Nestle SA
- Global Trade Holdings Co Ltd
- Monster Energy Company
- GlaxoSmithKline PLC
Key Milestones in UK Energy Drink Industry Industry
- September 2022: Virtue Clean Energy launches zero-sugar, all-natural energy drink. This signifies the growing consumer demand for healthier energy drink alternatives.
- June 2022: Tenzing launches plant-based energy shots, catering to the growing plant-based consumer segment. This indicates an increased focus on plant-derived ingredients and convenience.
- March 2022: PerfectTed launches a range of matcha-powered canned energy drinks, highlighting the increasing use of natural and functional ingredients. This represents another move toward healthier energy options, further driving market growth.
Strategic Outlook for UK Energy Drink Industry Market
The UK energy drink market is poised for continued growth, driven by innovation, evolving consumer preferences, and the increasing popularity of functional beverages. Opportunities for sustained expansion lie in developing healthier, more sustainable, and personalized energy drink options, along with strategic partnerships to broaden market reach and enhance brand awareness. Focusing on the growing demand for plant-based and clean energy options will be key for future success.
UK Energy Drink Industry Segmentation
-
1. Packaging Type
- 1.1. Can
- 1.2. PET Bottle
-
2. Product Type
- 2.1. Drinks
- 2.2. Shots
- 2.3. Mixers
-
3. Distribution Channel
- 3.1. Supermarkets/Hypermarkets
- 3.2. Convenience Stores
- 3.3. Specalist Stores
- 3.4. Online Retail Stores
- 3.5. Other Distribution Channels
UK Energy Drink Industry Segmentation By Geography
-
1. North America
- 1.1. United States
- 1.2. Canada
- 1.3. Mexico
-
2. South America
- 2.1. Brazil
- 2.2. Argentina
- 2.3. Rest of South America
-
3. Europe
- 3.1. United Kingdom
- 3.2. Germany
- 3.3. France
- 3.4. Italy
- 3.5. Spain
- 3.6. Russia
- 3.7. Benelux
- 3.8. Nordics
- 3.9. Rest of Europe
-
4. Middle East & Africa
- 4.1. Turkey
- 4.2. Israel
- 4.3. GCC
- 4.4. North Africa
- 4.5. South Africa
- 4.6. Rest of Middle East & Africa
-
5. Asia Pacific
- 5.1. China
- 5.2. India
- 5.3. Japan
- 5.4. South Korea
- 5.5. ASEAN
- 5.6. Oceania
- 5.7. Rest of Asia Pacific
UK Energy Drink Industry REPORT HIGHLIGHTS
| Aspects | Details |
|---|---|
| Study Period | 2019-2033 |
| Base Year | 2024 |
| Estimated Year | 2025 |
| Forecast Period | 2025-2033 |
| Historical Period | 2019-2024 |
| Growth Rate | CAGR of 4.50% from 2019-2033 |
| Segmentation |
|
Table of Contents
- 1. Introduction
- 1.1. Research Scope
- 1.2. Market Segmentation
- 1.3. Research Methodology
- 1.4. Definitions and Assumptions
- 2. Executive Summary
- 2.1. Introduction
- 3. Market Dynamics
- 3.1. Introduction
- 3.2. Market Drivers
- 3.2.1. Rising Health & Wellness Trends; Strategic Initiatives By Key Players
- 3.3. Market Restrains
- 3.3.1. Cost Considerations Coupled With Availability Of Alternatives
- 3.4. Market Trends
- 3.4.1. The Drinks Segment Dominates the Energy Drink Market
- 4. Market Factor Analysis
- 4.1. Porters Five Forces
- 4.2. Supply/Value Chain
- 4.3. PESTEL analysis
- 4.4. Market Entropy
- 4.5. Patent/Trademark Analysis
- 5. Global UK Energy Drink Industry Analysis, Insights and Forecast, 2019-2031
- 5.1. Market Analysis, Insights and Forecast - by Packaging Type
- 5.1.1. Can
- 5.1.2. PET Bottle
- 5.2. Market Analysis, Insights and Forecast - by Product Type
- 5.2.1. Drinks
- 5.2.2. Shots
- 5.2.3. Mixers
- 5.3. Market Analysis, Insights and Forecast - by Distribution Channel
- 5.3.1. Supermarkets/Hypermarkets
- 5.3.2. Convenience Stores
- 5.3.3. Specalist Stores
- 5.3.4. Online Retail Stores
- 5.3.5. Other Distribution Channels
- 5.4. Market Analysis, Insights and Forecast - by Region
- 5.4.1. North America
- 5.4.2. South America
- 5.4.3. Europe
- 5.4.4. Middle East & Africa
- 5.4.5. Asia Pacific
- 5.1. Market Analysis, Insights and Forecast - by Packaging Type
- 6. North America UK Energy Drink Industry Analysis, Insights and Forecast, 2019-2031
- 6.1. Market Analysis, Insights and Forecast - by Packaging Type
- 6.1.1. Can
- 6.1.2. PET Bottle
- 6.2. Market Analysis, Insights and Forecast - by Product Type
- 6.2.1. Drinks
- 6.2.2. Shots
- 6.2.3. Mixers
- 6.3. Market Analysis, Insights and Forecast - by Distribution Channel
- 6.3.1. Supermarkets/Hypermarkets
- 6.3.2. Convenience Stores
- 6.3.3. Specalist Stores
- 6.3.4. Online Retail Stores
- 6.3.5. Other Distribution Channels
- 6.1. Market Analysis, Insights and Forecast - by Packaging Type
- 7. South America UK Energy Drink Industry Analysis, Insights and Forecast, 2019-2031
- 7.1. Market Analysis, Insights and Forecast - by Packaging Type
- 7.1.1. Can
- 7.1.2. PET Bottle
- 7.2. Market Analysis, Insights and Forecast - by Product Type
- 7.2.1. Drinks
- 7.2.2. Shots
- 7.2.3. Mixers
- 7.3. Market Analysis, Insights and Forecast - by Distribution Channel
- 7.3.1. Supermarkets/Hypermarkets
- 7.3.2. Convenience Stores
- 7.3.3. Specalist Stores
- 7.3.4. Online Retail Stores
- 7.3.5. Other Distribution Channels
- 7.1. Market Analysis, Insights and Forecast - by Packaging Type
- 8. Europe UK Energy Drink Industry Analysis, Insights and Forecast, 2019-2031
- 8.1. Market Analysis, Insights and Forecast - by Packaging Type
- 8.1.1. Can
- 8.1.2. PET Bottle
- 8.2. Market Analysis, Insights and Forecast - by Product Type
- 8.2.1. Drinks
- 8.2.2. Shots
- 8.2.3. Mixers
- 8.3. Market Analysis, Insights and Forecast - by Distribution Channel
- 8.3.1. Supermarkets/Hypermarkets
- 8.3.2. Convenience Stores
- 8.3.3. Specalist Stores
- 8.3.4. Online Retail Stores
- 8.3.5. Other Distribution Channels
- 8.1. Market Analysis, Insights and Forecast - by Packaging Type
- 9. Middle East & Africa UK Energy Drink Industry Analysis, Insights and Forecast, 2019-2031
- 9.1. Market Analysis, Insights and Forecast - by Packaging Type
- 9.1.1. Can
- 9.1.2. PET Bottle
- 9.2. Market Analysis, Insights and Forecast - by Product Type
- 9.2.1. Drinks
- 9.2.2. Shots
- 9.2.3. Mixers
- 9.3. Market Analysis, Insights and Forecast - by Distribution Channel
- 9.3.1. Supermarkets/Hypermarkets
- 9.3.2. Convenience Stores
- 9.3.3. Specalist Stores
- 9.3.4. Online Retail Stores
- 9.3.5. Other Distribution Channels
- 9.1. Market Analysis, Insights and Forecast - by Packaging Type
- 10. Asia Pacific UK Energy Drink Industry Analysis, Insights and Forecast, 2019-2031
- 10.1. Market Analysis, Insights and Forecast - by Packaging Type
- 10.1.1. Can
- 10.1.2. PET Bottle
- 10.2. Market Analysis, Insights and Forecast - by Product Type
- 10.2.1. Drinks
- 10.2.2. Shots
- 10.2.3. Mixers
- 10.3. Market Analysis, Insights and Forecast - by Distribution Channel
- 10.3.1. Supermarkets/Hypermarkets
- 10.3.2. Convenience Stores
- 10.3.3. Specalist Stores
- 10.3.4. Online Retail Stores
- 10.3.5. Other Distribution Channels
- 10.1. Market Analysis, Insights and Forecast - by Packaging Type
- 11. England UK Energy Drink Industry Analysis, Insights and Forecast, 2019-2031
- 12. Wales UK Energy Drink Industry Analysis, Insights and Forecast, 2019-2031
- 13. Scotland UK Energy Drink Industry Analysis, Insights and Forecast, 2019-2031
- 14. Northern UK Energy Drink Industry Analysis, Insights and Forecast, 2019-2031
- 15. Ireland UK Energy Drink Industry Analysis, Insights and Forecast, 2019-2031
- 16. Competitive Analysis
- 16.1. Global Market Share Analysis 2024
- 16.2. Company Profiles
- 16.2.1 TSI Consumer Goods GmbH
- 16.2.1.1. Overview
- 16.2.1.2. Products
- 16.2.1.3. SWOT Analysis
- 16.2.1.4. Recent Developments
- 16.2.1.5. Financials (Based on Availability)
- 16.2.2 PepsiCo Inc
- 16.2.2.1. Overview
- 16.2.2.2. Products
- 16.2.2.3. SWOT Analysis
- 16.2.2.4. Recent Developments
- 16.2.2.5. Financials (Based on Availability)
- 16.2.3 Max Muscle Nutrition
- 16.2.3.1. Overview
- 16.2.3.2. Products
- 16.2.3.3. SWOT Analysis
- 16.2.3.4. Recent Developments
- 16.2.3.5. Financials (Based on Availability)
- 16.2.4 Suntory Holdings Limited
- 16.2.4.1. Overview
- 16.2.4.2. Products
- 16.2.4.3. SWOT Analysis
- 16.2.4.4. Recent Developments
- 16.2.4.5. Financials (Based on Availability)
- 16.2.5 Red Bull GmbH
- 16.2.5.1. Overview
- 16.2.5.2. Products
- 16.2.5.3. SWOT Analysis
- 16.2.5.4. Recent Developments
- 16.2.5.5. Financials (Based on Availability)
- 16.2.6 The Coca-Cola Company
- 16.2.6.1. Overview
- 16.2.6.2. Products
- 16.2.6.3. SWOT Analysis
- 16.2.6.4. Recent Developments
- 16.2.6.5. Financials (Based on Availability)
- 16.2.7 Nestle SA*List Not Exhaustive
- 16.2.7.1. Overview
- 16.2.7.2. Products
- 16.2.7.3. SWOT Analysis
- 16.2.7.4. Recent Developments
- 16.2.7.5. Financials (Based on Availability)
- 16.2.8 Global Trade Holdings Co Ltd
- 16.2.8.1. Overview
- 16.2.8.2. Products
- 16.2.8.3. SWOT Analysis
- 16.2.8.4. Recent Developments
- 16.2.8.5. Financials (Based on Availability)
- 16.2.9 Monster Energy Company
- 16.2.9.1. Overview
- 16.2.9.2. Products
- 16.2.9.3. SWOT Analysis
- 16.2.9.4. Recent Developments
- 16.2.9.5. Financials (Based on Availability)
- 16.2.10 GlaxoSmithKline PLC
- 16.2.10.1. Overview
- 16.2.10.2. Products
- 16.2.10.3. SWOT Analysis
- 16.2.10.4. Recent Developments
- 16.2.10.5. Financials (Based on Availability)
- 16.2.1 TSI Consumer Goods GmbH
List of Figures
- Figure 1: Global UK Energy Drink Industry Revenue Breakdown (Million, %) by Region 2024 & 2032
- Figure 2: Global UK Energy Drink Industry Volume Breakdown (K Liters, %) by Region 2024 & 2032
- Figure 3: United kingdom Region UK Energy Drink Industry Revenue (Million), by Country 2024 & 2032
- Figure 4: United kingdom Region UK Energy Drink Industry Volume (K Liters), by Country 2024 & 2032
- Figure 5: United kingdom Region UK Energy Drink Industry Revenue Share (%), by Country 2024 & 2032
- Figure 6: United kingdom Region UK Energy Drink Industry Volume Share (%), by Country 2024 & 2032
- Figure 7: North America UK Energy Drink Industry Revenue (Million), by Packaging Type 2024 & 2032
- Figure 8: North America UK Energy Drink Industry Volume (K Liters), by Packaging Type 2024 & 2032
- Figure 9: North America UK Energy Drink Industry Revenue Share (%), by Packaging Type 2024 & 2032
- Figure 10: North America UK Energy Drink Industry Volume Share (%), by Packaging Type 2024 & 2032
- Figure 11: North America UK Energy Drink Industry Revenue (Million), by Product Type 2024 & 2032
- Figure 12: North America UK Energy Drink Industry Volume (K Liters), by Product Type 2024 & 2032
- Figure 13: North America UK Energy Drink Industry Revenue Share (%), by Product Type 2024 & 2032
- Figure 14: North America UK Energy Drink Industry Volume Share (%), by Product Type 2024 & 2032
- Figure 15: North America UK Energy Drink Industry Revenue (Million), by Distribution Channel 2024 & 2032
- Figure 16: North America UK Energy Drink Industry Volume (K Liters), by Distribution Channel 2024 & 2032
- Figure 17: North America UK Energy Drink Industry Revenue Share (%), by Distribution Channel 2024 & 2032
- Figure 18: North America UK Energy Drink Industry Volume Share (%), by Distribution Channel 2024 & 2032
- Figure 19: North America UK Energy Drink Industry Revenue (Million), by Country 2024 & 2032
- Figure 20: North America UK Energy Drink Industry Volume (K Liters), by Country 2024 & 2032
- Figure 21: North America UK Energy Drink Industry Revenue Share (%), by Country 2024 & 2032
- Figure 22: North America UK Energy Drink Industry Volume Share (%), by Country 2024 & 2032
- Figure 23: South America UK Energy Drink Industry Revenue (Million), by Packaging Type 2024 & 2032
- Figure 24: South America UK Energy Drink Industry Volume (K Liters), by Packaging Type 2024 & 2032
- Figure 25: South America UK Energy Drink Industry Revenue Share (%), by Packaging Type 2024 & 2032
- Figure 26: South America UK Energy Drink Industry Volume Share (%), by Packaging Type 2024 & 2032
- Figure 27: South America UK Energy Drink Industry Revenue (Million), by Product Type 2024 & 2032
- Figure 28: South America UK Energy Drink Industry Volume (K Liters), by Product Type 2024 & 2032
- Figure 29: South America UK Energy Drink Industry Revenue Share (%), by Product Type 2024 & 2032
- Figure 30: South America UK Energy Drink Industry Volume Share (%), by Product Type 2024 & 2032
- Figure 31: South America UK Energy Drink Industry Revenue (Million), by Distribution Channel 2024 & 2032
- Figure 32: South America UK Energy Drink Industry Volume (K Liters), by Distribution Channel 2024 & 2032
- Figure 33: South America UK Energy Drink Industry Revenue Share (%), by Distribution Channel 2024 & 2032
- Figure 34: South America UK Energy Drink Industry Volume Share (%), by Distribution Channel 2024 & 2032
- Figure 35: South America UK Energy Drink Industry Revenue (Million), by Country 2024 & 2032
- Figure 36: South America UK Energy Drink Industry Volume (K Liters), by Country 2024 & 2032
- Figure 37: South America UK Energy Drink Industry Revenue Share (%), by Country 2024 & 2032
- Figure 38: South America UK Energy Drink Industry Volume Share (%), by Country 2024 & 2032
- Figure 39: Europe UK Energy Drink Industry Revenue (Million), by Packaging Type 2024 & 2032
- Figure 40: Europe UK Energy Drink Industry Volume (K Liters), by Packaging Type 2024 & 2032
- Figure 41: Europe UK Energy Drink Industry Revenue Share (%), by Packaging Type 2024 & 2032
- Figure 42: Europe UK Energy Drink Industry Volume Share (%), by Packaging Type 2024 & 2032
- Figure 43: Europe UK Energy Drink Industry Revenue (Million), by Product Type 2024 & 2032
- Figure 44: Europe UK Energy Drink Industry Volume (K Liters), by Product Type 2024 & 2032
- Figure 45: Europe UK Energy Drink Industry Revenue Share (%), by Product Type 2024 & 2032
- Figure 46: Europe UK Energy Drink Industry Volume Share (%), by Product Type 2024 & 2032
- Figure 47: Europe UK Energy Drink Industry Revenue (Million), by Distribution Channel 2024 & 2032
- Figure 48: Europe UK Energy Drink Industry Volume (K Liters), by Distribution Channel 2024 & 2032
- Figure 49: Europe UK Energy Drink Industry Revenue Share (%), by Distribution Channel 2024 & 2032
- Figure 50: Europe UK Energy Drink Industry Volume Share (%), by Distribution Channel 2024 & 2032
- Figure 51: Europe UK Energy Drink Industry Revenue (Million), by Country 2024 & 2032
- Figure 52: Europe UK Energy Drink Industry Volume (K Liters), by Country 2024 & 2032
- Figure 53: Europe UK Energy Drink Industry Revenue Share (%), by Country 2024 & 2032
- Figure 54: Europe UK Energy Drink Industry Volume Share (%), by Country 2024 & 2032
- Figure 55: Middle East & Africa UK Energy Drink Industry Revenue (Million), by Packaging Type 2024 & 2032
- Figure 56: Middle East & Africa UK Energy Drink Industry Volume (K Liters), by Packaging Type 2024 & 2032
- Figure 57: Middle East & Africa UK Energy Drink Industry Revenue Share (%), by Packaging Type 2024 & 2032
- Figure 58: Middle East & Africa UK Energy Drink Industry Volume Share (%), by Packaging Type 2024 & 2032
- Figure 59: Middle East & Africa UK Energy Drink Industry Revenue (Million), by Product Type 2024 & 2032
- Figure 60: Middle East & Africa UK Energy Drink Industry Volume (K Liters), by Product Type 2024 & 2032
- Figure 61: Middle East & Africa UK Energy Drink Industry Revenue Share (%), by Product Type 2024 & 2032
- Figure 62: Middle East & Africa UK Energy Drink Industry Volume Share (%), by Product Type 2024 & 2032
- Figure 63: Middle East & Africa UK Energy Drink Industry Revenue (Million), by Distribution Channel 2024 & 2032
- Figure 64: Middle East & Africa UK Energy Drink Industry Volume (K Liters), by Distribution Channel 2024 & 2032
- Figure 65: Middle East & Africa UK Energy Drink Industry Revenue Share (%), by Distribution Channel 2024 & 2032
- Figure 66: Middle East & Africa UK Energy Drink Industry Volume Share (%), by Distribution Channel 2024 & 2032
- Figure 67: Middle East & Africa UK Energy Drink Industry Revenue (Million), by Country 2024 & 2032
- Figure 68: Middle East & Africa UK Energy Drink Industry Volume (K Liters), by Country 2024 & 2032
- Figure 69: Middle East & Africa UK Energy Drink Industry Revenue Share (%), by Country 2024 & 2032
- Figure 70: Middle East & Africa UK Energy Drink Industry Volume Share (%), by Country 2024 & 2032
- Figure 71: Asia Pacific UK Energy Drink Industry Revenue (Million), by Packaging Type 2024 & 2032
- Figure 72: Asia Pacific UK Energy Drink Industry Volume (K Liters), by Packaging Type 2024 & 2032
- Figure 73: Asia Pacific UK Energy Drink Industry Revenue Share (%), by Packaging Type 2024 & 2032
- Figure 74: Asia Pacific UK Energy Drink Industry Volume Share (%), by Packaging Type 2024 & 2032
- Figure 75: Asia Pacific UK Energy Drink Industry Revenue (Million), by Product Type 2024 & 2032
- Figure 76: Asia Pacific UK Energy Drink Industry Volume (K Liters), by Product Type 2024 & 2032
- Figure 77: Asia Pacific UK Energy Drink Industry Revenue Share (%), by Product Type 2024 & 2032
- Figure 78: Asia Pacific UK Energy Drink Industry Volume Share (%), by Product Type 2024 & 2032
- Figure 79: Asia Pacific UK Energy Drink Industry Revenue (Million), by Distribution Channel 2024 & 2032
- Figure 80: Asia Pacific UK Energy Drink Industry Volume (K Liters), by Distribution Channel 2024 & 2032
- Figure 81: Asia Pacific UK Energy Drink Industry Revenue Share (%), by Distribution Channel 2024 & 2032
- Figure 82: Asia Pacific UK Energy Drink Industry Volume Share (%), by Distribution Channel 2024 & 2032
- Figure 83: Asia Pacific UK Energy Drink Industry Revenue (Million), by Country 2024 & 2032
- Figure 84: Asia Pacific UK Energy Drink Industry Volume (K Liters), by Country 2024 & 2032
- Figure 85: Asia Pacific UK Energy Drink Industry Revenue Share (%), by Country 2024 & 2032
- Figure 86: Asia Pacific UK Energy Drink Industry Volume Share (%), by Country 2024 & 2032
List of Tables
- Table 1: Global UK Energy Drink Industry Revenue Million Forecast, by Region 2019 & 2032
- Table 2: Global UK Energy Drink Industry Volume K Liters Forecast, by Region 2019 & 2032
- Table 3: Global UK Energy Drink Industry Revenue Million Forecast, by Packaging Type 2019 & 2032
- Table 4: Global UK Energy Drink Industry Volume K Liters Forecast, by Packaging Type 2019 & 2032
- Table 5: Global UK Energy Drink Industry Revenue Million Forecast, by Product Type 2019 & 2032
- Table 6: Global UK Energy Drink Industry Volume K Liters Forecast, by Product Type 2019 & 2032
- Table 7: Global UK Energy Drink Industry Revenue Million Forecast, by Distribution Channel 2019 & 2032
- Table 8: Global UK Energy Drink Industry Volume K Liters Forecast, by Distribution Channel 2019 & 2032
- Table 9: Global UK Energy Drink Industry Revenue Million Forecast, by Region 2019 & 2032
- Table 10: Global UK Energy Drink Industry Volume K Liters Forecast, by Region 2019 & 2032
- Table 11: Global UK Energy Drink Industry Revenue Million Forecast, by Country 2019 & 2032
- Table 12: Global UK Energy Drink Industry Volume K Liters Forecast, by Country 2019 & 2032
- Table 13: England UK Energy Drink Industry Revenue (Million) Forecast, by Application 2019 & 2032
- Table 14: England UK Energy Drink Industry Volume (K Liters) Forecast, by Application 2019 & 2032
- Table 15: Wales UK Energy Drink Industry Revenue (Million) Forecast, by Application 2019 & 2032
- Table 16: Wales UK Energy Drink Industry Volume (K Liters) Forecast, by Application 2019 & 2032
- Table 17: Scotland UK Energy Drink Industry Revenue (Million) Forecast, by Application 2019 & 2032
- Table 18: Scotland UK Energy Drink Industry Volume (K Liters) Forecast, by Application 2019 & 2032
- Table 19: Northern UK Energy Drink Industry Revenue (Million) Forecast, by Application 2019 & 2032
- Table 20: Northern UK Energy Drink Industry Volume (K Liters) Forecast, by Application 2019 & 2032
- Table 21: Ireland UK Energy Drink Industry Revenue (Million) Forecast, by Application 2019 & 2032
- Table 22: Ireland UK Energy Drink Industry Volume (K Liters) Forecast, by Application 2019 & 2032
- Table 23: Global UK Energy Drink Industry Revenue Million Forecast, by Packaging Type 2019 & 2032
- Table 24: Global UK Energy Drink Industry Volume K Liters Forecast, by Packaging Type 2019 & 2032
- Table 25: Global UK Energy Drink Industry Revenue Million Forecast, by Product Type 2019 & 2032
- Table 26: Global UK Energy Drink Industry Volume K Liters Forecast, by Product Type 2019 & 2032
- Table 27: Global UK Energy Drink Industry Revenue Million Forecast, by Distribution Channel 2019 & 2032
- Table 28: Global UK Energy Drink Industry Volume K Liters Forecast, by Distribution Channel 2019 & 2032
- Table 29: Global UK Energy Drink Industry Revenue Million Forecast, by Country 2019 & 2032
- Table 30: Global UK Energy Drink Industry Volume K Liters Forecast, by Country 2019 & 2032
- Table 31: United States UK Energy Drink Industry Revenue (Million) Forecast, by Application 2019 & 2032
- Table 32: United States UK Energy Drink Industry Volume (K Liters) Forecast, by Application 2019 & 2032
- Table 33: Canada UK Energy Drink Industry Revenue (Million) Forecast, by Application 2019 & 2032
- Table 34: Canada UK Energy Drink Industry Volume (K Liters) Forecast, by Application 2019 & 2032
- Table 35: Mexico UK Energy Drink Industry Revenue (Million) Forecast, by Application 2019 & 2032
- Table 36: Mexico UK Energy Drink Industry Volume (K Liters) Forecast, by Application 2019 & 2032
- Table 37: Global UK Energy Drink Industry Revenue Million Forecast, by Packaging Type 2019 & 2032
- Table 38: Global UK Energy Drink Industry Volume K Liters Forecast, by Packaging Type 2019 & 2032
- Table 39: Global UK Energy Drink Industry Revenue Million Forecast, by Product Type 2019 & 2032
- Table 40: Global UK Energy Drink Industry Volume K Liters Forecast, by Product Type 2019 & 2032
- Table 41: Global UK Energy Drink Industry Revenue Million Forecast, by Distribution Channel 2019 & 2032
- Table 42: Global UK Energy Drink Industry Volume K Liters Forecast, by Distribution Channel 2019 & 2032
- Table 43: Global UK Energy Drink Industry Revenue Million Forecast, by Country 2019 & 2032
- Table 44: Global UK Energy Drink Industry Volume K Liters Forecast, by Country 2019 & 2032
- Table 45: Brazil UK Energy Drink Industry Revenue (Million) Forecast, by Application 2019 & 2032
- Table 46: Brazil UK Energy Drink Industry Volume (K Liters) Forecast, by Application 2019 & 2032
- Table 47: Argentina UK Energy Drink Industry Revenue (Million) Forecast, by Application 2019 & 2032
- Table 48: Argentina UK Energy Drink Industry Volume (K Liters) Forecast, by Application 2019 & 2032
- Table 49: Rest of South America UK Energy Drink Industry Revenue (Million) Forecast, by Application 2019 & 2032
- Table 50: Rest of South America UK Energy Drink Industry Volume (K Liters) Forecast, by Application 2019 & 2032
- Table 51: Global UK Energy Drink Industry Revenue Million Forecast, by Packaging Type 2019 & 2032
- Table 52: Global UK Energy Drink Industry Volume K Liters Forecast, by Packaging Type 2019 & 2032
- Table 53: Global UK Energy Drink Industry Revenue Million Forecast, by Product Type 2019 & 2032
- Table 54: Global UK Energy Drink Industry Volume K Liters Forecast, by Product Type 2019 & 2032
- Table 55: Global UK Energy Drink Industry Revenue Million Forecast, by Distribution Channel 2019 & 2032
- Table 56: Global UK Energy Drink Industry Volume K Liters Forecast, by Distribution Channel 2019 & 2032
- Table 57: Global UK Energy Drink Industry Revenue Million Forecast, by Country 2019 & 2032
- Table 58: Global UK Energy Drink Industry Volume K Liters Forecast, by Country 2019 & 2032
- Table 59: United Kingdom UK Energy Drink Industry Revenue (Million) Forecast, by Application 2019 & 2032
- Table 60: United Kingdom UK Energy Drink Industry Volume (K Liters) Forecast, by Application 2019 & 2032
- Table 61: Germany UK Energy Drink Industry Revenue (Million) Forecast, by Application 2019 & 2032
- Table 62: Germany UK Energy Drink Industry Volume (K Liters) Forecast, by Application 2019 & 2032
- Table 63: France UK Energy Drink Industry Revenue (Million) Forecast, by Application 2019 & 2032
- Table 64: France UK Energy Drink Industry Volume (K Liters) Forecast, by Application 2019 & 2032
- Table 65: Italy UK Energy Drink Industry Revenue (Million) Forecast, by Application 2019 & 2032
- Table 66: Italy UK Energy Drink Industry Volume (K Liters) Forecast, by Application 2019 & 2032
- Table 67: Spain UK Energy Drink Industry Revenue (Million) Forecast, by Application 2019 & 2032
- Table 68: Spain UK Energy Drink Industry Volume (K Liters) Forecast, by Application 2019 & 2032
- Table 69: Russia UK Energy Drink Industry Revenue (Million) Forecast, by Application 2019 & 2032
- Table 70: Russia UK Energy Drink Industry Volume (K Liters) Forecast, by Application 2019 & 2032
- Table 71: Benelux UK Energy Drink Industry Revenue (Million) Forecast, by Application 2019 & 2032
- Table 72: Benelux UK Energy Drink Industry Volume (K Liters) Forecast, by Application 2019 & 2032
- Table 73: Nordics UK Energy Drink Industry Revenue (Million) Forecast, by Application 2019 & 2032
- Table 74: Nordics UK Energy Drink Industry Volume (K Liters) Forecast, by Application 2019 & 2032
- Table 75: Rest of Europe UK Energy Drink Industry Revenue (Million) Forecast, by Application 2019 & 2032
- Table 76: Rest of Europe UK Energy Drink Industry Volume (K Liters) Forecast, by Application 2019 & 2032
- Table 77: Global UK Energy Drink Industry Revenue Million Forecast, by Packaging Type 2019 & 2032
- Table 78: Global UK Energy Drink Industry Volume K Liters Forecast, by Packaging Type 2019 & 2032
- Table 79: Global UK Energy Drink Industry Revenue Million Forecast, by Product Type 2019 & 2032
- Table 80: Global UK Energy Drink Industry Volume K Liters Forecast, by Product Type 2019 & 2032
- Table 81: Global UK Energy Drink Industry Revenue Million Forecast, by Distribution Channel 2019 & 2032
- Table 82: Global UK Energy Drink Industry Volume K Liters Forecast, by Distribution Channel 2019 & 2032
- Table 83: Global UK Energy Drink Industry Revenue Million Forecast, by Country 2019 & 2032
- Table 84: Global UK Energy Drink Industry Volume K Liters Forecast, by Country 2019 & 2032
- Table 85: Turkey UK Energy Drink Industry Revenue (Million) Forecast, by Application 2019 & 2032
- Table 86: Turkey UK Energy Drink Industry Volume (K Liters) Forecast, by Application 2019 & 2032
- Table 87: Israel UK Energy Drink Industry Revenue (Million) Forecast, by Application 2019 & 2032
- Table 88: Israel UK Energy Drink Industry Volume (K Liters) Forecast, by Application 2019 & 2032
- Table 89: GCC UK Energy Drink Industry Revenue (Million) Forecast, by Application 2019 & 2032
- Table 90: GCC UK Energy Drink Industry Volume (K Liters) Forecast, by Application 2019 & 2032
- Table 91: North Africa UK Energy Drink Industry Revenue (Million) Forecast, by Application 2019 & 2032
- Table 92: North Africa UK Energy Drink Industry Volume (K Liters) Forecast, by Application 2019 & 2032
- Table 93: South Africa UK Energy Drink Industry Revenue (Million) Forecast, by Application 2019 & 2032
- Table 94: South Africa UK Energy Drink Industry Volume (K Liters) Forecast, by Application 2019 & 2032
- Table 95: Rest of Middle East & Africa UK Energy Drink Industry Revenue (Million) Forecast, by Application 2019 & 2032
- Table 96: Rest of Middle East & Africa UK Energy Drink Industry Volume (K Liters) Forecast, by Application 2019 & 2032
- Table 97: Global UK Energy Drink Industry Revenue Million Forecast, by Packaging Type 2019 & 2032
- Table 98: Global UK Energy Drink Industry Volume K Liters Forecast, by Packaging Type 2019 & 2032
- Table 99: Global UK Energy Drink Industry Revenue Million Forecast, by Product Type 2019 & 2032
- Table 100: Global UK Energy Drink Industry Volume K Liters Forecast, by Product Type 2019 & 2032
- Table 101: Global UK Energy Drink Industry Revenue Million Forecast, by Distribution Channel 2019 & 2032
- Table 102: Global UK Energy Drink Industry Volume K Liters Forecast, by Distribution Channel 2019 & 2032
- Table 103: Global UK Energy Drink Industry Revenue Million Forecast, by Country 2019 & 2032
- Table 104: Global UK Energy Drink Industry Volume K Liters Forecast, by Country 2019 & 2032
- Table 105: China UK Energy Drink Industry Revenue (Million) Forecast, by Application 2019 & 2032
- Table 106: China UK Energy Drink Industry Volume (K Liters) Forecast, by Application 2019 & 2032
- Table 107: India UK Energy Drink Industry Revenue (Million) Forecast, by Application 2019 & 2032
- Table 108: India UK Energy Drink Industry Volume (K Liters) Forecast, by Application 2019 & 2032
- Table 109: Japan UK Energy Drink Industry Revenue (Million) Forecast, by Application 2019 & 2032
- Table 110: Japan UK Energy Drink Industry Volume (K Liters) Forecast, by Application 2019 & 2032
- Table 111: South Korea UK Energy Drink Industry Revenue (Million) Forecast, by Application 2019 & 2032
- Table 112: South Korea UK Energy Drink Industry Volume (K Liters) Forecast, by Application 2019 & 2032
- Table 113: ASEAN UK Energy Drink Industry Revenue (Million) Forecast, by Application 2019 & 2032
- Table 114: ASEAN UK Energy Drink Industry Volume (K Liters) Forecast, by Application 2019 & 2032
- Table 115: Oceania UK Energy Drink Industry Revenue (Million) Forecast, by Application 2019 & 2032
- Table 116: Oceania UK Energy Drink Industry Volume (K Liters) Forecast, by Application 2019 & 2032
- Table 117: Rest of Asia Pacific UK Energy Drink Industry Revenue (Million) Forecast, by Application 2019 & 2032
- Table 118: Rest of Asia Pacific UK Energy Drink Industry Volume (K Liters) Forecast, by Application 2019 & 2032
Frequently Asked Questions
1. What is the projected Compound Annual Growth Rate (CAGR) of the UK Energy Drink Industry?
The projected CAGR is approximately 4.50%.
2. Which companies are prominent players in the UK Energy Drink Industry?
Key companies in the market include TSI Consumer Goods GmbH, PepsiCo Inc, Max Muscle Nutrition, Suntory Holdings Limited, Red Bull GmbH, The Coca-Cola Company, Nestle SA*List Not Exhaustive, Global Trade Holdings Co Ltd, Monster Energy Company, GlaxoSmithKline PLC.
3. What are the main segments of the UK Energy Drink Industry?
The market segments include Packaging Type, Product Type, Distribution Channel.
4. Can you provide details about the market size?
The market size is estimated to be USD XX Million as of 2022.
5. What are some drivers contributing to market growth?
Rising Health & Wellness Trends; Strategic Initiatives By Key Players.
6. What are the notable trends driving market growth?
The Drinks Segment Dominates the Energy Drink Market.
7. Are there any restraints impacting market growth?
Cost Considerations Coupled With Availability Of Alternatives.
8. Can you provide examples of recent developments in the market?
In September 2022, Virtue Clean Energy, the brand that creates clean alternatives in the energy drink category, launched its newest product, Virtue Clean Energy in the United Kingdom. Virtue Drinks contain zero sugar & zero calories, made with all-natural ingredients. It has 80mg of 100% organic caffeine derived from green coffee beans, plus B vitamins (B3, B6, B7, B12).
9. What pricing options are available for accessing the report?
Pricing options include single-user, multi-user, and enterprise licenses priced at USD 3800, USD 4500, and USD 5800 respectively.
10. Is the market size provided in terms of value or volume?
The market size is provided in terms of value, measured in Million and volume, measured in K Liters.
11. Are there any specific market keywords associated with the report?
Yes, the market keyword associated with the report is "UK Energy Drink Industry," which aids in identifying and referencing the specific market segment covered.
12. How do I determine which pricing option suits my needs best?
The pricing options vary based on user requirements and access needs. Individual users may opt for single-user licenses, while businesses requiring broader access may choose multi-user or enterprise licenses for cost-effective access to the report.
13. Are there any additional resources or data provided in the UK Energy Drink Industry report?
While the report offers comprehensive insights, it's advisable to review the specific contents or supplementary materials provided to ascertain if additional resources or data are available.
14. How can I stay updated on further developments or reports in the UK Energy Drink Industry?
To stay informed about further developments, trends, and reports in the UK Energy Drink Industry, consider subscribing to industry newsletters, following relevant companies and organizations, or regularly checking reputable industry news sources and publications.
Methodology
Step 1 - Identification of Relevant Samples Size from Population Database


Step 2 - Approaches for Defining Global Market Size (Value, Volume* & Price*)

Note*: In applicable scenarios
Step 3 - Data Sources
Primary Research
- Web Analytics
- Survey Reports
- Research Institute
- Latest Research Reports
- Opinion Leaders
Secondary Research
- Annual Reports
- White Paper
- Latest Press Release
- Industry Association
- Paid Database
- Investor Presentations

Step 4 - Data Triangulation
Involves using different sources of information in order to increase the validity of a study
These sources are likely to be stakeholders in a program - participants, other researchers, program staff, other community members, and so on.
Then we put all data in single framework & apply various statistical tools to find out the dynamic on the market.
During the analysis stage, feedback from the stakeholder groups would be compared to determine areas of agreement as well as areas of divergence
