

Key Insights
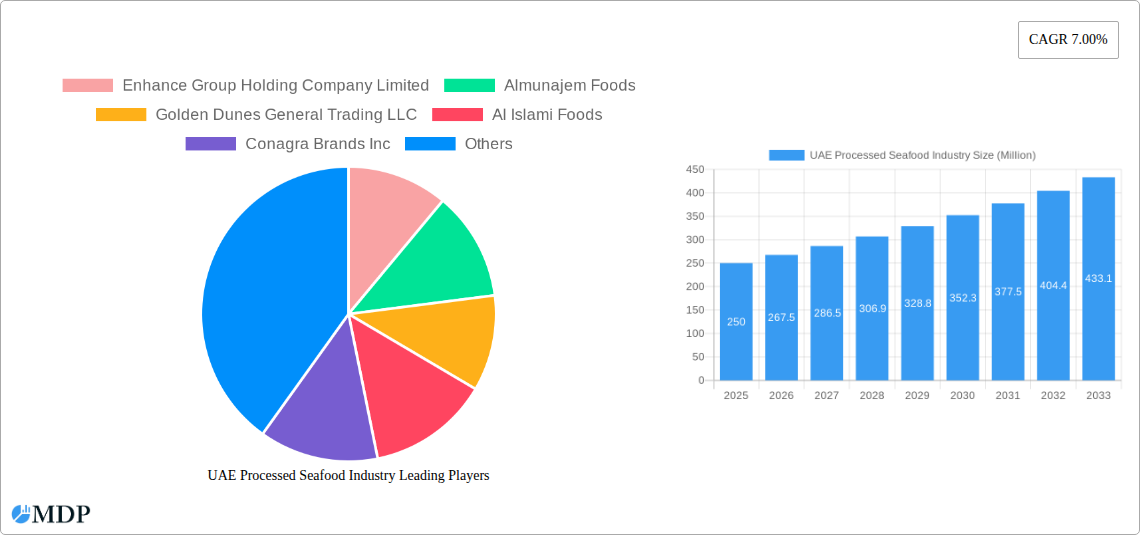
The UAE processed seafood industry, valued at approximately $250 million in 2025, is projected to experience robust growth, driven by rising consumer demand for convenient and healthy food options. The increasing popularity of ready-to-eat meals and the growing preference for diverse seafood choices are key factors fueling this expansion. Furthermore, the UAE's strategic location as a major trading hub and its thriving tourism sector contribute significantly to market growth. The frozen segment is likely the largest, accounting for roughly 40% of the market, followed by canned seafood at 30%, reflecting consumer preference for preservation methods that extend shelf life. The substantial influx of expatriates in the UAE also contributes to diverse culinary demands, boosting demand for processed seafood products from various global cuisines. Key distribution channels include both on-trade (restaurants, hotels) and off-trade (supermarkets, retail stores), with off-trade channels likely holding a larger share due to increased consumer preference for home-cooked meals and the convenience of grocery stores. However, challenges such as fluctuating seafood prices, import regulations, and competition from other protein sources present potential restraints on market growth. Companies like Enhance Group Holding Company Limited and Almunajem Foods are major players leveraging their established distribution networks and brand recognition to maintain a competitive edge.
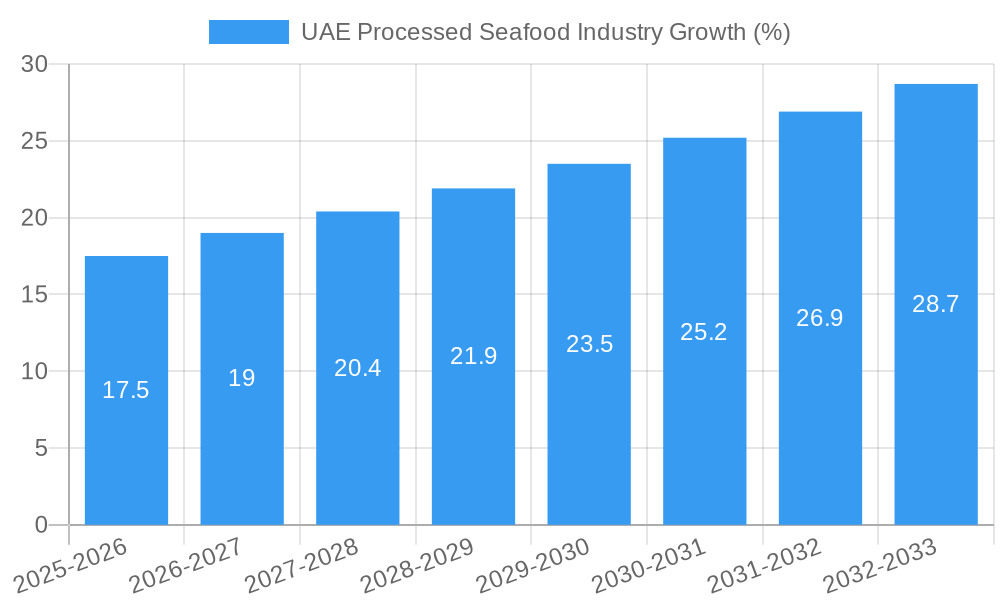
The forecast period (2025-2033) anticipates a sustained CAGR of 7%, indicating a market size exceeding $450 million by 2033. This growth trajectory will be influenced by government initiatives promoting food security and diversification, coupled with rising disposable incomes and a burgeoning middle class increasingly adopting diverse dietary habits. The "Other Seafood" category, encompassing a range of processed seafood products beyond fish and shrimp, is expected to experience relatively faster growth due to increasing consumer exploration of unique and exotic seafood varieties. The continued development of innovative packaging solutions that enhance product shelf life and maintain quality will also play a significant role in shaping the market's future. Strong competition within the industry will necessitate continuous product innovation, efficient supply chains, and strategic marketing efforts to capture significant market share.
UAE Processed Seafood Industry: A Comprehensive Market Report (2019-2033)
This in-depth report provides a comprehensive analysis of the UAE processed seafood industry, covering market dynamics, leading players, key trends, and future growth prospects. From 2019 to 2033, the report offers invaluable insights for industry stakeholders, investors, and strategic decision-makers. The study period spans from 2019-2024 (Historical Period), with the base year set at 2025 and the forecast period extending to 2033 (Forecast Period: 2025-2033). This report leverages a robust dataset to analyze market size and growth, reaching into the multi-million dollar range.
UAE Processed Seafood Industry Market Dynamics & Concentration
The UAE processed seafood market is characterized by a moderate level of concentration, with a few major players holding significant market share. Enhance Group Holding Company Limited, Almunajem Foods, Golden Dunes General Trading LLC, Al Islami Foods, Conagra Brands Inc, The Deep Seafood Company, The Savola Group, and Tabuk Fisheries Co. are key players, but their exact market share figures remain proprietary. Innovation is driven by consumer demand for convenient, healthy, and sustainably sourced seafood products, spurring investments in advanced processing technologies and packaging solutions. The regulatory framework, while generally supportive of the industry, includes stringent food safety and quality standards that require compliance. Product substitutes, such as plant-based alternatives, are gaining traction but currently represent a small fraction of the market (xx%). End-user trends reflect a growing preference for convenient ready-to-eat meals and value-added seafood products. M&A activity in the sector has been relatively modest in recent years, with xx major deals recorded during the historical period. The average deal size is estimated at xx Million.
UAE Processed Seafood Industry Industry Trends & Analysis
The UAE processed seafood market exhibits robust growth, driven by factors such as increasing per capita seafood consumption, tourism influx, and a rising population. The CAGR for the forecast period (2025-2033) is projected to be xx%, exceeding the global average. Technological disruptions, primarily in processing and packaging, are increasing efficiency and extending product shelf life. Consumer preferences are shifting towards healthier and more sustainable options, influencing product development and sourcing strategies. The market penetration of value-added products, such as ready-to-eat meals and marinated seafood, is steadily increasing. Competitive dynamics are shaped by factors such as pricing strategies, brand loyalty, and distribution networks. The market is characterized by both local and international players, resulting in a diverse competitive landscape.
Leading Markets & Segments in UAE Processed Seafood Industry
The UAE's processed seafood market is dominated by the frozen segment, driven by its extended shelf life and convenience. Frozen seafood accounts for approximately xx% of the market (estimated).
- Key Drivers of Frozen Segment Dominance:
- Strong cold chain infrastructure.
- Ease of storage and transportation.
- Longer shelf life compared to fresh/chilled options.
The Fish segment leads in terms of volume, accounting for an estimated xx% of the total processed seafood market. Shrimp holds a significant share as well, due to its popularity among consumers. The "On-Trade" distribution channel (restaurants, hotels) is predicted to dominate over the "Off-Trade" channel (retail) due to the high concentration of tourists in major UAE cities. Dubai and Abu Dhabi are the leading markets, primarily driven by higher income levels and robust foodservice sectors.
UAE Processed Seafood Industry Product Developments
Recent product innovations focus on ready-to-eat meals, value-added products with unique marinades or flavors, and sustainable packaging solutions. Technological advancements in freezing and preservation techniques are enabling longer shelf lives and maintaining product quality. The emphasis is on meeting consumer demand for convenience, health, and sustainability. This includes incorporating locally sourced seafood to enhance sustainability and consumer appeal.
Key Drivers of UAE Processed Seafood Industry Growth
Several factors contribute to the growth of the UAE processed seafood industry. Technological advancements in processing and preservation techniques enhance efficiency and quality. Government initiatives promoting food security and sustainable aquaculture practices provide a favorable regulatory environment. The rising disposable income of consumers and increasing preference for convenient, ready-to-eat meals fuel market expansion. The tourism sector acts as a significant driver, as the UAE is known as a popular tourist destination where visitors often frequent restaurants and hotels, leading to higher seafood demand.
Challenges in the UAE Processed Seafood Industry Market
The industry faces challenges such as fluctuating raw material prices, dependence on imports for certain species, and maintaining consistent supply chain efficiency. Stringent food safety and quality regulations can increase operational costs. Intense competition from international and domestic players demands continuous innovation and efficient operations. The estimated impact of these challenges on the market is a reduced growth rate of xx% compared to initial projections.
Emerging Opportunities in UAE Processed Seafood Industry
Growing consumer awareness about health and sustainability creates opportunities for the development of innovative, value-added products like organic and sustainably sourced seafood. Strategic partnerships between local producers and international brands can expand market reach and access new technologies. Exploring alternative seafood sources, such as aquaculture, can reduce reliance on imports. Investments in sustainable aquaculture and cold chain infrastructure will enhance the market further.
Leading Players in the UAE Processed Seafood Industry Sector
- Enhance Group Holding Company Limited
- Almunajem Foods
- Golden Dunes General Trading LLC
- Al Islami Foods
- Conagra Brands Inc
- The Deep Seafood Company
- The Savola Group
- Tabuk Fisheries Co
Key Milestones in UAE Processed Seafood Industry Industry
- December 2020: Al Islami Foods signed an agreement to distribute the JBS/Seara brand in the UAE, expanding its seafood product portfolio.
- April 2021: Tabuk Fisheries, in collaboration with NEOM, signed a MoU to expand local aquaculture production, establishing a hatchery with a capacity of 70 million fingerlings—the largest in the MENA region.
- February 2022: Asmak secured a strategic distribution agreement with Fish Farm, a UAE-based aquaculture company, broadening its reach through wholesale, foodservice, and retail channels.
Strategic Outlook for UAE Processed Seafood Industry Market
The UAE processed seafood market is poised for sustained growth, driven by consumer demand for convenient and healthy options. Strategic investments in sustainable aquaculture, advanced processing technologies, and robust cold chain infrastructure are essential for capitalizing on emerging opportunities. Collaborations between local producers and international brands can further enhance market penetration and competitiveness. The long-term potential for market expansion is substantial, particularly in value-added products and sustainable seafood options. The market is expected to reach xx Million by 2033.
UAE Processed Seafood Industry Segmentation
-
1. Type
- 1.1. Fish
- 1.2. Shrimp
- 1.3. Other Seafood
-
2. Form
- 2.1. Canned
- 2.2. Fresh / Chilled
- 2.3. Frozen
- 2.4. Processed
-
3. Distribution Channel
-
3.1. Off-Trade
- 3.1.1. Convenience Stores
- 3.1.2. Online Channel
- 3.1.3. Supermarkets and Hypermarkets
- 3.1.4. Others
- 3.2. On-Trade
-
3.1. Off-Trade
UAE Processed Seafood Industry Segmentation By Geography
-
1. North America
- 1.1. United States
- 1.2. Canada
- 1.3. Mexico
-
2. South America
- 2.1. Brazil
- 2.2. Argentina
- 2.3. Rest of South America
-
3. Europe
- 3.1. United Kingdom
- 3.2. Germany
- 3.3. France
- 3.4. Italy
- 3.5. Spain
- 3.6. Russia
- 3.7. Benelux
- 3.8. Nordics
- 3.9. Rest of Europe
-
4. Middle East & Africa
- 4.1. Turkey
- 4.2. Israel
- 4.3. GCC
- 4.4. North Africa
- 4.5. South Africa
- 4.6. Rest of Middle East & Africa
-
5. Asia Pacific
- 5.1. China
- 5.2. India
- 5.3. Japan
- 5.4. South Korea
- 5.5. ASEAN
- 5.6. Oceania
- 5.7. Rest of Asia Pacific
UAE Processed Seafood Industry REPORT HIGHLIGHTS
| Aspects | Details |
|---|---|
| Study Period | 2019-2033 |
| Base Year | 2024 |
| Estimated Year | 2025 |
| Forecast Period | 2025-2033 |
| Historical Period | 2019-2024 |
| Growth Rate | CAGR of 7.00% from 2019-2033 |
| Segmentation |
|
Table of Contents
- 1. Introduction
- 1.1. Research Scope
- 1.2. Market Segmentation
- 1.3. Research Methodology
- 1.4. Definitions and Assumptions
- 2. Executive Summary
- 2.1. Introduction
- 3. Market Dynamics
- 3.1. Introduction
- 3.2. Market Drivers
- 3.2.1. Consumer inclination toward functional food and beverages; Increasing Number of Applications and Growing Industrial Use
- 3.3. Market Restrains
- 3.3.1. Increasing Shift Toward Plant-Based Protein
- 3.4. Market Trends
- 3.4.1. OTHER KEY INDUSTRY TRENDS COVERED IN THE REPORT
- 4. Market Factor Analysis
- 4.1. Porters Five Forces
- 4.2. Supply/Value Chain
- 4.3. PESTEL analysis
- 4.4. Market Entropy
- 4.5. Patent/Trademark Analysis
- 5. Global UAE Processed Seafood Industry Analysis, Insights and Forecast, 2019-2031
- 5.1. Market Analysis, Insights and Forecast - by Type
- 5.1.1. Fish
- 5.1.2. Shrimp
- 5.1.3. Other Seafood
- 5.2. Market Analysis, Insights and Forecast - by Form
- 5.2.1. Canned
- 5.2.2. Fresh / Chilled
- 5.2.3. Frozen
- 5.2.4. Processed
- 5.3. Market Analysis, Insights and Forecast - by Distribution Channel
- 5.3.1. Off-Trade
- 5.3.1.1. Convenience Stores
- 5.3.1.2. Online Channel
- 5.3.1.3. Supermarkets and Hypermarkets
- 5.3.1.4. Others
- 5.3.2. On-Trade
- 5.3.1. Off-Trade
- 5.4. Market Analysis, Insights and Forecast - by Region
- 5.4.1. North America
- 5.4.2. South America
- 5.4.3. Europe
- 5.4.4. Middle East & Africa
- 5.4.5. Asia Pacific
- 5.1. Market Analysis, Insights and Forecast - by Type
- 6. North America UAE Processed Seafood Industry Analysis, Insights and Forecast, 2019-2031
- 6.1. Market Analysis, Insights and Forecast - by Type
- 6.1.1. Fish
- 6.1.2. Shrimp
- 6.1.3. Other Seafood
- 6.2. Market Analysis, Insights and Forecast - by Form
- 6.2.1. Canned
- 6.2.2. Fresh / Chilled
- 6.2.3. Frozen
- 6.2.4. Processed
- 6.3. Market Analysis, Insights and Forecast - by Distribution Channel
- 6.3.1. Off-Trade
- 6.3.1.1. Convenience Stores
- 6.3.1.2. Online Channel
- 6.3.1.3. Supermarkets and Hypermarkets
- 6.3.1.4. Others
- 6.3.2. On-Trade
- 6.3.1. Off-Trade
- 6.1. Market Analysis, Insights and Forecast - by Type
- 7. South America UAE Processed Seafood Industry Analysis, Insights and Forecast, 2019-2031
- 7.1. Market Analysis, Insights and Forecast - by Type
- 7.1.1. Fish
- 7.1.2. Shrimp
- 7.1.3. Other Seafood
- 7.2. Market Analysis, Insights and Forecast - by Form
- 7.2.1. Canned
- 7.2.2. Fresh / Chilled
- 7.2.3. Frozen
- 7.2.4. Processed
- 7.3. Market Analysis, Insights and Forecast - by Distribution Channel
- 7.3.1. Off-Trade
- 7.3.1.1. Convenience Stores
- 7.3.1.2. Online Channel
- 7.3.1.3. Supermarkets and Hypermarkets
- 7.3.1.4. Others
- 7.3.2. On-Trade
- 7.3.1. Off-Trade
- 7.1. Market Analysis, Insights and Forecast - by Type
- 8. Europe UAE Processed Seafood Industry Analysis, Insights and Forecast, 2019-2031
- 8.1. Market Analysis, Insights and Forecast - by Type
- 8.1.1. Fish
- 8.1.2. Shrimp
- 8.1.3. Other Seafood
- 8.2. Market Analysis, Insights and Forecast - by Form
- 8.2.1. Canned
- 8.2.2. Fresh / Chilled
- 8.2.3. Frozen
- 8.2.4. Processed
- 8.3. Market Analysis, Insights and Forecast - by Distribution Channel
- 8.3.1. Off-Trade
- 8.3.1.1. Convenience Stores
- 8.3.1.2. Online Channel
- 8.3.1.3. Supermarkets and Hypermarkets
- 8.3.1.4. Others
- 8.3.2. On-Trade
- 8.3.1. Off-Trade
- 8.1. Market Analysis, Insights and Forecast - by Type
- 9. Middle East & Africa UAE Processed Seafood Industry Analysis, Insights and Forecast, 2019-2031
- 9.1. Market Analysis, Insights and Forecast - by Type
- 9.1.1. Fish
- 9.1.2. Shrimp
- 9.1.3. Other Seafood
- 9.2. Market Analysis, Insights and Forecast - by Form
- 9.2.1. Canned
- 9.2.2. Fresh / Chilled
- 9.2.3. Frozen
- 9.2.4. Processed
- 9.3. Market Analysis, Insights and Forecast - by Distribution Channel
- 9.3.1. Off-Trade
- 9.3.1.1. Convenience Stores
- 9.3.1.2. Online Channel
- 9.3.1.3. Supermarkets and Hypermarkets
- 9.3.1.4. Others
- 9.3.2. On-Trade
- 9.3.1. Off-Trade
- 9.1. Market Analysis, Insights and Forecast - by Type
- 10. Asia Pacific UAE Processed Seafood Industry Analysis, Insights and Forecast, 2019-2031
- 10.1. Market Analysis, Insights and Forecast - by Type
- 10.1.1. Fish
- 10.1.2. Shrimp
- 10.1.3. Other Seafood
- 10.2. Market Analysis, Insights and Forecast - by Form
- 10.2.1. Canned
- 10.2.2. Fresh / Chilled
- 10.2.3. Frozen
- 10.2.4. Processed
- 10.3. Market Analysis, Insights and Forecast - by Distribution Channel
- 10.3.1. Off-Trade
- 10.3.1.1. Convenience Stores
- 10.3.1.2. Online Channel
- 10.3.1.3. Supermarkets and Hypermarkets
- 10.3.1.4. Others
- 10.3.2. On-Trade
- 10.3.1. Off-Trade
- 10.1. Market Analysis, Insights and Forecast - by Type
- 11. UAE UAE Processed Seafood Industry Analysis, Insights and Forecast, 2019-2031
- 12. South Africa UAE Processed Seafood Industry Analysis, Insights and Forecast, 2019-2031
- 13. Saudi Arabia UAE Processed Seafood Industry Analysis, Insights and Forecast, 2019-2031
- 14. Rest of MEA UAE Processed Seafood Industry Analysis, Insights and Forecast, 2019-2031
- 15. Competitive Analysis
- 15.1. Global Market Share Analysis 2024
- 15.2. Company Profiles
- 15.2.1 Enhance Group Holding Company Limited
- 15.2.1.1. Overview
- 15.2.1.2. Products
- 15.2.1.3. SWOT Analysis
- 15.2.1.4. Recent Developments
- 15.2.1.5. Financials (Based on Availability)
- 15.2.2 Almunajem Foods
- 15.2.2.1. Overview
- 15.2.2.2. Products
- 15.2.2.3. SWOT Analysis
- 15.2.2.4. Recent Developments
- 15.2.2.5. Financials (Based on Availability)
- 15.2.3 Golden Dunes General Trading LLC
- 15.2.3.1. Overview
- 15.2.3.2. Products
- 15.2.3.3. SWOT Analysis
- 15.2.3.4. Recent Developments
- 15.2.3.5. Financials (Based on Availability)
- 15.2.4 Al Islami Foods
- 15.2.4.1. Overview
- 15.2.4.2. Products
- 15.2.4.3. SWOT Analysis
- 15.2.4.4. Recent Developments
- 15.2.4.5. Financials (Based on Availability)
- 15.2.5 Conagra Brands Inc
- 15.2.5.1. Overview
- 15.2.5.2. Products
- 15.2.5.3. SWOT Analysis
- 15.2.5.4. Recent Developments
- 15.2.5.5. Financials (Based on Availability)
- 15.2.6 The Deep Seafood Company
- 15.2.6.1. Overview
- 15.2.6.2. Products
- 15.2.6.3. SWOT Analysis
- 15.2.6.4. Recent Developments
- 15.2.6.5. Financials (Based on Availability)
- 15.2.7 The Savola Grou
- 15.2.7.1. Overview
- 15.2.7.2. Products
- 15.2.7.3. SWOT Analysis
- 15.2.7.4. Recent Developments
- 15.2.7.5. Financials (Based on Availability)
- 15.2.8 Tabuk Fisheries Co
- 15.2.8.1. Overview
- 15.2.8.2. Products
- 15.2.8.3. SWOT Analysis
- 15.2.8.4. Recent Developments
- 15.2.8.5. Financials (Based on Availability)
- 15.2.1 Enhance Group Holding Company Limited
List of Figures
- Figure 1: Global UAE Processed Seafood Industry Revenue Breakdown (Million, %) by Region 2024 & 2032
- Figure 2: Global UAE Processed Seafood Industry Volume Breakdown (Thousand Tons, %) by Region 2024 & 2032
- Figure 3: Middle East & Africa UAE Processed Seafood Industry Revenue (Million), by Country 2024 & 2032
- Figure 4: Middle East & Africa UAE Processed Seafood Industry Volume (Thousand Tons), by Country 2024 & 2032
- Figure 5: Middle East & Africa UAE Processed Seafood Industry Revenue Share (%), by Country 2024 & 2032
- Figure 6: Middle East & Africa UAE Processed Seafood Industry Volume Share (%), by Country 2024 & 2032
- Figure 7: North America UAE Processed Seafood Industry Revenue (Million), by Type 2024 & 2032
- Figure 8: North America UAE Processed Seafood Industry Volume (Thousand Tons), by Type 2024 & 2032
- Figure 9: North America UAE Processed Seafood Industry Revenue Share (%), by Type 2024 & 2032
- Figure 10: North America UAE Processed Seafood Industry Volume Share (%), by Type 2024 & 2032
- Figure 11: North America UAE Processed Seafood Industry Revenue (Million), by Form 2024 & 2032
- Figure 12: North America UAE Processed Seafood Industry Volume (Thousand Tons), by Form 2024 & 2032
- Figure 13: North America UAE Processed Seafood Industry Revenue Share (%), by Form 2024 & 2032
- Figure 14: North America UAE Processed Seafood Industry Volume Share (%), by Form 2024 & 2032
- Figure 15: North America UAE Processed Seafood Industry Revenue (Million), by Distribution Channel 2024 & 2032
- Figure 16: North America UAE Processed Seafood Industry Volume (Thousand Tons), by Distribution Channel 2024 & 2032
- Figure 17: North America UAE Processed Seafood Industry Revenue Share (%), by Distribution Channel 2024 & 2032
- Figure 18: North America UAE Processed Seafood Industry Volume Share (%), by Distribution Channel 2024 & 2032
- Figure 19: North America UAE Processed Seafood Industry Revenue (Million), by Country 2024 & 2032
- Figure 20: North America UAE Processed Seafood Industry Volume (Thousand Tons), by Country 2024 & 2032
- Figure 21: North America UAE Processed Seafood Industry Revenue Share (%), by Country 2024 & 2032
- Figure 22: North America UAE Processed Seafood Industry Volume Share (%), by Country 2024 & 2032
- Figure 23: South America UAE Processed Seafood Industry Revenue (Million), by Type 2024 & 2032
- Figure 24: South America UAE Processed Seafood Industry Volume (Thousand Tons), by Type 2024 & 2032
- Figure 25: South America UAE Processed Seafood Industry Revenue Share (%), by Type 2024 & 2032
- Figure 26: South America UAE Processed Seafood Industry Volume Share (%), by Type 2024 & 2032
- Figure 27: South America UAE Processed Seafood Industry Revenue (Million), by Form 2024 & 2032
- Figure 28: South America UAE Processed Seafood Industry Volume (Thousand Tons), by Form 2024 & 2032
- Figure 29: South America UAE Processed Seafood Industry Revenue Share (%), by Form 2024 & 2032
- Figure 30: South America UAE Processed Seafood Industry Volume Share (%), by Form 2024 & 2032
- Figure 31: South America UAE Processed Seafood Industry Revenue (Million), by Distribution Channel 2024 & 2032
- Figure 32: South America UAE Processed Seafood Industry Volume (Thousand Tons), by Distribution Channel 2024 & 2032
- Figure 33: South America UAE Processed Seafood Industry Revenue Share (%), by Distribution Channel 2024 & 2032
- Figure 34: South America UAE Processed Seafood Industry Volume Share (%), by Distribution Channel 2024 & 2032
- Figure 35: South America UAE Processed Seafood Industry Revenue (Million), by Country 2024 & 2032
- Figure 36: South America UAE Processed Seafood Industry Volume (Thousand Tons), by Country 2024 & 2032
- Figure 37: South America UAE Processed Seafood Industry Revenue Share (%), by Country 2024 & 2032
- Figure 38: South America UAE Processed Seafood Industry Volume Share (%), by Country 2024 & 2032
- Figure 39: Europe UAE Processed Seafood Industry Revenue (Million), by Type 2024 & 2032
- Figure 40: Europe UAE Processed Seafood Industry Volume (Thousand Tons), by Type 2024 & 2032
- Figure 41: Europe UAE Processed Seafood Industry Revenue Share (%), by Type 2024 & 2032
- Figure 42: Europe UAE Processed Seafood Industry Volume Share (%), by Type 2024 & 2032
- Figure 43: Europe UAE Processed Seafood Industry Revenue (Million), by Form 2024 & 2032
- Figure 44: Europe UAE Processed Seafood Industry Volume (Thousand Tons), by Form 2024 & 2032
- Figure 45: Europe UAE Processed Seafood Industry Revenue Share (%), by Form 2024 & 2032
- Figure 46: Europe UAE Processed Seafood Industry Volume Share (%), by Form 2024 & 2032
- Figure 47: Europe UAE Processed Seafood Industry Revenue (Million), by Distribution Channel 2024 & 2032
- Figure 48: Europe UAE Processed Seafood Industry Volume (Thousand Tons), by Distribution Channel 2024 & 2032
- Figure 49: Europe UAE Processed Seafood Industry Revenue Share (%), by Distribution Channel 2024 & 2032
- Figure 50: Europe UAE Processed Seafood Industry Volume Share (%), by Distribution Channel 2024 & 2032
- Figure 51: Europe UAE Processed Seafood Industry Revenue (Million), by Country 2024 & 2032
- Figure 52: Europe UAE Processed Seafood Industry Volume (Thousand Tons), by Country 2024 & 2032
- Figure 53: Europe UAE Processed Seafood Industry Revenue Share (%), by Country 2024 & 2032
- Figure 54: Europe UAE Processed Seafood Industry Volume Share (%), by Country 2024 & 2032
- Figure 55: Middle East & Africa UAE Processed Seafood Industry Revenue (Million), by Type 2024 & 2032
- Figure 56: Middle East & Africa UAE Processed Seafood Industry Volume (Thousand Tons), by Type 2024 & 2032
- Figure 57: Middle East & Africa UAE Processed Seafood Industry Revenue Share (%), by Type 2024 & 2032
- Figure 58: Middle East & Africa UAE Processed Seafood Industry Volume Share (%), by Type 2024 & 2032
- Figure 59: Middle East & Africa UAE Processed Seafood Industry Revenue (Million), by Form 2024 & 2032
- Figure 60: Middle East & Africa UAE Processed Seafood Industry Volume (Thousand Tons), by Form 2024 & 2032
- Figure 61: Middle East & Africa UAE Processed Seafood Industry Revenue Share (%), by Form 2024 & 2032
- Figure 62: Middle East & Africa UAE Processed Seafood Industry Volume Share (%), by Form 2024 & 2032
- Figure 63: Middle East & Africa UAE Processed Seafood Industry Revenue (Million), by Distribution Channel 2024 & 2032
- Figure 64: Middle East & Africa UAE Processed Seafood Industry Volume (Thousand Tons), by Distribution Channel 2024 & 2032
- Figure 65: Middle East & Africa UAE Processed Seafood Industry Revenue Share (%), by Distribution Channel 2024 & 2032
- Figure 66: Middle East & Africa UAE Processed Seafood Industry Volume Share (%), by Distribution Channel 2024 & 2032
- Figure 67: Middle East & Africa UAE Processed Seafood Industry Revenue (Million), by Country 2024 & 2032
- Figure 68: Middle East & Africa UAE Processed Seafood Industry Volume (Thousand Tons), by Country 2024 & 2032
- Figure 69: Middle East & Africa UAE Processed Seafood Industry Revenue Share (%), by Country 2024 & 2032
- Figure 70: Middle East & Africa UAE Processed Seafood Industry Volume Share (%), by Country 2024 & 2032
- Figure 71: Asia Pacific UAE Processed Seafood Industry Revenue (Million), by Type 2024 & 2032
- Figure 72: Asia Pacific UAE Processed Seafood Industry Volume (Thousand Tons), by Type 2024 & 2032
- Figure 73: Asia Pacific UAE Processed Seafood Industry Revenue Share (%), by Type 2024 & 2032
- Figure 74: Asia Pacific UAE Processed Seafood Industry Volume Share (%), by Type 2024 & 2032
- Figure 75: Asia Pacific UAE Processed Seafood Industry Revenue (Million), by Form 2024 & 2032
- Figure 76: Asia Pacific UAE Processed Seafood Industry Volume (Thousand Tons), by Form 2024 & 2032
- Figure 77: Asia Pacific UAE Processed Seafood Industry Revenue Share (%), by Form 2024 & 2032
- Figure 78: Asia Pacific UAE Processed Seafood Industry Volume Share (%), by Form 2024 & 2032
- Figure 79: Asia Pacific UAE Processed Seafood Industry Revenue (Million), by Distribution Channel 2024 & 2032
- Figure 80: Asia Pacific UAE Processed Seafood Industry Volume (Thousand Tons), by Distribution Channel 2024 & 2032
- Figure 81: Asia Pacific UAE Processed Seafood Industry Revenue Share (%), by Distribution Channel 2024 & 2032
- Figure 82: Asia Pacific UAE Processed Seafood Industry Volume Share (%), by Distribution Channel 2024 & 2032
- Figure 83: Asia Pacific UAE Processed Seafood Industry Revenue (Million), by Country 2024 & 2032
- Figure 84: Asia Pacific UAE Processed Seafood Industry Volume (Thousand Tons), by Country 2024 & 2032
- Figure 85: Asia Pacific UAE Processed Seafood Industry Revenue Share (%), by Country 2024 & 2032
- Figure 86: Asia Pacific UAE Processed Seafood Industry Volume Share (%), by Country 2024 & 2032
List of Tables
- Table 1: Global UAE Processed Seafood Industry Revenue Million Forecast, by Region 2019 & 2032
- Table 2: Global UAE Processed Seafood Industry Volume Thousand Tons Forecast, by Region 2019 & 2032
- Table 3: Global UAE Processed Seafood Industry Revenue Million Forecast, by Type 2019 & 2032
- Table 4: Global UAE Processed Seafood Industry Volume Thousand Tons Forecast, by Type 2019 & 2032
- Table 5: Global UAE Processed Seafood Industry Revenue Million Forecast, by Form 2019 & 2032
- Table 6: Global UAE Processed Seafood Industry Volume Thousand Tons Forecast, by Form 2019 & 2032
- Table 7: Global UAE Processed Seafood Industry Revenue Million Forecast, by Distribution Channel 2019 & 2032
- Table 8: Global UAE Processed Seafood Industry Volume Thousand Tons Forecast, by Distribution Channel 2019 & 2032
- Table 9: Global UAE Processed Seafood Industry Revenue Million Forecast, by Region 2019 & 2032
- Table 10: Global UAE Processed Seafood Industry Volume Thousand Tons Forecast, by Region 2019 & 2032
- Table 11: Global UAE Processed Seafood Industry Revenue Million Forecast, by Country 2019 & 2032
- Table 12: Global UAE Processed Seafood Industry Volume Thousand Tons Forecast, by Country 2019 & 2032
- Table 13: UAE UAE Processed Seafood Industry Revenue (Million) Forecast, by Application 2019 & 2032
- Table 14: UAE UAE Processed Seafood Industry Volume (Thousand Tons) Forecast, by Application 2019 & 2032
- Table 15: South Africa UAE Processed Seafood Industry Revenue (Million) Forecast, by Application 2019 & 2032
- Table 16: South Africa UAE Processed Seafood Industry Volume (Thousand Tons) Forecast, by Application 2019 & 2032
- Table 17: Saudi Arabia UAE Processed Seafood Industry Revenue (Million) Forecast, by Application 2019 & 2032
- Table 18: Saudi Arabia UAE Processed Seafood Industry Volume (Thousand Tons) Forecast, by Application 2019 & 2032
- Table 19: Rest of MEA UAE Processed Seafood Industry Revenue (Million) Forecast, by Application 2019 & 2032
- Table 20: Rest of MEA UAE Processed Seafood Industry Volume (Thousand Tons) Forecast, by Application 2019 & 2032
- Table 21: Global UAE Processed Seafood Industry Revenue Million Forecast, by Type 2019 & 2032
- Table 22: Global UAE Processed Seafood Industry Volume Thousand Tons Forecast, by Type 2019 & 2032
- Table 23: Global UAE Processed Seafood Industry Revenue Million Forecast, by Form 2019 & 2032
- Table 24: Global UAE Processed Seafood Industry Volume Thousand Tons Forecast, by Form 2019 & 2032
- Table 25: Global UAE Processed Seafood Industry Revenue Million Forecast, by Distribution Channel 2019 & 2032
- Table 26: Global UAE Processed Seafood Industry Volume Thousand Tons Forecast, by Distribution Channel 2019 & 2032
- Table 27: Global UAE Processed Seafood Industry Revenue Million Forecast, by Country 2019 & 2032
- Table 28: Global UAE Processed Seafood Industry Volume Thousand Tons Forecast, by Country 2019 & 2032
- Table 29: United States UAE Processed Seafood Industry Revenue (Million) Forecast, by Application 2019 & 2032
- Table 30: United States UAE Processed Seafood Industry Volume (Thousand Tons) Forecast, by Application 2019 & 2032
- Table 31: Canada UAE Processed Seafood Industry Revenue (Million) Forecast, by Application 2019 & 2032
- Table 32: Canada UAE Processed Seafood Industry Volume (Thousand Tons) Forecast, by Application 2019 & 2032
- Table 33: Mexico UAE Processed Seafood Industry Revenue (Million) Forecast, by Application 2019 & 2032
- Table 34: Mexico UAE Processed Seafood Industry Volume (Thousand Tons) Forecast, by Application 2019 & 2032
- Table 35: Global UAE Processed Seafood Industry Revenue Million Forecast, by Type 2019 & 2032
- Table 36: Global UAE Processed Seafood Industry Volume Thousand Tons Forecast, by Type 2019 & 2032
- Table 37: Global UAE Processed Seafood Industry Revenue Million Forecast, by Form 2019 & 2032
- Table 38: Global UAE Processed Seafood Industry Volume Thousand Tons Forecast, by Form 2019 & 2032
- Table 39: Global UAE Processed Seafood Industry Revenue Million Forecast, by Distribution Channel 2019 & 2032
- Table 40: Global UAE Processed Seafood Industry Volume Thousand Tons Forecast, by Distribution Channel 2019 & 2032
- Table 41: Global UAE Processed Seafood Industry Revenue Million Forecast, by Country 2019 & 2032
- Table 42: Global UAE Processed Seafood Industry Volume Thousand Tons Forecast, by Country 2019 & 2032
- Table 43: Brazil UAE Processed Seafood Industry Revenue (Million) Forecast, by Application 2019 & 2032
- Table 44: Brazil UAE Processed Seafood Industry Volume (Thousand Tons) Forecast, by Application 2019 & 2032
- Table 45: Argentina UAE Processed Seafood Industry Revenue (Million) Forecast, by Application 2019 & 2032
- Table 46: Argentina UAE Processed Seafood Industry Volume (Thousand Tons) Forecast, by Application 2019 & 2032
- Table 47: Rest of South America UAE Processed Seafood Industry Revenue (Million) Forecast, by Application 2019 & 2032
- Table 48: Rest of South America UAE Processed Seafood Industry Volume (Thousand Tons) Forecast, by Application 2019 & 2032
- Table 49: Global UAE Processed Seafood Industry Revenue Million Forecast, by Type 2019 & 2032
- Table 50: Global UAE Processed Seafood Industry Volume Thousand Tons Forecast, by Type 2019 & 2032
- Table 51: Global UAE Processed Seafood Industry Revenue Million Forecast, by Form 2019 & 2032
- Table 52: Global UAE Processed Seafood Industry Volume Thousand Tons Forecast, by Form 2019 & 2032
- Table 53: Global UAE Processed Seafood Industry Revenue Million Forecast, by Distribution Channel 2019 & 2032
- Table 54: Global UAE Processed Seafood Industry Volume Thousand Tons Forecast, by Distribution Channel 2019 & 2032
- Table 55: Global UAE Processed Seafood Industry Revenue Million Forecast, by Country 2019 & 2032
- Table 56: Global UAE Processed Seafood Industry Volume Thousand Tons Forecast, by Country 2019 & 2032
- Table 57: United Kingdom UAE Processed Seafood Industry Revenue (Million) Forecast, by Application 2019 & 2032
- Table 58: United Kingdom UAE Processed Seafood Industry Volume (Thousand Tons) Forecast, by Application 2019 & 2032
- Table 59: Germany UAE Processed Seafood Industry Revenue (Million) Forecast, by Application 2019 & 2032
- Table 60: Germany UAE Processed Seafood Industry Volume (Thousand Tons) Forecast, by Application 2019 & 2032
- Table 61: France UAE Processed Seafood Industry Revenue (Million) Forecast, by Application 2019 & 2032
- Table 62: France UAE Processed Seafood Industry Volume (Thousand Tons) Forecast, by Application 2019 & 2032
- Table 63: Italy UAE Processed Seafood Industry Revenue (Million) Forecast, by Application 2019 & 2032
- Table 64: Italy UAE Processed Seafood Industry Volume (Thousand Tons) Forecast, by Application 2019 & 2032
- Table 65: Spain UAE Processed Seafood Industry Revenue (Million) Forecast, by Application 2019 & 2032
- Table 66: Spain UAE Processed Seafood Industry Volume (Thousand Tons) Forecast, by Application 2019 & 2032
- Table 67: Russia UAE Processed Seafood Industry Revenue (Million) Forecast, by Application 2019 & 2032
- Table 68: Russia UAE Processed Seafood Industry Volume (Thousand Tons) Forecast, by Application 2019 & 2032
- Table 69: Benelux UAE Processed Seafood Industry Revenue (Million) Forecast, by Application 2019 & 2032
- Table 70: Benelux UAE Processed Seafood Industry Volume (Thousand Tons) Forecast, by Application 2019 & 2032
- Table 71: Nordics UAE Processed Seafood Industry Revenue (Million) Forecast, by Application 2019 & 2032
- Table 72: Nordics UAE Processed Seafood Industry Volume (Thousand Tons) Forecast, by Application 2019 & 2032
- Table 73: Rest of Europe UAE Processed Seafood Industry Revenue (Million) Forecast, by Application 2019 & 2032
- Table 74: Rest of Europe UAE Processed Seafood Industry Volume (Thousand Tons) Forecast, by Application 2019 & 2032
- Table 75: Global UAE Processed Seafood Industry Revenue Million Forecast, by Type 2019 & 2032
- Table 76: Global UAE Processed Seafood Industry Volume Thousand Tons Forecast, by Type 2019 & 2032
- Table 77: Global UAE Processed Seafood Industry Revenue Million Forecast, by Form 2019 & 2032
- Table 78: Global UAE Processed Seafood Industry Volume Thousand Tons Forecast, by Form 2019 & 2032
- Table 79: Global UAE Processed Seafood Industry Revenue Million Forecast, by Distribution Channel 2019 & 2032
- Table 80: Global UAE Processed Seafood Industry Volume Thousand Tons Forecast, by Distribution Channel 2019 & 2032
- Table 81: Global UAE Processed Seafood Industry Revenue Million Forecast, by Country 2019 & 2032
- Table 82: Global UAE Processed Seafood Industry Volume Thousand Tons Forecast, by Country 2019 & 2032
- Table 83: Turkey UAE Processed Seafood Industry Revenue (Million) Forecast, by Application 2019 & 2032
- Table 84: Turkey UAE Processed Seafood Industry Volume (Thousand Tons) Forecast, by Application 2019 & 2032
- Table 85: Israel UAE Processed Seafood Industry Revenue (Million) Forecast, by Application 2019 & 2032
- Table 86: Israel UAE Processed Seafood Industry Volume (Thousand Tons) Forecast, by Application 2019 & 2032
- Table 87: GCC UAE Processed Seafood Industry Revenue (Million) Forecast, by Application 2019 & 2032
- Table 88: GCC UAE Processed Seafood Industry Volume (Thousand Tons) Forecast, by Application 2019 & 2032
- Table 89: North Africa UAE Processed Seafood Industry Revenue (Million) Forecast, by Application 2019 & 2032
- Table 90: North Africa UAE Processed Seafood Industry Volume (Thousand Tons) Forecast, by Application 2019 & 2032
- Table 91: South Africa UAE Processed Seafood Industry Revenue (Million) Forecast, by Application 2019 & 2032
- Table 92: South Africa UAE Processed Seafood Industry Volume (Thousand Tons) Forecast, by Application 2019 & 2032
- Table 93: Rest of Middle East & Africa UAE Processed Seafood Industry Revenue (Million) Forecast, by Application 2019 & 2032
- Table 94: Rest of Middle East & Africa UAE Processed Seafood Industry Volume (Thousand Tons) Forecast, by Application 2019 & 2032
- Table 95: Global UAE Processed Seafood Industry Revenue Million Forecast, by Type 2019 & 2032
- Table 96: Global UAE Processed Seafood Industry Volume Thousand Tons Forecast, by Type 2019 & 2032
- Table 97: Global UAE Processed Seafood Industry Revenue Million Forecast, by Form 2019 & 2032
- Table 98: Global UAE Processed Seafood Industry Volume Thousand Tons Forecast, by Form 2019 & 2032
- Table 99: Global UAE Processed Seafood Industry Revenue Million Forecast, by Distribution Channel 2019 & 2032
- Table 100: Global UAE Processed Seafood Industry Volume Thousand Tons Forecast, by Distribution Channel 2019 & 2032
- Table 101: Global UAE Processed Seafood Industry Revenue Million Forecast, by Country 2019 & 2032
- Table 102: Global UAE Processed Seafood Industry Volume Thousand Tons Forecast, by Country 2019 & 2032
- Table 103: China UAE Processed Seafood Industry Revenue (Million) Forecast, by Application 2019 & 2032
- Table 104: China UAE Processed Seafood Industry Volume (Thousand Tons) Forecast, by Application 2019 & 2032
- Table 105: India UAE Processed Seafood Industry Revenue (Million) Forecast, by Application 2019 & 2032
- Table 106: India UAE Processed Seafood Industry Volume (Thousand Tons) Forecast, by Application 2019 & 2032
- Table 107: Japan UAE Processed Seafood Industry Revenue (Million) Forecast, by Application 2019 & 2032
- Table 108: Japan UAE Processed Seafood Industry Volume (Thousand Tons) Forecast, by Application 2019 & 2032
- Table 109: South Korea UAE Processed Seafood Industry Revenue (Million) Forecast, by Application 2019 & 2032
- Table 110: South Korea UAE Processed Seafood Industry Volume (Thousand Tons) Forecast, by Application 2019 & 2032
- Table 111: ASEAN UAE Processed Seafood Industry Revenue (Million) Forecast, by Application 2019 & 2032
- Table 112: ASEAN UAE Processed Seafood Industry Volume (Thousand Tons) Forecast, by Application 2019 & 2032
- Table 113: Oceania UAE Processed Seafood Industry Revenue (Million) Forecast, by Application 2019 & 2032
- Table 114: Oceania UAE Processed Seafood Industry Volume (Thousand Tons) Forecast, by Application 2019 & 2032
- Table 115: Rest of Asia Pacific UAE Processed Seafood Industry Revenue (Million) Forecast, by Application 2019 & 2032
- Table 116: Rest of Asia Pacific UAE Processed Seafood Industry Volume (Thousand Tons) Forecast, by Application 2019 & 2032
Frequently Asked Questions
1. What is the projected Compound Annual Growth Rate (CAGR) of the UAE Processed Seafood Industry?
The projected CAGR is approximately 7.00%.
2. Which companies are prominent players in the UAE Processed Seafood Industry?
Key companies in the market include Enhance Group Holding Company Limited, Almunajem Foods, Golden Dunes General Trading LLC, Al Islami Foods, Conagra Brands Inc, The Deep Seafood Company, The Savola Grou, Tabuk Fisheries Co.
3. What are the main segments of the UAE Processed Seafood Industry?
The market segments include Type, Form, Distribution Channel.
4. Can you provide details about the market size?
The market size is estimated to be USD XX Million as of 2022.
5. What are some drivers contributing to market growth?
Consumer inclination toward functional food and beverages; Increasing Number of Applications and Growing Industrial Use.
6. What are the notable trends driving market growth?
OTHER KEY INDUSTRY TRENDS COVERED IN THE REPORT.
7. Are there any restraints impacting market growth?
Increasing Shift Toward Plant-Based Protein.
8. Can you provide examples of recent developments in the market?
February 2022: Asmak announced a strategic distribution agreement with Fish Farm, a UAE-based aquaculture company. Under this agreement, Asmak distributes fish farm products to capture a wider audience locally and regionally through its processing facility and strong distribution channels, including wholesale, foodservice, and retail.April 2021: Tabuk Fisheries along with NEOM company signed a memorandum of understanding (MoU) to expand local aquaculture production and apply the new generation of aquaculture technologies in the NEOM region. The hatchery will have a capacity of 70 million fingerlings, making it the largest in the MENA region.December 2020: Al Islami Foods sign agreement to distribute JBS/Seara brand in UAE which also includes seafood products.
9. What pricing options are available for accessing the report?
Pricing options include single-user, multi-user, and enterprise licenses priced at USD 3800, USD 4500, and USD 5800 respectively.
10. Is the market size provided in terms of value or volume?
The market size is provided in terms of value, measured in Million and volume, measured in Thousand Tons.
11. Are there any specific market keywords associated with the report?
Yes, the market keyword associated with the report is "UAE Processed Seafood Industry," which aids in identifying and referencing the specific market segment covered.
12. How do I determine which pricing option suits my needs best?
The pricing options vary based on user requirements and access needs. Individual users may opt for single-user licenses, while businesses requiring broader access may choose multi-user or enterprise licenses for cost-effective access to the report.
13. Are there any additional resources or data provided in the UAE Processed Seafood Industry report?
While the report offers comprehensive insights, it's advisable to review the specific contents or supplementary materials provided to ascertain if additional resources or data are available.
14. How can I stay updated on further developments or reports in the UAE Processed Seafood Industry?
To stay informed about further developments, trends, and reports in the UAE Processed Seafood Industry, consider subscribing to industry newsletters, following relevant companies and organizations, or regularly checking reputable industry news sources and publications.
Methodology
Step 1 - Identification of Relevant Samples Size from Population Database


Step 2 - Approaches for Defining Global Market Size (Value, Volume* & Price*)

Note*: In applicable scenarios
Step 3 - Data Sources
Primary Research
- Web Analytics
- Survey Reports
- Research Institute
- Latest Research Reports
- Opinion Leaders
Secondary Research
- Annual Reports
- White Paper
- Latest Press Release
- Industry Association
- Paid Database
- Investor Presentations

Step 4 - Data Triangulation
Involves using different sources of information in order to increase the validity of a study
These sources are likely to be stakeholders in a program - participants, other researchers, program staff, other community members, and so on.
Then we put all data in single framework & apply various statistical tools to find out the dynamic on the market.
During the analysis stage, feedback from the stakeholder groups would be compared to determine areas of agreement as well as areas of divergence
