

Key Insights
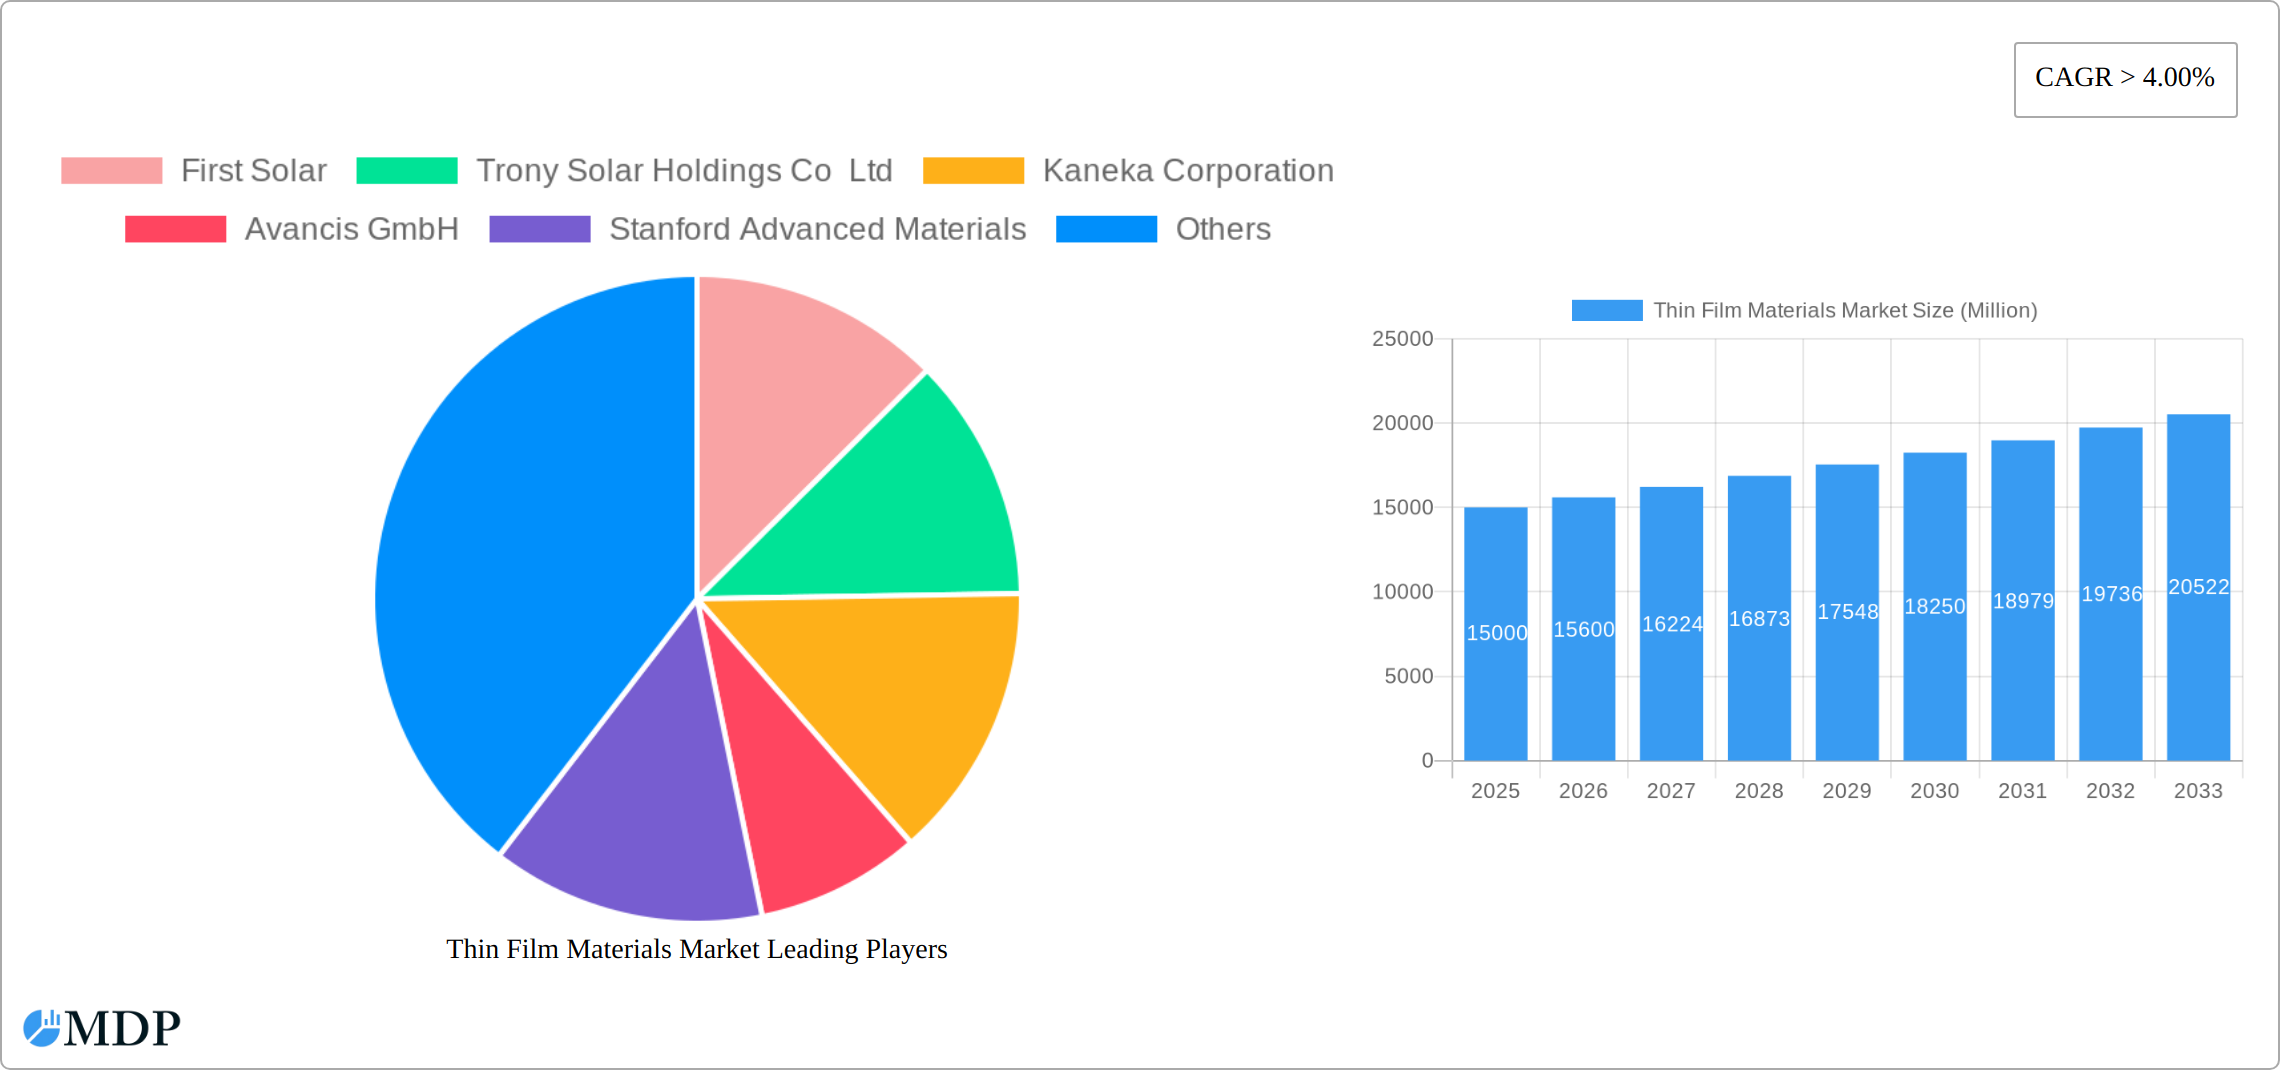
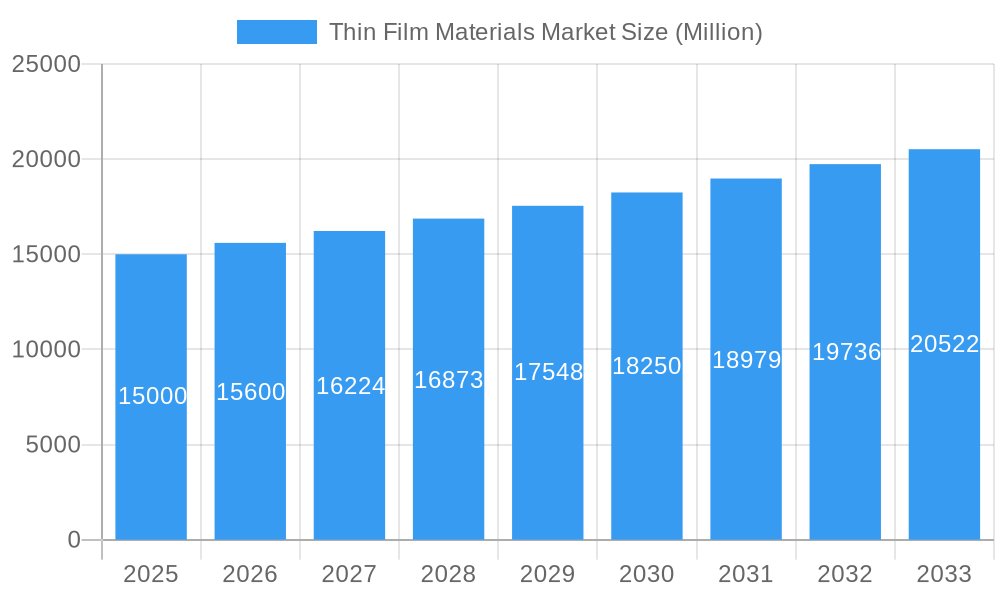
The global thin film materials market is set for substantial expansion, projected to achieve a Compound Annual Growth Rate (CAGR) of 15.71%. The market size is estimated at $7.93 billion in the base year 2025 and is expected to grow significantly through 2033. This growth is primarily fueled by the escalating demand for renewable energy, especially in solar photovoltaic (PV) applications. The increasing integration of CIGS, CdTe, and a-Si thin-film technologies in solar cells is a key driver. Advancements in thin-film technology are enhancing efficiency and cost-effectiveness, positioning them as competitive alternatives to traditional silicon-based solar cells. Government incentives for renewable energy adoption and growing environmental consciousness further stimulate market growth. While challenges like material availability and production complexities exist, the overall outlook remains positive. The Asia Pacific region, in particular, is anticipated to lead growth due to significant investments in renewable energy infrastructure and large-scale solar projects. Emerging applications in semiconductors and microelectromechanical systems (MEMS) also present promising growth opportunities.
Thin Film Materials Market Market Size (In Billion)
Key market participants include established leaders and innovative emerging companies focused on technological advancements. Market share distribution is shifting globally, with Asia Pacific projected to increase its dominance due to substantial renewable energy investments and favorable government policies. North America and Europe will retain significant presence, while South America and the Middle East & Africa are expected to experience moderate growth driven by solar energy infrastructure development and economic progress. Continued investment in research and development, coupled with strategic collaborations and mergers, will shape the future market landscape. The forecast period anticipates broader adoption of advanced thin-film technologies and increased integration across diverse applications, driving higher market value.
Thin Film Materials Market Company Market Share
Deep Dive into the Thriving Thin Film Materials Market: A Comprehensive Report (2019-2033)
This comprehensive report provides an in-depth analysis of the Thin Film Materials market, offering invaluable insights for stakeholders across the value chain. With a study period spanning 2019-2033, a base year of 2025, and a forecast period of 2025-2033, this report meticulously examines market dynamics, trends, and future potential. The report leverages extensive data analysis to project a xx Million market value by 2033, revealing lucrative opportunities and potential challenges within this rapidly evolving sector. Key segments analyzed include Copper Indium Gallium Selenide (CIGS), Cadmium Telluride (CdTe), Amorphous Silicon (a-Si), and other types, across applications in Photovoltaic (PV) Cells, Semiconductors, Microelectromechanical systems, and other sectors. Leading players like First Solar, Trony Solar Holdings Co Ltd, and Kaneka Corporation are profiled, providing a competitive landscape overview.
Thin Film Materials Market Market Dynamics & Concentration
The Thin Film Materials market exhibits a moderately concentrated landscape, with a few major players holding significant market share. The market share of the top 5 players is estimated to be xx% in 2025. Innovation is a key driver, with ongoing R&D efforts focused on improving efficiency, reducing costs, and expanding applications. Stringent environmental regulations are also shaping market growth, pushing the adoption of sustainable energy solutions. The emergence of substitute materials poses a challenge, particularly from crystalline silicon technologies, but the unique advantages of thin-film materials in flexibility and cost-effectiveness maintain their competitiveness. End-user demand is steadily growing, particularly in the photovoltaic (PV) sector driven by increasing renewable energy adoption. M&A activity has been relatively moderate in recent years, with approximately xx deals recorded between 2019 and 2024.
- Market Concentration: Top 5 players hold xx% market share (2025).
- Innovation Drivers: Efficiency improvements, cost reductions, and application diversification.
- Regulatory Framework: Stringent environmental regulations promoting renewable energy.
- Product Substitutes: Crystalline silicon technologies pose a competitive threat.
- End-User Trends: Growing demand from the PV and electronics sectors.
- M&A Activity: Approximately xx deals between 2019 and 2024.
Thin Film Materials Market Industry Trends & Analysis
The Thin Film Materials market is experiencing robust growth, driven by the increasing demand for flexible and cost-effective solar cells. Technological advancements, such as improved deposition techniques and material compositions, are enhancing efficiency and performance. Consumer preferences are shifting towards sustainable and environmentally friendly products, further boosting market adoption. The competitive landscape is dynamic, with companies constantly striving to improve their product offerings and expand their market reach. The market is projected to achieve a CAGR of xx% during the forecast period (2025-2033). Market penetration in the PV sector is expected to reach xx% by 2033, reflecting the growing preference for thin-film solar technology. Further growth will depend on continued innovation, favorable government policies, and decreasing production costs.
Leading Markets & Segments in Thin Film Materials Market
The global Thin Film Materials market is experiencing dynamic growth, with the Asia-Pacific region asserting its dominance. This leadership is fueled by robust economic expansion, favorable government initiatives supporting green energy, and large-scale renewable energy projects, particularly in solar power. China stands out as a pivotal market, driven by its extensive investments in solar energy infrastructure. Across various material types, Cadmium Telluride (CdTe) commands the largest market share, a testament to its compelling blend of high efficiency and cost-effectiveness. In terms of application, Photovoltaic (PV) cells remain the most significant segment, contributing a substantial portion to the overall market revenue, reflecting the accelerating global adoption of solar energy.
- Key Drivers in Asia-Pacific:
- Massive investments in renewable energy infrastructure, especially solar power.
- Proactive government policies, tax incentives, and subsidies promoting thin-film adoption.
- Sustained economic growth leading to increased energy demand and a shift towards cleaner energy sources.
- Advancements in manufacturing technologies leading to improved cost competitiveness.
- Dominant Segment (Type): Cadmium Telluride (CdTe) continues to lead due to its superior energy conversion efficiency and attractive cost-performance ratio compared to other thin-film technologies.
- Dominant Segment (Application): Photovoltaic (PV) cells are the primary application, driven by the widespread global push for solar energy as a sustainable and renewable power source.
Thin Film Materials Market Product Developments
Innovation in the thin-film materials sector is intensely focused on pushing the boundaries of both efficiency and durability. Manufacturers are actively pursuing novel material compositions, refining sophisticated deposition techniques (such as sputtering, evaporation, and chemical vapor deposition), and integrating advanced functionalities to create next-generation materials. The resulting improvements in performance, coupled with enhanced flexibility and lighter weight, are significantly broadening the application spectrum beyond conventional PV panels. These advanced materials are finding new homes in flexible electronics, wearable devices, smart sensors, transparent displays, and specialized optoelectronic components. This continuous wave of innovation is intensifying competition, compelling manufacturers to develop bespoke products that precisely meet the evolving and diverse demands of these emerging application areas.
Key Drivers of Thin Film Materials Market Growth
The Thin Film Materials market is fueled by several key factors: the increasing demand for renewable energy sources, leading to a surge in PV cell production; continuous technological advancements, resulting in improved efficiency and reduced costs; supportive government policies and subsidies promoting the adoption of clean energy technologies; and the growing demand for flexible and lightweight electronic devices, creating new application opportunities. The cost-effectiveness of thin-film materials compared to traditional crystalline silicon offers a compelling advantage.
Challenges in the Thin Film Materials Market Market
Several factors hinder the growth of the Thin Film Materials market. The relatively lower efficiency compared to crystalline silicon technologies remains a challenge. Supply chain disruptions and fluctuations in raw material prices can significantly impact production costs and profitability. Intense competition among manufacturers necessitates continuous innovation to stay ahead.
Emerging Opportunities in Thin Film Materials Market
The future of the Thin Film Materials market is bright with opportunities, particularly in the development of highly efficient, stable, and cost-effective thin-film solar cells. These advancements promise to unlock significant market expansion potential. Fostering strategic partnerships and collaborations between material manufacturers, research institutions, and end-users is creating new and lucrative avenues for market penetration and application development. The exploration and commercialization of novel applications in the burgeoning fields of flexible electronics, Internet of Things (IoT) devices, and advanced sensors offer considerable untapped growth potential. Moreover, expanding into new and rapidly developing geographical markets, especially those in developing economies experiencing escalating energy demands, presents further substantial opportunities for market players.
Leading Players in the Thin Film Materials Market Sector
- First Solar
- Trony Solar Holdings Co Ltd
- Kaneka Corporation
- Avancis GmbH
- Stanford Advanced Materials
- Cicor Management AG
- Solar Frontier Kabushiki Kaisha
- Ascent Solar Technologies Inc
- Hanergy Thin Film Power Group Europe
- Moser Baer India Limited
Key Milestones in Thin Film Materials Market Industry
- 2020: Significant advancements in CIGS thin-film technology leading to increased efficiency rates.
- 2022: Launch of several new flexible solar cell products by major manufacturers.
- 2023: Announced merger between two key players expanding market consolidation.
- 2024: Introduction of government incentives specifically targeting thin-film solar adoption.
Strategic Outlook for Thin Film Materials Market Market
The Thin Film Materials market holds substantial future potential, driven by ongoing technological advancements, expanding applications, and supportive government policies. Strategic collaborations and investments in R&D are crucial for maintaining competitiveness and capitalizing on emerging opportunities. Expansion into new markets and diversifying product portfolios will be key factors in achieving long-term sustainable growth. Companies focusing on innovation and cost optimization are well-positioned to succeed in this dynamic market.
Thin Film Materials Market Segmentation
-
1. Type
- 1.1. Copper Indium Gallium Selenide (CIGS)
- 1.2. Cadmium Telluride (CdTe)
- 1.3. Amorphous Silicon (a-Si)
- 1.4. Other Types
-
2. Application
- 2.1. Photo voltaic (PV) Cells
- 2.2. Semiconductors
- 2.3. Microelectromechanical systems
- 2.4. Other Applications
Thin Film Materials Market Segmentation By Geography
-
1. Asia Pacific
- 1.1. China
- 1.2. India
- 1.3. Japan
- 1.4. South Korea
- 1.5. Rest of Asia Pacific
-
2. North America
- 2.1. United States
- 2.2. Canada
- 2.3. Mexico
-
3. Europe
- 3.1. Germany
- 3.2. United Kingdom
- 3.3. Italy
- 3.4. France
- 3.5. Spain
- 3.6. Rest of Europe
-
4. South America
- 4.1. Brazil
- 4.2. Aregentina
- 4.3. Rest of South America
-
5. Middle East and Africa
- 5.1. United Arab Emirates
- 5.2. Saudi Arabia
- 5.3. South Africa
- 5.4. Rest of Middle East and Africa
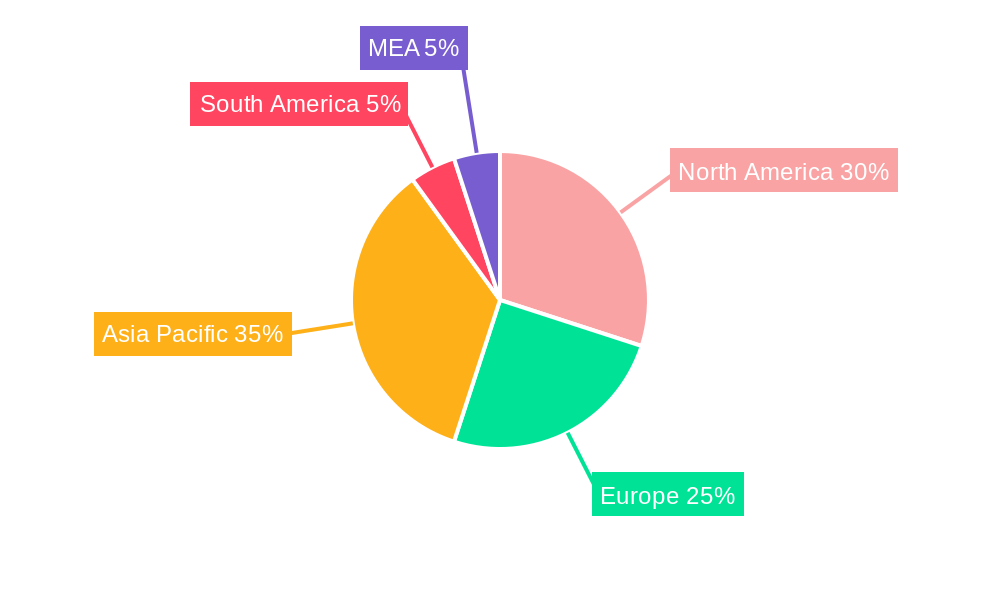
Thin Film Materials Market Regional Market Share
Geographic Coverage of Thin Film Materials Market
Thin Film Materials Market REPORT HIGHLIGHTS
| Aspects | Details |
|---|---|
| Study Period | 2020-2034 |
| Base Year | 2025 |
| Estimated Year | 2026 |
| Forecast Period | 2026-2034 |
| Historical Period | 2020-2025 |
| Growth Rate | CAGR of 4.2% from 2020-2034 |
| Segmentation |
|
Table of Contents
- 1. Introduction
- 1.1. Research Scope
- 1.2. Market Segmentation
- 1.3. Research Methodology
- 1.4. Definitions and Assumptions
- 2. Executive Summary
- 2.1. Introduction
- 3. Market Dynamics
- 3.1. Introduction
- 3.2. Market Drivers
- 3.2.1. ; Growing Demand for Photo voltaic (PV) Cells; Increasing Application in Electronic Components
- 3.3. Market Restrains
- 3.3.1. ; Availability of Close Substitutes; Other Restraints
- 3.4. Market Trends
- 3.4.1. Growing Demand for Photo voltaic Cells
- 4. Market Factor Analysis
- 4.1. Porters Five Forces
- 4.2. Supply/Value Chain
- 4.3. PESTEL analysis
- 4.4. Market Entropy
- 4.5. Patent/Trademark Analysis
- 5. Global Thin Film Materials Market Analysis, Insights and Forecast, 2020-2032
- 5.1. Market Analysis, Insights and Forecast - by Type
- 5.1.1. Copper Indium Gallium Selenide (CIGS)
- 5.1.2. Cadmium Telluride (CdTe)
- 5.1.3. Amorphous Silicon (a-Si)
- 5.1.4. Other Types
- 5.2. Market Analysis, Insights and Forecast - by Application
- 5.2.1. Photo voltaic (PV) Cells
- 5.2.2. Semiconductors
- 5.2.3. Microelectromechanical systems
- 5.2.4. Other Applications
- 5.3. Market Analysis, Insights and Forecast - by Region
- 5.3.1. Asia Pacific
- 5.3.2. North America
- 5.3.3. Europe
- 5.3.4. South America
- 5.3.5. Middle East and Africa
- 5.1. Market Analysis, Insights and Forecast - by Type
- 6. Asia Pacific Thin Film Materials Market Analysis, Insights and Forecast, 2020-2032
- 6.1. Market Analysis, Insights and Forecast - by Type
- 6.1.1. Copper Indium Gallium Selenide (CIGS)
- 6.1.2. Cadmium Telluride (CdTe)
- 6.1.3. Amorphous Silicon (a-Si)
- 6.1.4. Other Types
- 6.2. Market Analysis, Insights and Forecast - by Application
- 6.2.1. Photo voltaic (PV) Cells
- 6.2.2. Semiconductors
- 6.2.3. Microelectromechanical systems
- 6.2.4. Other Applications
- 6.1. Market Analysis, Insights and Forecast - by Type
- 7. North America Thin Film Materials Market Analysis, Insights and Forecast, 2020-2032
- 7.1. Market Analysis, Insights and Forecast - by Type
- 7.1.1. Copper Indium Gallium Selenide (CIGS)
- 7.1.2. Cadmium Telluride (CdTe)
- 7.1.3. Amorphous Silicon (a-Si)
- 7.1.4. Other Types
- 7.2. Market Analysis, Insights and Forecast - by Application
- 7.2.1. Photo voltaic (PV) Cells
- 7.2.2. Semiconductors
- 7.2.3. Microelectromechanical systems
- 7.2.4. Other Applications
- 7.1. Market Analysis, Insights and Forecast - by Type
- 8. Europe Thin Film Materials Market Analysis, Insights and Forecast, 2020-2032
- 8.1. Market Analysis, Insights and Forecast - by Type
- 8.1.1. Copper Indium Gallium Selenide (CIGS)
- 8.1.2. Cadmium Telluride (CdTe)
- 8.1.3. Amorphous Silicon (a-Si)
- 8.1.4. Other Types
- 8.2. Market Analysis, Insights and Forecast - by Application
- 8.2.1. Photo voltaic (PV) Cells
- 8.2.2. Semiconductors
- 8.2.3. Microelectromechanical systems
- 8.2.4. Other Applications
- 8.1. Market Analysis, Insights and Forecast - by Type
- 9. South America Thin Film Materials Market Analysis, Insights and Forecast, 2020-2032
- 9.1. Market Analysis, Insights and Forecast - by Type
- 9.1.1. Copper Indium Gallium Selenide (CIGS)
- 9.1.2. Cadmium Telluride (CdTe)
- 9.1.3. Amorphous Silicon (a-Si)
- 9.1.4. Other Types
- 9.2. Market Analysis, Insights and Forecast - by Application
- 9.2.1. Photo voltaic (PV) Cells
- 9.2.2. Semiconductors
- 9.2.3. Microelectromechanical systems
- 9.2.4. Other Applications
- 9.1. Market Analysis, Insights and Forecast - by Type
- 10. Middle East and Africa Thin Film Materials Market Analysis, Insights and Forecast, 2020-2032
- 10.1. Market Analysis, Insights and Forecast - by Type
- 10.1.1. Copper Indium Gallium Selenide (CIGS)
- 10.1.2. Cadmium Telluride (CdTe)
- 10.1.3. Amorphous Silicon (a-Si)
- 10.1.4. Other Types
- 10.2. Market Analysis, Insights and Forecast - by Application
- 10.2.1. Photo voltaic (PV) Cells
- 10.2.2. Semiconductors
- 10.2.3. Microelectromechanical systems
- 10.2.4. Other Applications
- 10.1. Market Analysis, Insights and Forecast - by Type
- 11. Competitive Analysis
- 11.1. Global Market Share Analysis 2025
- 11.2. Company Profiles
- 11.2.1 First Solar
- 11.2.1.1. Overview
- 11.2.1.2. Products
- 11.2.1.3. SWOT Analysis
- 11.2.1.4. Recent Developments
- 11.2.1.5. Financials (Based on Availability)
- 11.2.2 Trony Solar Holdings Co Ltd
- 11.2.2.1. Overview
- 11.2.2.2. Products
- 11.2.2.3. SWOT Analysis
- 11.2.2.4. Recent Developments
- 11.2.2.5. Financials (Based on Availability)
- 11.2.3 Kaneka Corporation
- 11.2.3.1. Overview
- 11.2.3.2. Products
- 11.2.3.3. SWOT Analysis
- 11.2.3.4. Recent Developments
- 11.2.3.5. Financials (Based on Availability)
- 11.2.4 Avancis GmbH
- 11.2.4.1. Overview
- 11.2.4.2. Products
- 11.2.4.3. SWOT Analysis
- 11.2.4.4. Recent Developments
- 11.2.4.5. Financials (Based on Availability)
- 11.2.5 Stanford Advanced Materials
- 11.2.5.1. Overview
- 11.2.5.2. Products
- 11.2.5.3. SWOT Analysis
- 11.2.5.4. Recent Developments
- 11.2.5.5. Financials (Based on Availability)
- 11.2.6 Cicor Management AG
- 11.2.6.1. Overview
- 11.2.6.2. Products
- 11.2.6.3. SWOT Analysis
- 11.2.6.4. Recent Developments
- 11.2.6.5. Financials (Based on Availability)
- 11.2.7 Solar Frontier Kabushiki Kaisha
- 11.2.7.1. Overview
- 11.2.7.2. Products
- 11.2.7.3. SWOT Analysis
- 11.2.7.4. Recent Developments
- 11.2.7.5. Financials (Based on Availability)
- 11.2.8 Ascent Solar Technologies Inc
- 11.2.8.1. Overview
- 11.2.8.2. Products
- 11.2.8.3. SWOT Analysis
- 11.2.8.4. Recent Developments
- 11.2.8.5. Financials (Based on Availability)
- 11.2.9 Hanergy Thin Film Power Group Europe
- 11.2.9.1. Overview
- 11.2.9.2. Products
- 11.2.9.3. SWOT Analysis
- 11.2.9.4. Recent Developments
- 11.2.9.5. Financials (Based on Availability)
- 11.2.10 Moser Baer India Limited
- 11.2.10.1. Overview
- 11.2.10.2. Products
- 11.2.10.3. SWOT Analysis
- 11.2.10.4. Recent Developments
- 11.2.10.5. Financials (Based on Availability)
- 11.2.1 First Solar
List of Figures
- Figure 1: Global Thin Film Materials Market Revenue Breakdown (undefined, %) by Region 2025 & 2033
- Figure 2: Global Thin Film Materials Market Volume Breakdown (K Tons, %) by Region 2025 & 2033
- Figure 3: Asia Pacific Thin Film Materials Market Revenue (undefined), by Type 2025 & 2033
- Figure 4: Asia Pacific Thin Film Materials Market Volume (K Tons), by Type 2025 & 2033
- Figure 5: Asia Pacific Thin Film Materials Market Revenue Share (%), by Type 2025 & 2033
- Figure 6: Asia Pacific Thin Film Materials Market Volume Share (%), by Type 2025 & 2033
- Figure 7: Asia Pacific Thin Film Materials Market Revenue (undefined), by Application 2025 & 2033
- Figure 8: Asia Pacific Thin Film Materials Market Volume (K Tons), by Application 2025 & 2033
- Figure 9: Asia Pacific Thin Film Materials Market Revenue Share (%), by Application 2025 & 2033
- Figure 10: Asia Pacific Thin Film Materials Market Volume Share (%), by Application 2025 & 2033
- Figure 11: Asia Pacific Thin Film Materials Market Revenue (undefined), by Country 2025 & 2033
- Figure 12: Asia Pacific Thin Film Materials Market Volume (K Tons), by Country 2025 & 2033
- Figure 13: Asia Pacific Thin Film Materials Market Revenue Share (%), by Country 2025 & 2033
- Figure 14: Asia Pacific Thin Film Materials Market Volume Share (%), by Country 2025 & 2033
- Figure 15: North America Thin Film Materials Market Revenue (undefined), by Type 2025 & 2033
- Figure 16: North America Thin Film Materials Market Volume (K Tons), by Type 2025 & 2033
- Figure 17: North America Thin Film Materials Market Revenue Share (%), by Type 2025 & 2033
- Figure 18: North America Thin Film Materials Market Volume Share (%), by Type 2025 & 2033
- Figure 19: North America Thin Film Materials Market Revenue (undefined), by Application 2025 & 2033
- Figure 20: North America Thin Film Materials Market Volume (K Tons), by Application 2025 & 2033
- Figure 21: North America Thin Film Materials Market Revenue Share (%), by Application 2025 & 2033
- Figure 22: North America Thin Film Materials Market Volume Share (%), by Application 2025 & 2033
- Figure 23: North America Thin Film Materials Market Revenue (undefined), by Country 2025 & 2033
- Figure 24: North America Thin Film Materials Market Volume (K Tons), by Country 2025 & 2033
- Figure 25: North America Thin Film Materials Market Revenue Share (%), by Country 2025 & 2033
- Figure 26: North America Thin Film Materials Market Volume Share (%), by Country 2025 & 2033
- Figure 27: Europe Thin Film Materials Market Revenue (undefined), by Type 2025 & 2033
- Figure 28: Europe Thin Film Materials Market Volume (K Tons), by Type 2025 & 2033
- Figure 29: Europe Thin Film Materials Market Revenue Share (%), by Type 2025 & 2033
- Figure 30: Europe Thin Film Materials Market Volume Share (%), by Type 2025 & 2033
- Figure 31: Europe Thin Film Materials Market Revenue (undefined), by Application 2025 & 2033
- Figure 32: Europe Thin Film Materials Market Volume (K Tons), by Application 2025 & 2033
- Figure 33: Europe Thin Film Materials Market Revenue Share (%), by Application 2025 & 2033
- Figure 34: Europe Thin Film Materials Market Volume Share (%), by Application 2025 & 2033
- Figure 35: Europe Thin Film Materials Market Revenue (undefined), by Country 2025 & 2033
- Figure 36: Europe Thin Film Materials Market Volume (K Tons), by Country 2025 & 2033
- Figure 37: Europe Thin Film Materials Market Revenue Share (%), by Country 2025 & 2033
- Figure 38: Europe Thin Film Materials Market Volume Share (%), by Country 2025 & 2033
- Figure 39: South America Thin Film Materials Market Revenue (undefined), by Type 2025 & 2033
- Figure 40: South America Thin Film Materials Market Volume (K Tons), by Type 2025 & 2033
- Figure 41: South America Thin Film Materials Market Revenue Share (%), by Type 2025 & 2033
- Figure 42: South America Thin Film Materials Market Volume Share (%), by Type 2025 & 2033
- Figure 43: South America Thin Film Materials Market Revenue (undefined), by Application 2025 & 2033
- Figure 44: South America Thin Film Materials Market Volume (K Tons), by Application 2025 & 2033
- Figure 45: South America Thin Film Materials Market Revenue Share (%), by Application 2025 & 2033
- Figure 46: South America Thin Film Materials Market Volume Share (%), by Application 2025 & 2033
- Figure 47: South America Thin Film Materials Market Revenue (undefined), by Country 2025 & 2033
- Figure 48: South America Thin Film Materials Market Volume (K Tons), by Country 2025 & 2033
- Figure 49: South America Thin Film Materials Market Revenue Share (%), by Country 2025 & 2033
- Figure 50: South America Thin Film Materials Market Volume Share (%), by Country 2025 & 2033
- Figure 51: Middle East and Africa Thin Film Materials Market Revenue (undefined), by Type 2025 & 2033
- Figure 52: Middle East and Africa Thin Film Materials Market Volume (K Tons), by Type 2025 & 2033
- Figure 53: Middle East and Africa Thin Film Materials Market Revenue Share (%), by Type 2025 & 2033
- Figure 54: Middle East and Africa Thin Film Materials Market Volume Share (%), by Type 2025 & 2033
- Figure 55: Middle East and Africa Thin Film Materials Market Revenue (undefined), by Application 2025 & 2033
- Figure 56: Middle East and Africa Thin Film Materials Market Volume (K Tons), by Application 2025 & 2033
- Figure 57: Middle East and Africa Thin Film Materials Market Revenue Share (%), by Application 2025 & 2033
- Figure 58: Middle East and Africa Thin Film Materials Market Volume Share (%), by Application 2025 & 2033
- Figure 59: Middle East and Africa Thin Film Materials Market Revenue (undefined), by Country 2025 & 2033
- Figure 60: Middle East and Africa Thin Film Materials Market Volume (K Tons), by Country 2025 & 2033
- Figure 61: Middle East and Africa Thin Film Materials Market Revenue Share (%), by Country 2025 & 2033
- Figure 62: Middle East and Africa Thin Film Materials Market Volume Share (%), by Country 2025 & 2033
List of Tables
- Table 1: Global Thin Film Materials Market Revenue undefined Forecast, by Type 2020 & 2033
- Table 2: Global Thin Film Materials Market Volume K Tons Forecast, by Type 2020 & 2033
- Table 3: Global Thin Film Materials Market Revenue undefined Forecast, by Application 2020 & 2033
- Table 4: Global Thin Film Materials Market Volume K Tons Forecast, by Application 2020 & 2033
- Table 5: Global Thin Film Materials Market Revenue undefined Forecast, by Region 2020 & 2033
- Table 6: Global Thin Film Materials Market Volume K Tons Forecast, by Region 2020 & 2033
- Table 7: Global Thin Film Materials Market Revenue undefined Forecast, by Type 2020 & 2033
- Table 8: Global Thin Film Materials Market Volume K Tons Forecast, by Type 2020 & 2033
- Table 9: Global Thin Film Materials Market Revenue undefined Forecast, by Application 2020 & 2033
- Table 10: Global Thin Film Materials Market Volume K Tons Forecast, by Application 2020 & 2033
- Table 11: Global Thin Film Materials Market Revenue undefined Forecast, by Country 2020 & 2033
- Table 12: Global Thin Film Materials Market Volume K Tons Forecast, by Country 2020 & 2033
- Table 13: China Thin Film Materials Market Revenue (undefined) Forecast, by Application 2020 & 2033
- Table 14: China Thin Film Materials Market Volume (K Tons) Forecast, by Application 2020 & 2033
- Table 15: India Thin Film Materials Market Revenue (undefined) Forecast, by Application 2020 & 2033
- Table 16: India Thin Film Materials Market Volume (K Tons) Forecast, by Application 2020 & 2033
- Table 17: Japan Thin Film Materials Market Revenue (undefined) Forecast, by Application 2020 & 2033
- Table 18: Japan Thin Film Materials Market Volume (K Tons) Forecast, by Application 2020 & 2033
- Table 19: South Korea Thin Film Materials Market Revenue (undefined) Forecast, by Application 2020 & 2033
- Table 20: South Korea Thin Film Materials Market Volume (K Tons) Forecast, by Application 2020 & 2033
- Table 21: Rest of Asia Pacific Thin Film Materials Market Revenue (undefined) Forecast, by Application 2020 & 2033
- Table 22: Rest of Asia Pacific Thin Film Materials Market Volume (K Tons) Forecast, by Application 2020 & 2033
- Table 23: Global Thin Film Materials Market Revenue undefined Forecast, by Type 2020 & 2033
- Table 24: Global Thin Film Materials Market Volume K Tons Forecast, by Type 2020 & 2033
- Table 25: Global Thin Film Materials Market Revenue undefined Forecast, by Application 2020 & 2033
- Table 26: Global Thin Film Materials Market Volume K Tons Forecast, by Application 2020 & 2033
- Table 27: Global Thin Film Materials Market Revenue undefined Forecast, by Country 2020 & 2033
- Table 28: Global Thin Film Materials Market Volume K Tons Forecast, by Country 2020 & 2033
- Table 29: United States Thin Film Materials Market Revenue (undefined) Forecast, by Application 2020 & 2033
- Table 30: United States Thin Film Materials Market Volume (K Tons) Forecast, by Application 2020 & 2033
- Table 31: Canada Thin Film Materials Market Revenue (undefined) Forecast, by Application 2020 & 2033
- Table 32: Canada Thin Film Materials Market Volume (K Tons) Forecast, by Application 2020 & 2033
- Table 33: Mexico Thin Film Materials Market Revenue (undefined) Forecast, by Application 2020 & 2033
- Table 34: Mexico Thin Film Materials Market Volume (K Tons) Forecast, by Application 2020 & 2033
- Table 35: Global Thin Film Materials Market Revenue undefined Forecast, by Type 2020 & 2033
- Table 36: Global Thin Film Materials Market Volume K Tons Forecast, by Type 2020 & 2033
- Table 37: Global Thin Film Materials Market Revenue undefined Forecast, by Application 2020 & 2033
- Table 38: Global Thin Film Materials Market Volume K Tons Forecast, by Application 2020 & 2033
- Table 39: Global Thin Film Materials Market Revenue undefined Forecast, by Country 2020 & 2033
- Table 40: Global Thin Film Materials Market Volume K Tons Forecast, by Country 2020 & 2033
- Table 41: Germany Thin Film Materials Market Revenue (undefined) Forecast, by Application 2020 & 2033
- Table 42: Germany Thin Film Materials Market Volume (K Tons) Forecast, by Application 2020 & 2033
- Table 43: United Kingdom Thin Film Materials Market Revenue (undefined) Forecast, by Application 2020 & 2033
- Table 44: United Kingdom Thin Film Materials Market Volume (K Tons) Forecast, by Application 2020 & 2033
- Table 45: Italy Thin Film Materials Market Revenue (undefined) Forecast, by Application 2020 & 2033
- Table 46: Italy Thin Film Materials Market Volume (K Tons) Forecast, by Application 2020 & 2033
- Table 47: France Thin Film Materials Market Revenue (undefined) Forecast, by Application 2020 & 2033
- Table 48: France Thin Film Materials Market Volume (K Tons) Forecast, by Application 2020 & 2033
- Table 49: Spain Thin Film Materials Market Revenue (undefined) Forecast, by Application 2020 & 2033
- Table 50: Spain Thin Film Materials Market Volume (K Tons) Forecast, by Application 2020 & 2033
- Table 51: Rest of Europe Thin Film Materials Market Revenue (undefined) Forecast, by Application 2020 & 2033
- Table 52: Rest of Europe Thin Film Materials Market Volume (K Tons) Forecast, by Application 2020 & 2033
- Table 53: Global Thin Film Materials Market Revenue undefined Forecast, by Type 2020 & 2033
- Table 54: Global Thin Film Materials Market Volume K Tons Forecast, by Type 2020 & 2033
- Table 55: Global Thin Film Materials Market Revenue undefined Forecast, by Application 2020 & 2033
- Table 56: Global Thin Film Materials Market Volume K Tons Forecast, by Application 2020 & 2033
- Table 57: Global Thin Film Materials Market Revenue undefined Forecast, by Country 2020 & 2033
- Table 58: Global Thin Film Materials Market Volume K Tons Forecast, by Country 2020 & 2033
- Table 59: Brazil Thin Film Materials Market Revenue (undefined) Forecast, by Application 2020 & 2033
- Table 60: Brazil Thin Film Materials Market Volume (K Tons) Forecast, by Application 2020 & 2033
- Table 61: Aregentina Thin Film Materials Market Revenue (undefined) Forecast, by Application 2020 & 2033
- Table 62: Aregentina Thin Film Materials Market Volume (K Tons) Forecast, by Application 2020 & 2033
- Table 63: Rest of South America Thin Film Materials Market Revenue (undefined) Forecast, by Application 2020 & 2033
- Table 64: Rest of South America Thin Film Materials Market Volume (K Tons) Forecast, by Application 2020 & 2033
- Table 65: Global Thin Film Materials Market Revenue undefined Forecast, by Type 2020 & 2033
- Table 66: Global Thin Film Materials Market Volume K Tons Forecast, by Type 2020 & 2033
- Table 67: Global Thin Film Materials Market Revenue undefined Forecast, by Application 2020 & 2033
- Table 68: Global Thin Film Materials Market Volume K Tons Forecast, by Application 2020 & 2033
- Table 69: Global Thin Film Materials Market Revenue undefined Forecast, by Country 2020 & 2033
- Table 70: Global Thin Film Materials Market Volume K Tons Forecast, by Country 2020 & 2033
- Table 71: United Arab Emirates Thin Film Materials Market Revenue (undefined) Forecast, by Application 2020 & 2033
- Table 72: United Arab Emirates Thin Film Materials Market Volume (K Tons) Forecast, by Application 2020 & 2033
- Table 73: Saudi Arabia Thin Film Materials Market Revenue (undefined) Forecast, by Application 2020 & 2033
- Table 74: Saudi Arabia Thin Film Materials Market Volume (K Tons) Forecast, by Application 2020 & 2033
- Table 75: South Africa Thin Film Materials Market Revenue (undefined) Forecast, by Application 2020 & 2033
- Table 76: South Africa Thin Film Materials Market Volume (K Tons) Forecast, by Application 2020 & 2033
- Table 77: Rest of Middle East and Africa Thin Film Materials Market Revenue (undefined) Forecast, by Application 2020 & 2033
- Table 78: Rest of Middle East and Africa Thin Film Materials Market Volume (K Tons) Forecast, by Application 2020 & 2033
Frequently Asked Questions
1. What is the projected Compound Annual Growth Rate (CAGR) of the Thin Film Materials Market?
The projected CAGR is approximately 4.2%.
2. Which companies are prominent players in the Thin Film Materials Market?
Key companies in the market include First Solar, Trony Solar Holdings Co Ltd, Kaneka Corporation, Avancis GmbH, Stanford Advanced Materials, Cicor Management AG, Solar Frontier Kabushiki Kaisha, Ascent Solar Technologies Inc, Hanergy Thin Film Power Group Europe, Moser Baer India Limited.
3. What are the main segments of the Thin Film Materials Market?
The market segments include Type, Application.
4. Can you provide details about the market size?
The market size is estimated to be USD XXX N/A as of 2022.
5. What are some drivers contributing to market growth?
; Growing Demand for Photo voltaic (PV) Cells; Increasing Application in Electronic Components.
6. What are the notable trends driving market growth?
Growing Demand for Photo voltaic Cells.
7. Are there any restraints impacting market growth?
; Availability of Close Substitutes; Other Restraints.
8. Can you provide examples of recent developments in the market?
N/A
9. What pricing options are available for accessing the report?
Pricing options include single-user, multi-user, and enterprise licenses priced at USD 4750, USD 5250, and USD 8750 respectively.
10. Is the market size provided in terms of value or volume?
The market size is provided in terms of value, measured in N/A and volume, measured in K Tons.
11. Are there any specific market keywords associated with the report?
Yes, the market keyword associated with the report is "Thin Film Materials Market," which aids in identifying and referencing the specific market segment covered.
12. How do I determine which pricing option suits my needs best?
The pricing options vary based on user requirements and access needs. Individual users may opt for single-user licenses, while businesses requiring broader access may choose multi-user or enterprise licenses for cost-effective access to the report.
13. Are there any additional resources or data provided in the Thin Film Materials Market report?
While the report offers comprehensive insights, it's advisable to review the specific contents or supplementary materials provided to ascertain if additional resources or data are available.
14. How can I stay updated on further developments or reports in the Thin Film Materials Market?
To stay informed about further developments, trends, and reports in the Thin Film Materials Market, consider subscribing to industry newsletters, following relevant companies and organizations, or regularly checking reputable industry news sources and publications.
Methodology
Step 1 - Identification of Relevant Samples Size from Population Database


Step 2 - Approaches for Defining Global Market Size (Value, Volume* & Price*)

Note*: In applicable scenarios
Step 3 - Data Sources
Primary Research
- Web Analytics
- Survey Reports
- Research Institute
- Latest Research Reports
- Opinion Leaders
Secondary Research
- Annual Reports
- White Paper
- Latest Press Release
- Industry Association
- Paid Database
- Investor Presentations

Step 4 - Data Triangulation
Involves using different sources of information in order to increase the validity of a study
These sources are likely to be stakeholders in a program - participants, other researchers, program staff, other community members, and so on.
Then we put all data in single framework & apply various statistical tools to find out the dynamic on the market.
During the analysis stage, feedback from the stakeholder groups would be compared to determine areas of agreement as well as areas of divergence