

Key Insights
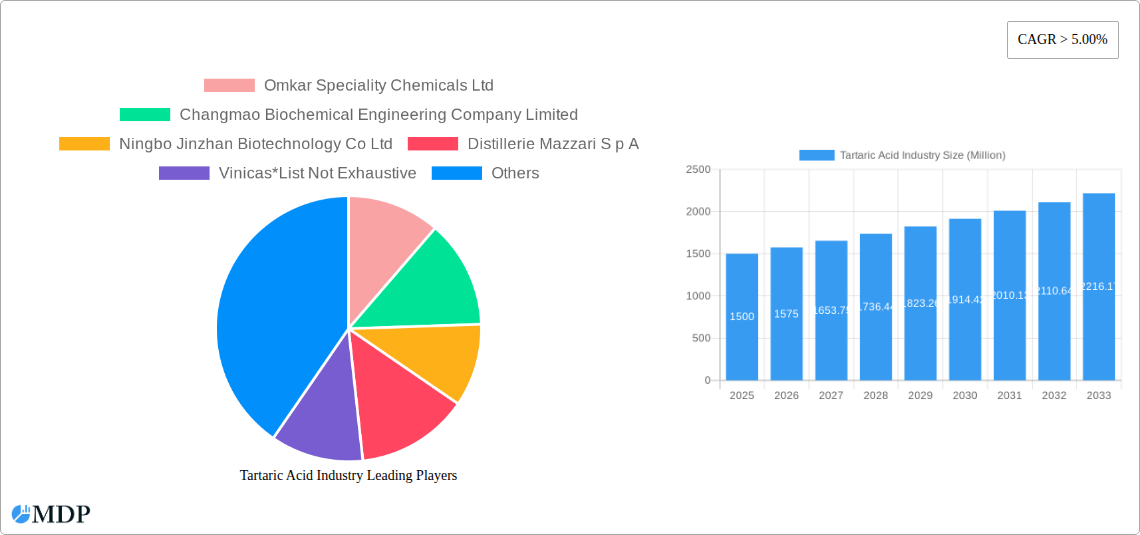
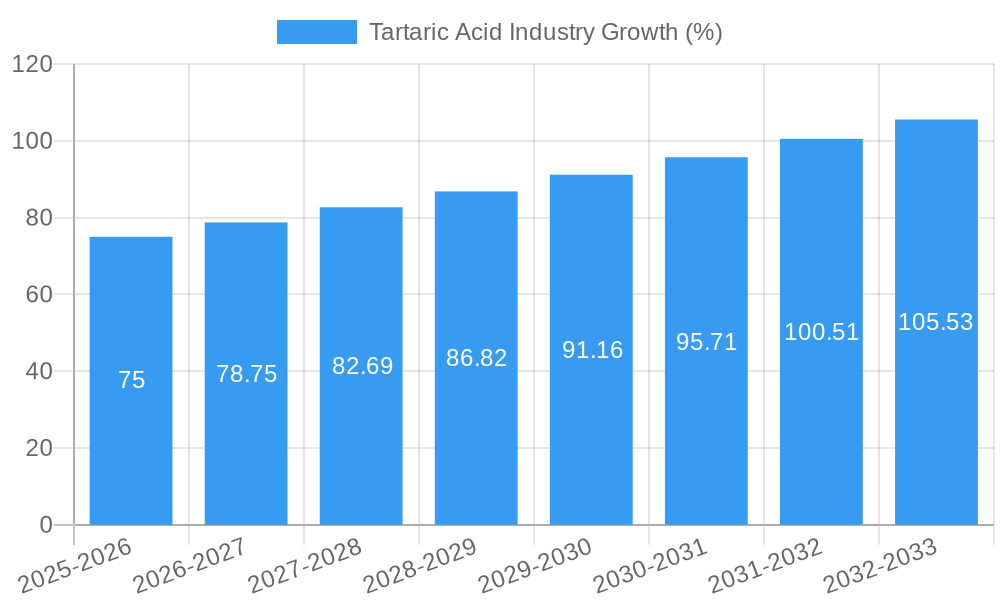
The global tartaric acid market is experiencing robust growth, driven by increasing demand across diverse sectors. With a current market size exceeding $XX million (estimated based on available data and industry growth trends), the market is projected to maintain a Compound Annual Growth Rate (CAGR) of over 5% from 2025 to 2033. This expansion is fueled by several key factors. The food and beverage industry remains a significant consumer, utilizing tartaric acid as a preservative, flavor enhancer, and acidity regulator in various products like beverages, confectionery, and baked goods. The pharmaceutical industry also contributes substantially, using tartaric acid in drug formulations and as an intermediate in the synthesis of other pharmaceutical compounds. The rising popularity of natural and organic products is further boosting demand for natural tartaric acid, while the cosmetic industry’s use of tartaric acid in skincare products represents a growing niche market. Furthermore, the construction industry utilizes tartaric acid in specific applications, contributing modestly to overall market growth.
However, certain restraints are present. Fluctuations in raw material prices (primarily grapes and wine by-products for natural tartaric acid) can impact profitability and pricing strategies. Supply chain disruptions and regional variations in regulatory frameworks also pose challenges for market participants. Despite these limitations, the long-term outlook remains positive, driven by innovation in applications, expanding global consumption patterns, and the continued growth of target end-use sectors. The market segmentation reflects these dynamics, with food & beverage, pharmaceuticals, and cosmetics showing the most promising growth trajectories. Key players are actively pursuing strategies of product diversification, geographic expansion, and capacity augmentation to capitalize on these market opportunities.
Tartaric Acid Industry: A Comprehensive Market Report (2019-2033)
This comprehensive report provides an in-depth analysis of the global Tartaric Acid industry, offering invaluable insights for stakeholders seeking to navigate this dynamic market. The report covers the period from 2019 to 2033, with a focus on the 2025-2033 forecast period. The study utilizes data from 2019-2024 as its historical period and 2025 as the base and estimated year. Key players profiled include Omkar Speciality Chemicals Ltd, Changmao Biochemical Engineering Company Limited, Ningbo Jinzhan Biotechnology Co Ltd, Distillerie Mazzari S p A, Vinicas, The Tartaric Chemicals Corporation, Giovanni Randi SpA, Tarac Technologies, Anhui Hailan Bio-technology Co ltd, AUSTRALIAN TARTARIC PRODUCTS, Dastech International Inc, Derivados Vínicos S A, Tártaros Gonzalo Castelló, ATP Group, and Industria Chimica Valenzana I C V SpA (list not exhaustive). The report segments the market by application (Preservative and Additive, Laxative, Intermediate, Other Applications), end-user industry (Food and Beverage, Pharmaceutical, Cosmetics, Construction, Other End-user Industries), and type (Natural Tartaric Acid, Synthetic Tartaric Acid). This report is essential for businesses, investors, and researchers seeking a complete understanding of the tartaric acid market.
Tartaric Acid Industry Market Dynamics & Concentration
The global tartaric acid market exhibits a moderately consolidated structure, with the top five players holding approximately xx% of the market share in 2025. Market concentration is influenced by factors such as economies of scale in production, access to raw materials, and established distribution networks. Innovation in production processes, such as the development of more efficient and sustainable methods, drives market growth. Stringent regulatory frameworks concerning food safety and environmental protection influence manufacturing practices and product formulations. Substitutes for tartaric acid, although limited, exist in certain applications and exert competitive pressure. End-user trends, such as growing demand for natural and organic products, particularly in the food and beverage sector, shape market demand. M&A activity in the industry has been relatively moderate in recent years, with approximately xx deals recorded between 2019 and 2024, primarily focused on expanding production capacity and geographical reach.
- Market Share: Top 5 players – xx% (2025)
- M&A Activity: xx deals (2019-2024)
- Key Innovation Drivers: Sustainable production methods, improved purity levels.
- Regulatory Impact: Stringent food safety and environmental regulations.
Tartaric Acid Industry Industry Trends & Analysis
The global tartaric acid market is projected to experience a CAGR of xx% during the forecast period (2025-2033), driven primarily by rising demand from the food and beverage industry, especially in developing economies. Technological advancements in extraction and purification processes are improving the efficiency and cost-effectiveness of tartaric acid production. Consumer preference for natural and clean-label products is boosting demand for natural tartaric acid. The competitive landscape is characterized by both established players and emerging manufacturers vying for market share, leading to price competition and product differentiation strategies. Market penetration of tartaric acid in various applications, such as cosmetics and pharmaceuticals, is steadily increasing.
Leading Markets & Segments in Tartaric Acid Industry
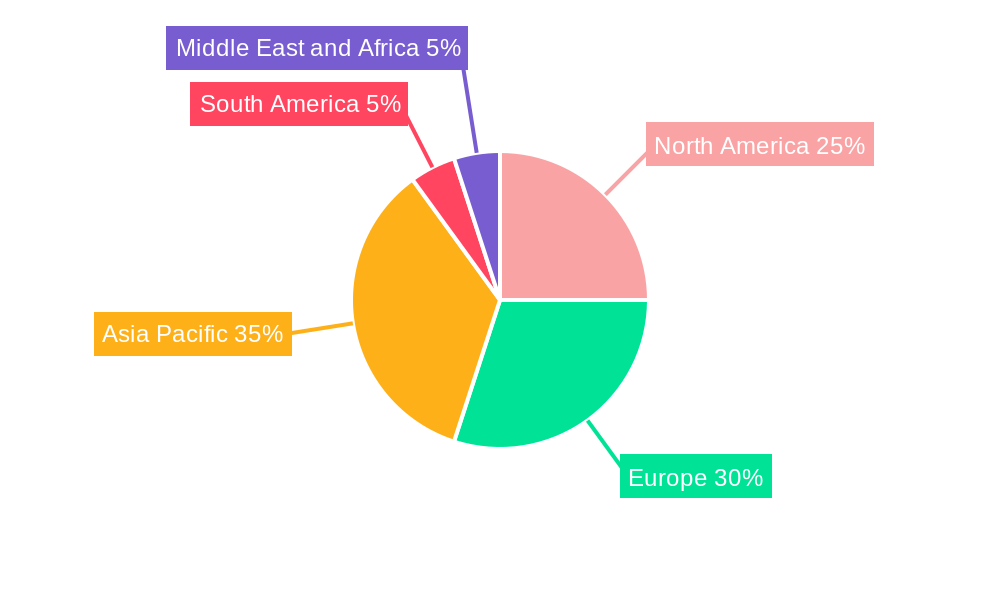
The food and beverage industry is the dominant end-user segment, accounting for approximately xx% of global tartaric acid consumption in 2025. Within applications, the preservative and additive segment holds the largest market share due to the widespread use of tartaric acid as an acidity regulator and antioxidant in food and beverages. Europe and North America remain key regional markets due to established food processing industries and stringent food safety regulations. However, the Asia-Pacific region shows the highest growth potential, driven by rising disposable incomes, expanding food and beverage sector, and increased consumption of processed foods.
- Key Drivers in Asia-Pacific: Rising disposable incomes, expanding food processing sector.
- Key Drivers in Europe & North America: Established food processing industries, stringent food safety standards.
- Dominant Segment (Application): Preservative and Additive
- Dominant Segment (End-user): Food and Beverage
- Dominant Segment (Type): Natural Tartaric Acid
Tartaric Acid Industry Product Developments
Recent product innovations have focused on improving the purity and consistency of tartaric acid, as well as developing specialized grades for specific applications. The market is seeing a shift towards more sustainable and eco-friendly production methods, aligning with increasing environmental concerns. These advancements enhance the functionality and competitive advantages of tartaric acid in various applications, supporting its continued market penetration.
Key Drivers of Tartaric Acid Industry Growth
Several factors propel the growth of the tartaric acid market. The expanding food and beverage industry, particularly the processed food segment, fuels substantial demand. Technological advancements leading to enhanced production efficiency and cost reduction are significant drivers. Furthermore, favorable government regulations and increasing consumer awareness of food safety and quality contribute to market expansion.
Challenges in the Tartaric Acid Industry Market
The tartaric acid industry faces challenges including fluctuating raw material prices, stringent regulatory compliance requirements, and intense competition among established and emerging players. These factors can impact production costs and profitability. Supply chain disruptions can also affect the availability and timely delivery of tartaric acid, especially during periods of high demand.
Emerging Opportunities in Tartaric Acid Industry
The tartaric acid market presents lucrative opportunities. Expansion into emerging markets with growing food processing industries offers significant potential. Furthermore, exploring new applications, particularly in pharmaceuticals and cosmetics, can unlock substantial market growth. Strategic partnerships and collaborations between manufacturers and end-users can create synergy and enhance market penetration.
Leading Players in the Tartaric Acid Industry Sector
- Omkar Speciality Chemicals Ltd
- Changmao Biochemical Engineering Company Limited
- Ningbo Jinzhan Biotechnology Co Ltd
- Distillerie Mazzari S p A
- Vinicas
- The Tartaric Chemicals Corporation
- Giovanni Randi SpA
- Tarac Technologies
- Anhui Hailan Bio-technology Co ltd
- AUSTRALIAN TARTARIC PRODUCTS
- Dastech International Inc
- Derivados Vínicos S A
- Tártaros Gonzalo Castelló
- ATP Group
- Industria Chimica Valenzana I C V SpA
Key Milestones in Tartaric Acid Industry Industry
- 2020: Introduction of a new, more efficient production process by xx company.
- 2022: Acquisition of xx company by xx company, expanding market reach.
- 2023: Launch of a new, high-purity tartaric acid grade for pharmaceutical applications by xx company.
- 2024: Implementation of stricter environmental regulations impacting production methods across the industry.
Strategic Outlook for Tartaric Acid Industry Market
The tartaric acid market is poised for continued growth, fueled by expanding applications, particularly in emerging markets and specialized sectors. Strategic acquisitions, technological innovations, and a focus on sustainability are crucial for industry players seeking to enhance competitiveness and capture market share. Long-term growth will depend on adapting to evolving consumer preferences and stringent regulatory landscapes.
Tartaric Acid Industry Segmentation
-
1. Type
- 1.1. Natural Tartaric Acid
- 1.2. Synthetic Tartaric Acid
-
2. Application
- 2.1. Preservative and Additive
- 2.2. Laxative
- 2.3. Intermediate
- 2.4. Other Applications
-
3. End-user Industry
- 3.1. Food and Beverage
- 3.2. Pharmaceutical
- 3.3. Cosmetics
- 3.4. Construction
- 3.5. Other End-user Industries
Tartaric Acid Industry Segmentation By Geography
-
1. Asia Pacific
- 1.1. China
- 1.2. India
- 1.3. Japan
- 1.4. South Korea
- 1.5. Rest of Asia Pacific
-
2. North America
- 2.1. United States
- 2.2. Canada
- 2.3. Mexico
-
3. Europe
- 3.1. Germany
- 3.2. United Kingdom
- 3.3. France
- 3.4. Italy
- 3.5. Spain
- 3.6. Rest of Europe
-
4. South America
- 4.1. Brazil
- 4.2. Argentina
- 4.3. Rest of South America
-
5. Middle East and Africa
- 5.1. Saudi Arabia
- 5.2. South Africa
- 5.3. Rest of Middle East and Africa
Tartaric Acid Industry REPORT HIGHLIGHTS
| Aspects | Details |
|---|---|
| Study Period | 2019-2033 |
| Base Year | 2024 |
| Estimated Year | 2025 |
| Forecast Period | 2025-2033 |
| Historical Period | 2019-2024 |
| Growth Rate | CAGR of > 5.00% from 2019-2033 |
| Segmentation |
|
Table of Contents
- 1. Introduction
- 1.1. Research Scope
- 1.2. Market Segmentation
- 1.3. Research Methodology
- 1.4. Definitions and Assumptions
- 2. Executive Summary
- 2.1. Introduction
- 3. Market Dynamics
- 3.1. Introduction
- 3.2. Market Drivers
- 3.2.1. Growing Demand for Wine in the Asia-Pacific and Latin American Regions; Increased Adoption of Microencapsulation across Pharmaceuticals and Food Industries; Rising Demand from the Pharmaceutical Industry
- 3.3. Market Restrains
- 3.3.1. Increasing Government Regulations for Restricted Use of Synthetic Tartaric Acid in the Food Industry
- 3.4. Market Trends
- 3.4.1. Increasing Demand from the Cosmetics Industry
- 4. Market Factor Analysis
- 4.1. Porters Five Forces
- 4.2. Supply/Value Chain
- 4.3. PESTEL analysis
- 4.4. Market Entropy
- 4.5. Patent/Trademark Analysis
- 5. Global Tartaric Acid Industry Analysis, Insights and Forecast, 2019-2031
- 5.1. Market Analysis, Insights and Forecast - by Type
- 5.1.1. Natural Tartaric Acid
- 5.1.2. Synthetic Tartaric Acid
- 5.2. Market Analysis, Insights and Forecast - by Application
- 5.2.1. Preservative and Additive
- 5.2.2. Laxative
- 5.2.3. Intermediate
- 5.2.4. Other Applications
- 5.3. Market Analysis, Insights and Forecast - by End-user Industry
- 5.3.1. Food and Beverage
- 5.3.2. Pharmaceutical
- 5.3.3. Cosmetics
- 5.3.4. Construction
- 5.3.5. Other End-user Industries
- 5.4. Market Analysis, Insights and Forecast - by Region
- 5.4.1. Asia Pacific
- 5.4.2. North America
- 5.4.3. Europe
- 5.4.4. South America
- 5.4.5. Middle East and Africa
- 5.1. Market Analysis, Insights and Forecast - by Type
- 6. Asia Pacific Tartaric Acid Industry Analysis, Insights and Forecast, 2019-2031
- 6.1. Market Analysis, Insights and Forecast - by Type
- 6.1.1. Natural Tartaric Acid
- 6.1.2. Synthetic Tartaric Acid
- 6.2. Market Analysis, Insights and Forecast - by Application
- 6.2.1. Preservative and Additive
- 6.2.2. Laxative
- 6.2.3. Intermediate
- 6.2.4. Other Applications
- 6.3. Market Analysis, Insights and Forecast - by End-user Industry
- 6.3.1. Food and Beverage
- 6.3.2. Pharmaceutical
- 6.3.3. Cosmetics
- 6.3.4. Construction
- 6.3.5. Other End-user Industries
- 6.1. Market Analysis, Insights and Forecast - by Type
- 7. North America Tartaric Acid Industry Analysis, Insights and Forecast, 2019-2031
- 7.1. Market Analysis, Insights and Forecast - by Type
- 7.1.1. Natural Tartaric Acid
- 7.1.2. Synthetic Tartaric Acid
- 7.2. Market Analysis, Insights and Forecast - by Application
- 7.2.1. Preservative and Additive
- 7.2.2. Laxative
- 7.2.3. Intermediate
- 7.2.4. Other Applications
- 7.3. Market Analysis, Insights and Forecast - by End-user Industry
- 7.3.1. Food and Beverage
- 7.3.2. Pharmaceutical
- 7.3.3. Cosmetics
- 7.3.4. Construction
- 7.3.5. Other End-user Industries
- 7.1. Market Analysis, Insights and Forecast - by Type
- 8. Europe Tartaric Acid Industry Analysis, Insights and Forecast, 2019-2031
- 8.1. Market Analysis, Insights and Forecast - by Type
- 8.1.1. Natural Tartaric Acid
- 8.1.2. Synthetic Tartaric Acid
- 8.2. Market Analysis, Insights and Forecast - by Application
- 8.2.1. Preservative and Additive
- 8.2.2. Laxative
- 8.2.3. Intermediate
- 8.2.4. Other Applications
- 8.3. Market Analysis, Insights and Forecast - by End-user Industry
- 8.3.1. Food and Beverage
- 8.3.2. Pharmaceutical
- 8.3.3. Cosmetics
- 8.3.4. Construction
- 8.3.5. Other End-user Industries
- 8.1. Market Analysis, Insights and Forecast - by Type
- 9. South America Tartaric Acid Industry Analysis, Insights and Forecast, 2019-2031
- 9.1. Market Analysis, Insights and Forecast - by Type
- 9.1.1. Natural Tartaric Acid
- 9.1.2. Synthetic Tartaric Acid
- 9.2. Market Analysis, Insights and Forecast - by Application
- 9.2.1. Preservative and Additive
- 9.2.2. Laxative
- 9.2.3. Intermediate
- 9.2.4. Other Applications
- 9.3. Market Analysis, Insights and Forecast - by End-user Industry
- 9.3.1. Food and Beverage
- 9.3.2. Pharmaceutical
- 9.3.3. Cosmetics
- 9.3.4. Construction
- 9.3.5. Other End-user Industries
- 9.1. Market Analysis, Insights and Forecast - by Type
- 10. Middle East and Africa Tartaric Acid Industry Analysis, Insights and Forecast, 2019-2031
- 10.1. Market Analysis, Insights and Forecast - by Type
- 10.1.1. Natural Tartaric Acid
- 10.1.2. Synthetic Tartaric Acid
- 10.2. Market Analysis, Insights and Forecast - by Application
- 10.2.1. Preservative and Additive
- 10.2.2. Laxative
- 10.2.3. Intermediate
- 10.2.4. Other Applications
- 10.3. Market Analysis, Insights and Forecast - by End-user Industry
- 10.3.1. Food and Beverage
- 10.3.2. Pharmaceutical
- 10.3.3. Cosmetics
- 10.3.4. Construction
- 10.3.5. Other End-user Industries
- 10.1. Market Analysis, Insights and Forecast - by Type
- 11. Asia Pacific Tartaric Acid Industry Analysis, Insights and Forecast, 2019-2031
- 11.1. Market Analysis, Insights and Forecast - By Country/Sub-region
- 11.1.1 China
- 11.1.2 India
- 11.1.3 Japan
- 11.1.4 South Korea
- 11.1.5 Rest of Asia Pacific
- 12. North America Tartaric Acid Industry Analysis, Insights and Forecast, 2019-2031
- 12.1. Market Analysis, Insights and Forecast - By Country/Sub-region
- 12.1.1 United States
- 12.1.2 Canada
- 12.1.3 Mexico
- 13. Europe Tartaric Acid Industry Analysis, Insights and Forecast, 2019-2031
- 13.1. Market Analysis, Insights and Forecast - By Country/Sub-region
- 13.1.1 Germany
- 13.1.2 United Kingdom
- 13.1.3 France
- 13.1.4 Italy
- 13.1.5 Spain
- 13.1.6 Rest of Europe
- 14. South America Tartaric Acid Industry Analysis, Insights and Forecast, 2019-2031
- 14.1. Market Analysis, Insights and Forecast - By Country/Sub-region
- 14.1.1 Brazil
- 14.1.2 Argentina
- 14.1.3 Rest of South America
- 15. Middle East and Africa Tartaric Acid Industry Analysis, Insights and Forecast, 2019-2031
- 15.1. Market Analysis, Insights and Forecast - By Country/Sub-region
- 15.1.1 Saudi Arabia
- 15.1.2 South Africa
- 15.1.3 Rest of Middle East and Africa
- 16. Competitive Analysis
- 16.1. Global Market Share Analysis 2024
- 16.2. Company Profiles
- 16.2.1 Omkar Speciality Chemicals Ltd
- 16.2.1.1. Overview
- 16.2.1.2. Products
- 16.2.1.3. SWOT Analysis
- 16.2.1.4. Recent Developments
- 16.2.1.5. Financials (Based on Availability)
- 16.2.2 Changmao Biochemical Engineering Company Limited
- 16.2.2.1. Overview
- 16.2.2.2. Products
- 16.2.2.3. SWOT Analysis
- 16.2.2.4. Recent Developments
- 16.2.2.5. Financials (Based on Availability)
- 16.2.3 Ningbo Jinzhan Biotechnology Co Ltd
- 16.2.3.1. Overview
- 16.2.3.2. Products
- 16.2.3.3. SWOT Analysis
- 16.2.3.4. Recent Developments
- 16.2.3.5. Financials (Based on Availability)
- 16.2.4 Distillerie Mazzari S p A
- 16.2.4.1. Overview
- 16.2.4.2. Products
- 16.2.4.3. SWOT Analysis
- 16.2.4.4. Recent Developments
- 16.2.4.5. Financials (Based on Availability)
- 16.2.5 Vinicas*List Not Exhaustive
- 16.2.5.1. Overview
- 16.2.5.2. Products
- 16.2.5.3. SWOT Analysis
- 16.2.5.4. Recent Developments
- 16.2.5.5. Financials (Based on Availability)
- 16.2.6 The Tartaric Chemicals Corporation
- 16.2.6.1. Overview
- 16.2.6.2. Products
- 16.2.6.3. SWOT Analysis
- 16.2.6.4. Recent Developments
- 16.2.6.5. Financials (Based on Availability)
- 16.2.7 Giovanni Randi SpA
- 16.2.7.1. Overview
- 16.2.7.2. Products
- 16.2.7.3. SWOT Analysis
- 16.2.7.4. Recent Developments
- 16.2.7.5. Financials (Based on Availability)
- 16.2.8 Tarac Technologies
- 16.2.8.1. Overview
- 16.2.8.2. Products
- 16.2.8.3. SWOT Analysis
- 16.2.8.4. Recent Developments
- 16.2.8.5. Financials (Based on Availability)
- 16.2.9 Anhui Hailan Bio-technology Co ltd
- 16.2.9.1. Overview
- 16.2.9.2. Products
- 16.2.9.3. SWOT Analysis
- 16.2.9.4. Recent Developments
- 16.2.9.5. Financials (Based on Availability)
- 16.2.10 AUSTRALIAN TARTARIC PRODUCTS
- 16.2.10.1. Overview
- 16.2.10.2. Products
- 16.2.10.3. SWOT Analysis
- 16.2.10.4. Recent Developments
- 16.2.10.5. Financials (Based on Availability)
- 16.2.11 Dastech International Inc
- 16.2.11.1. Overview
- 16.2.11.2. Products
- 16.2.11.3. SWOT Analysis
- 16.2.11.4. Recent Developments
- 16.2.11.5. Financials (Based on Availability)
- 16.2.12 Derivados Vínicos S A
- 16.2.12.1. Overview
- 16.2.12.2. Products
- 16.2.12.3. SWOT Analysis
- 16.2.12.4. Recent Developments
- 16.2.12.5. Financials (Based on Availability)
- 16.2.13 Tártaros Gonzalo Castelló
- 16.2.13.1. Overview
- 16.2.13.2. Products
- 16.2.13.3. SWOT Analysis
- 16.2.13.4. Recent Developments
- 16.2.13.5. Financials (Based on Availability)
- 16.2.14 ATP Group
- 16.2.14.1. Overview
- 16.2.14.2. Products
- 16.2.14.3. SWOT Analysis
- 16.2.14.4. Recent Developments
- 16.2.14.5. Financials (Based on Availability)
- 16.2.15 Industria Chimica Valenzana I C V SpA
- 16.2.15.1. Overview
- 16.2.15.2. Products
- 16.2.15.3. SWOT Analysis
- 16.2.15.4. Recent Developments
- 16.2.15.5. Financials (Based on Availability)
- 16.2.1 Omkar Speciality Chemicals Ltd
List of Figures
- Figure 1: Global Tartaric Acid Industry Revenue Breakdown (Million, %) by Region 2024 & 2032
- Figure 2: Asia Pacific Tartaric Acid Industry Revenue (Million), by Country 2024 & 2032
- Figure 3: Asia Pacific Tartaric Acid Industry Revenue Share (%), by Country 2024 & 2032
- Figure 4: North America Tartaric Acid Industry Revenue (Million), by Country 2024 & 2032
- Figure 5: North America Tartaric Acid Industry Revenue Share (%), by Country 2024 & 2032
- Figure 6: Europe Tartaric Acid Industry Revenue (Million), by Country 2024 & 2032
- Figure 7: Europe Tartaric Acid Industry Revenue Share (%), by Country 2024 & 2032
- Figure 8: South America Tartaric Acid Industry Revenue (Million), by Country 2024 & 2032
- Figure 9: South America Tartaric Acid Industry Revenue Share (%), by Country 2024 & 2032
- Figure 10: Middle East and Africa Tartaric Acid Industry Revenue (Million), by Country 2024 & 2032
- Figure 11: Middle East and Africa Tartaric Acid Industry Revenue Share (%), by Country 2024 & 2032
- Figure 12: Asia Pacific Tartaric Acid Industry Revenue (Million), by Type 2024 & 2032
- Figure 13: Asia Pacific Tartaric Acid Industry Revenue Share (%), by Type 2024 & 2032
- Figure 14: Asia Pacific Tartaric Acid Industry Revenue (Million), by Application 2024 & 2032
- Figure 15: Asia Pacific Tartaric Acid Industry Revenue Share (%), by Application 2024 & 2032
- Figure 16: Asia Pacific Tartaric Acid Industry Revenue (Million), by End-user Industry 2024 & 2032
- Figure 17: Asia Pacific Tartaric Acid Industry Revenue Share (%), by End-user Industry 2024 & 2032
- Figure 18: Asia Pacific Tartaric Acid Industry Revenue (Million), by Country 2024 & 2032
- Figure 19: Asia Pacific Tartaric Acid Industry Revenue Share (%), by Country 2024 & 2032
- Figure 20: North America Tartaric Acid Industry Revenue (Million), by Type 2024 & 2032
- Figure 21: North America Tartaric Acid Industry Revenue Share (%), by Type 2024 & 2032
- Figure 22: North America Tartaric Acid Industry Revenue (Million), by Application 2024 & 2032
- Figure 23: North America Tartaric Acid Industry Revenue Share (%), by Application 2024 & 2032
- Figure 24: North America Tartaric Acid Industry Revenue (Million), by End-user Industry 2024 & 2032
- Figure 25: North America Tartaric Acid Industry Revenue Share (%), by End-user Industry 2024 & 2032
- Figure 26: North America Tartaric Acid Industry Revenue (Million), by Country 2024 & 2032
- Figure 27: North America Tartaric Acid Industry Revenue Share (%), by Country 2024 & 2032
- Figure 28: Europe Tartaric Acid Industry Revenue (Million), by Type 2024 & 2032
- Figure 29: Europe Tartaric Acid Industry Revenue Share (%), by Type 2024 & 2032
- Figure 30: Europe Tartaric Acid Industry Revenue (Million), by Application 2024 & 2032
- Figure 31: Europe Tartaric Acid Industry Revenue Share (%), by Application 2024 & 2032
- Figure 32: Europe Tartaric Acid Industry Revenue (Million), by End-user Industry 2024 & 2032
- Figure 33: Europe Tartaric Acid Industry Revenue Share (%), by End-user Industry 2024 & 2032
- Figure 34: Europe Tartaric Acid Industry Revenue (Million), by Country 2024 & 2032
- Figure 35: Europe Tartaric Acid Industry Revenue Share (%), by Country 2024 & 2032
- Figure 36: South America Tartaric Acid Industry Revenue (Million), by Type 2024 & 2032
- Figure 37: South America Tartaric Acid Industry Revenue Share (%), by Type 2024 & 2032
- Figure 38: South America Tartaric Acid Industry Revenue (Million), by Application 2024 & 2032
- Figure 39: South America Tartaric Acid Industry Revenue Share (%), by Application 2024 & 2032
- Figure 40: South America Tartaric Acid Industry Revenue (Million), by End-user Industry 2024 & 2032
- Figure 41: South America Tartaric Acid Industry Revenue Share (%), by End-user Industry 2024 & 2032
- Figure 42: South America Tartaric Acid Industry Revenue (Million), by Country 2024 & 2032
- Figure 43: South America Tartaric Acid Industry Revenue Share (%), by Country 2024 & 2032
- Figure 44: Middle East and Africa Tartaric Acid Industry Revenue (Million), by Type 2024 & 2032
- Figure 45: Middle East and Africa Tartaric Acid Industry Revenue Share (%), by Type 2024 & 2032
- Figure 46: Middle East and Africa Tartaric Acid Industry Revenue (Million), by Application 2024 & 2032
- Figure 47: Middle East and Africa Tartaric Acid Industry Revenue Share (%), by Application 2024 & 2032
- Figure 48: Middle East and Africa Tartaric Acid Industry Revenue (Million), by End-user Industry 2024 & 2032
- Figure 49: Middle East and Africa Tartaric Acid Industry Revenue Share (%), by End-user Industry 2024 & 2032
- Figure 50: Middle East and Africa Tartaric Acid Industry Revenue (Million), by Country 2024 & 2032
- Figure 51: Middle East and Africa Tartaric Acid Industry Revenue Share (%), by Country 2024 & 2032
List of Tables
- Table 1: Global Tartaric Acid Industry Revenue Million Forecast, by Region 2019 & 2032
- Table 2: Global Tartaric Acid Industry Revenue Million Forecast, by Type 2019 & 2032
- Table 3: Global Tartaric Acid Industry Revenue Million Forecast, by Application 2019 & 2032
- Table 4: Global Tartaric Acid Industry Revenue Million Forecast, by End-user Industry 2019 & 2032
- Table 5: Global Tartaric Acid Industry Revenue Million Forecast, by Region 2019 & 2032
- Table 6: Global Tartaric Acid Industry Revenue Million Forecast, by Country 2019 & 2032
- Table 7: China Tartaric Acid Industry Revenue (Million) Forecast, by Application 2019 & 2032
- Table 8: India Tartaric Acid Industry Revenue (Million) Forecast, by Application 2019 & 2032
- Table 9: Japan Tartaric Acid Industry Revenue (Million) Forecast, by Application 2019 & 2032
- Table 10: South Korea Tartaric Acid Industry Revenue (Million) Forecast, by Application 2019 & 2032
- Table 11: Rest of Asia Pacific Tartaric Acid Industry Revenue (Million) Forecast, by Application 2019 & 2032
- Table 12: Global Tartaric Acid Industry Revenue Million Forecast, by Country 2019 & 2032
- Table 13: United States Tartaric Acid Industry Revenue (Million) Forecast, by Application 2019 & 2032
- Table 14: Canada Tartaric Acid Industry Revenue (Million) Forecast, by Application 2019 & 2032
- Table 15: Mexico Tartaric Acid Industry Revenue (Million) Forecast, by Application 2019 & 2032
- Table 16: Global Tartaric Acid Industry Revenue Million Forecast, by Country 2019 & 2032
- Table 17: Germany Tartaric Acid Industry Revenue (Million) Forecast, by Application 2019 & 2032
- Table 18: United Kingdom Tartaric Acid Industry Revenue (Million) Forecast, by Application 2019 & 2032
- Table 19: France Tartaric Acid Industry Revenue (Million) Forecast, by Application 2019 & 2032
- Table 20: Italy Tartaric Acid Industry Revenue (Million) Forecast, by Application 2019 & 2032
- Table 21: Spain Tartaric Acid Industry Revenue (Million) Forecast, by Application 2019 & 2032
- Table 22: Rest of Europe Tartaric Acid Industry Revenue (Million) Forecast, by Application 2019 & 2032
- Table 23: Global Tartaric Acid Industry Revenue Million Forecast, by Country 2019 & 2032
- Table 24: Brazil Tartaric Acid Industry Revenue (Million) Forecast, by Application 2019 & 2032
- Table 25: Argentina Tartaric Acid Industry Revenue (Million) Forecast, by Application 2019 & 2032
- Table 26: Rest of South America Tartaric Acid Industry Revenue (Million) Forecast, by Application 2019 & 2032
- Table 27: Global Tartaric Acid Industry Revenue Million Forecast, by Country 2019 & 2032
- Table 28: Saudi Arabia Tartaric Acid Industry Revenue (Million) Forecast, by Application 2019 & 2032
- Table 29: South Africa Tartaric Acid Industry Revenue (Million) Forecast, by Application 2019 & 2032
- Table 30: Rest of Middle East and Africa Tartaric Acid Industry Revenue (Million) Forecast, by Application 2019 & 2032
- Table 31: Global Tartaric Acid Industry Revenue Million Forecast, by Type 2019 & 2032
- Table 32: Global Tartaric Acid Industry Revenue Million Forecast, by Application 2019 & 2032
- Table 33: Global Tartaric Acid Industry Revenue Million Forecast, by End-user Industry 2019 & 2032
- Table 34: Global Tartaric Acid Industry Revenue Million Forecast, by Country 2019 & 2032
- Table 35: China Tartaric Acid Industry Revenue (Million) Forecast, by Application 2019 & 2032
- Table 36: India Tartaric Acid Industry Revenue (Million) Forecast, by Application 2019 & 2032
- Table 37: Japan Tartaric Acid Industry Revenue (Million) Forecast, by Application 2019 & 2032
- Table 38: South Korea Tartaric Acid Industry Revenue (Million) Forecast, by Application 2019 & 2032
- Table 39: Rest of Asia Pacific Tartaric Acid Industry Revenue (Million) Forecast, by Application 2019 & 2032
- Table 40: Global Tartaric Acid Industry Revenue Million Forecast, by Type 2019 & 2032
- Table 41: Global Tartaric Acid Industry Revenue Million Forecast, by Application 2019 & 2032
- Table 42: Global Tartaric Acid Industry Revenue Million Forecast, by End-user Industry 2019 & 2032
- Table 43: Global Tartaric Acid Industry Revenue Million Forecast, by Country 2019 & 2032
- Table 44: United States Tartaric Acid Industry Revenue (Million) Forecast, by Application 2019 & 2032
- Table 45: Canada Tartaric Acid Industry Revenue (Million) Forecast, by Application 2019 & 2032
- Table 46: Mexico Tartaric Acid Industry Revenue (Million) Forecast, by Application 2019 & 2032
- Table 47: Global Tartaric Acid Industry Revenue Million Forecast, by Type 2019 & 2032
- Table 48: Global Tartaric Acid Industry Revenue Million Forecast, by Application 2019 & 2032
- Table 49: Global Tartaric Acid Industry Revenue Million Forecast, by End-user Industry 2019 & 2032
- Table 50: Global Tartaric Acid Industry Revenue Million Forecast, by Country 2019 & 2032
- Table 51: Germany Tartaric Acid Industry Revenue (Million) Forecast, by Application 2019 & 2032
- Table 52: United Kingdom Tartaric Acid Industry Revenue (Million) Forecast, by Application 2019 & 2032
- Table 53: France Tartaric Acid Industry Revenue (Million) Forecast, by Application 2019 & 2032
- Table 54: Italy Tartaric Acid Industry Revenue (Million) Forecast, by Application 2019 & 2032
- Table 55: Spain Tartaric Acid Industry Revenue (Million) Forecast, by Application 2019 & 2032
- Table 56: Rest of Europe Tartaric Acid Industry Revenue (Million) Forecast, by Application 2019 & 2032
- Table 57: Global Tartaric Acid Industry Revenue Million Forecast, by Type 2019 & 2032
- Table 58: Global Tartaric Acid Industry Revenue Million Forecast, by Application 2019 & 2032
- Table 59: Global Tartaric Acid Industry Revenue Million Forecast, by End-user Industry 2019 & 2032
- Table 60: Global Tartaric Acid Industry Revenue Million Forecast, by Country 2019 & 2032
- Table 61: Brazil Tartaric Acid Industry Revenue (Million) Forecast, by Application 2019 & 2032
- Table 62: Argentina Tartaric Acid Industry Revenue (Million) Forecast, by Application 2019 & 2032
- Table 63: Rest of South America Tartaric Acid Industry Revenue (Million) Forecast, by Application 2019 & 2032
- Table 64: Global Tartaric Acid Industry Revenue Million Forecast, by Type 2019 & 2032
- Table 65: Global Tartaric Acid Industry Revenue Million Forecast, by Application 2019 & 2032
- Table 66: Global Tartaric Acid Industry Revenue Million Forecast, by End-user Industry 2019 & 2032
- Table 67: Global Tartaric Acid Industry Revenue Million Forecast, by Country 2019 & 2032
- Table 68: Saudi Arabia Tartaric Acid Industry Revenue (Million) Forecast, by Application 2019 & 2032
- Table 69: South Africa Tartaric Acid Industry Revenue (Million) Forecast, by Application 2019 & 2032
- Table 70: Rest of Middle East and Africa Tartaric Acid Industry Revenue (Million) Forecast, by Application 2019 & 2032
Frequently Asked Questions
1. What is the projected Compound Annual Growth Rate (CAGR) of the Tartaric Acid Industry?
The projected CAGR is approximately > 5.00%.
2. Which companies are prominent players in the Tartaric Acid Industry?
Key companies in the market include Omkar Speciality Chemicals Ltd, Changmao Biochemical Engineering Company Limited, Ningbo Jinzhan Biotechnology Co Ltd, Distillerie Mazzari S p A, Vinicas*List Not Exhaustive, The Tartaric Chemicals Corporation, Giovanni Randi SpA, Tarac Technologies, Anhui Hailan Bio-technology Co ltd, AUSTRALIAN TARTARIC PRODUCTS, Dastech International Inc, Derivados Vínicos S A, Tártaros Gonzalo Castelló, ATP Group, Industria Chimica Valenzana I C V SpA.
3. What are the main segments of the Tartaric Acid Industry?
The market segments include Type, Application, End-user Industry.
4. Can you provide details about the market size?
The market size is estimated to be USD XX Million as of 2022.
5. What are some drivers contributing to market growth?
Growing Demand for Wine in the Asia-Pacific and Latin American Regions; Increased Adoption of Microencapsulation across Pharmaceuticals and Food Industries; Rising Demand from the Pharmaceutical Industry.
6. What are the notable trends driving market growth?
Increasing Demand from the Cosmetics Industry.
7. Are there any restraints impacting market growth?
Increasing Government Regulations for Restricted Use of Synthetic Tartaric Acid in the Food Industry.
8. Can you provide examples of recent developments in the market?
N/A
9. What pricing options are available for accessing the report?
Pricing options include single-user, multi-user, and enterprise licenses priced at USD 4750, USD 5250, and USD 8750 respectively.
10. Is the market size provided in terms of value or volume?
The market size is provided in terms of value, measured in Million.
11. Are there any specific market keywords associated with the report?
Yes, the market keyword associated with the report is "Tartaric Acid Industry," which aids in identifying and referencing the specific market segment covered.
12. How do I determine which pricing option suits my needs best?
The pricing options vary based on user requirements and access needs. Individual users may opt for single-user licenses, while businesses requiring broader access may choose multi-user or enterprise licenses for cost-effective access to the report.
13. Are there any additional resources or data provided in the Tartaric Acid Industry report?
While the report offers comprehensive insights, it's advisable to review the specific contents or supplementary materials provided to ascertain if additional resources or data are available.
14. How can I stay updated on further developments or reports in the Tartaric Acid Industry?
To stay informed about further developments, trends, and reports in the Tartaric Acid Industry, consider subscribing to industry newsletters, following relevant companies and organizations, or regularly checking reputable industry news sources and publications.
Methodology
Step 1 - Identification of Relevant Samples Size from Population Database


Step 2 - Approaches for Defining Global Market Size (Value, Volume* & Price*)

Note*: In applicable scenarios
Step 3 - Data Sources
Primary Research
- Web Analytics
- Survey Reports
- Research Institute
- Latest Research Reports
- Opinion Leaders
Secondary Research
- Annual Reports
- White Paper
- Latest Press Release
- Industry Association
- Paid Database
- Investor Presentations

Step 4 - Data Triangulation
Involves using different sources of information in order to increase the validity of a study
These sources are likely to be stakeholders in a program - participants, other researchers, program staff, other community members, and so on.
Then we put all data in single framework & apply various statistical tools to find out the dynamic on the market.
During the analysis stage, feedback from the stakeholder groups would be compared to determine areas of agreement as well as areas of divergence
