

Key Insights
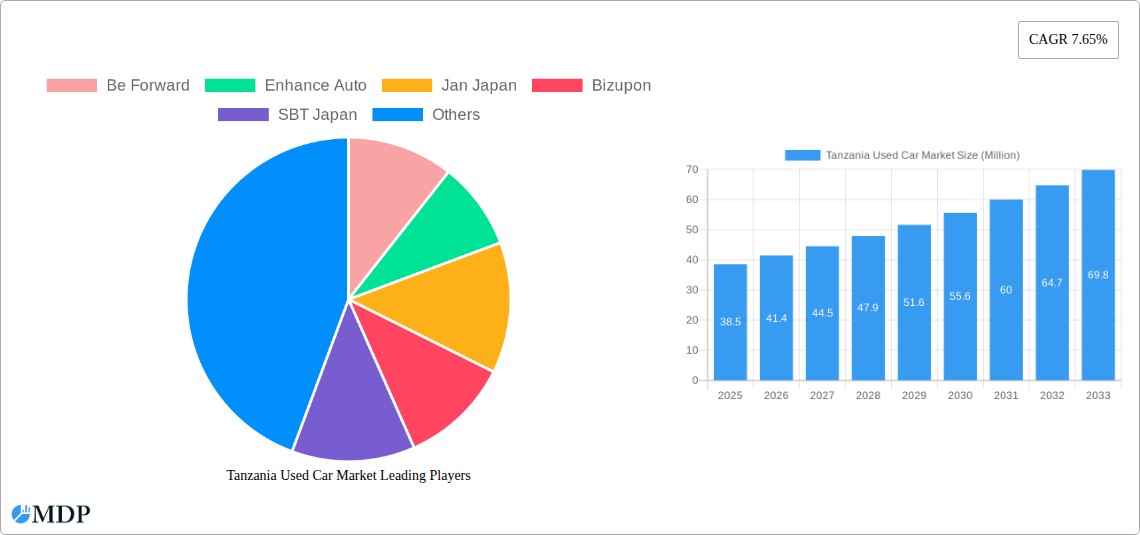
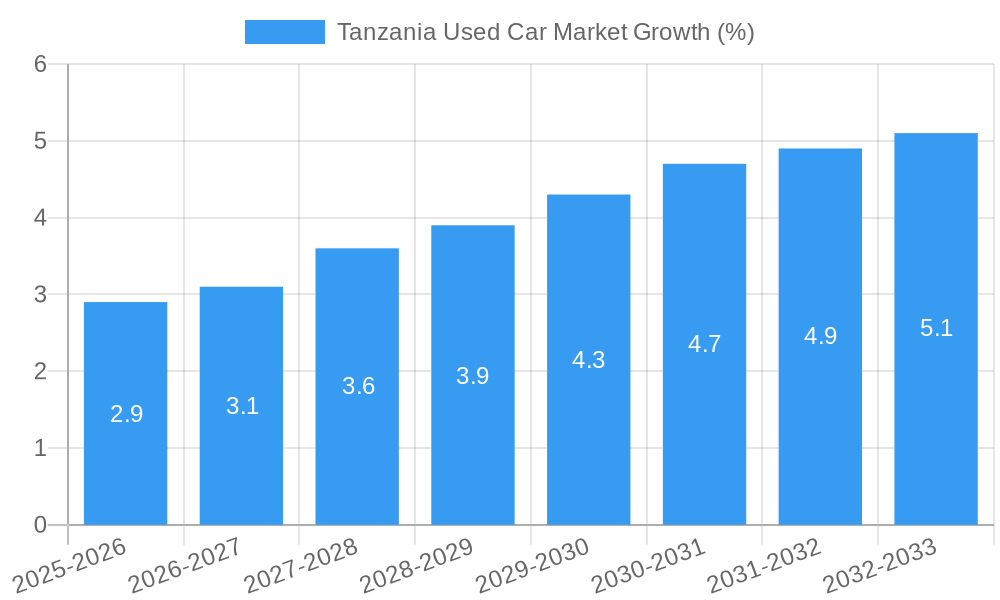
The Tanzanian used car market, valued at $38.5 million in 2025, exhibits robust growth potential, projected to expand at a Compound Annual Growth Rate (CAGR) of 7.65% from 2025 to 2033. This growth is fueled by several key factors. Rising disposable incomes and a burgeoning middle class are driving increased demand for personal vehicles, particularly in urban areas. The limited availability and high cost of new cars make the used car market a more accessible option for a large segment of the population. Furthermore, the expansion of online sales channels is enhancing market transparency and convenience, facilitating transactions and broadening reach. The market is segmented by vehicle type (hatchbacks, sedans, SUVs/MPVs), vendor type (organized and unorganized dealers), fuel type (petrol, diesel, electric, and others), and sales channel (online and offline). While the dominance of petrol and diesel vehicles is expected to continue in the near term, the gradual adoption of electric vehicles, albeit slow, presents a future growth opportunity. Challenges include the lack of standardized quality checks and the prevalence of unorganized dealers, which may impact consumer trust and the overall market's formalization. Nevertheless, the positive economic outlook for Tanzania and the growing need for personal transportation suggest a bright outlook for the used car sector.
The competitive landscape is characterized by a mix of both local and international players. Established players like Be Forward, Enhance Auto, and Jan Japan compete with numerous smaller, unorganized dealers. The increasing presence of online marketplaces such as Jiji and UsedCars.co.tz is altering the market dynamics, fostering greater competition and potentially driving down prices for consumers. The future growth of the Tanzanian used car market will hinge on several factors: government policies relating to vehicle imports and emissions standards, infrastructural improvements enhancing logistics, and the sustained growth of the Tanzanian economy. Addressing concerns about vehicle quality and promoting formalization within the unorganized sector would significantly enhance market stability and growth. Further research into consumer preferences for fuel types and vehicle features will provide valuable insights into future market trends and assist stakeholders in making informed business decisions.
Tanzania Used Car Market: A Comprehensive Report (2019-2033)
This in-depth report provides a comprehensive analysis of the Tanzania used car market, offering invaluable insights for industry stakeholders, investors, and businesses operating within this dynamic sector. Covering the period from 2019 to 2033, with a focus on 2025, this report meticulously examines market dynamics, key players, emerging trends, and future growth potential. Benefit from detailed segmentation analysis, including vehicle type, vendor type, fuel type, and sales channel, along with crucial data on market size, growth rates, and competitive landscape. Understand the impact of key events such as the surge in Zimbabwean vehicle imports through Dar es Salaam port and SBT Japan's expansion into the C2C market.
Tanzania Used Car Market Market Dynamics & Concentration
The Tanzanian used car market exhibits a complex interplay of factors influencing its dynamics and concentration. Market concentration is moderate, with several significant players competing alongside numerous smaller, unorganized vendors. Innovation is driven by online platforms offering enhanced search functionalities, transparent pricing, and secure payment gateways. The regulatory framework, while evolving, plays a role in shaping market behavior, particularly concerning import duties and vehicle standards. The market experiences competition from public transport and other modes of personal transport. Mergers and acquisitions (M&A) activity remains relatively low, with few notable deals recorded in the historical period (2019-2024). However, strategic partnerships are increasingly common, particularly amongst online platforms and logistics providers. Market share is largely dominated by organized vendors such as Be Forward, but unorganized players still hold a significant portion due to lower overheads and informal sales channels.
- Market Share (Estimated 2025): Organized Vendors: 60%; Unorganized Vendors: 40%
- M&A Deal Count (2019-2024): xx
- Key Regulatory Influences: Import duties, vehicle inspection standards, environmental regulations
Tanzania Used Car Market Industry Trends & Analysis
The Tanzanian used car market is characterized by robust growth, driven by factors including rising disposable incomes, a growing middle class, and increasing urbanization. The market exhibits a CAGR of xx% during the historical period (2019-2024) and is projected to maintain a healthy CAGR of xx% during the forecast period (2025-2033). Technological disruptions such as the proliferation of online marketplaces have transformed how used cars are bought and sold, boosting transparency and efficiency. Consumer preferences are shifting towards fuel-efficient vehicles and SUVs, while the penetration of electric vehicles remains limited. Competitive dynamics are characterized by intense rivalry among established players and the emergence of new entrants, particularly in the online space. Market penetration of online sales channels is growing rapidly, reaching an estimated xx% in 2025.
Leading Markets & Segments in Tanzania Used Car Market
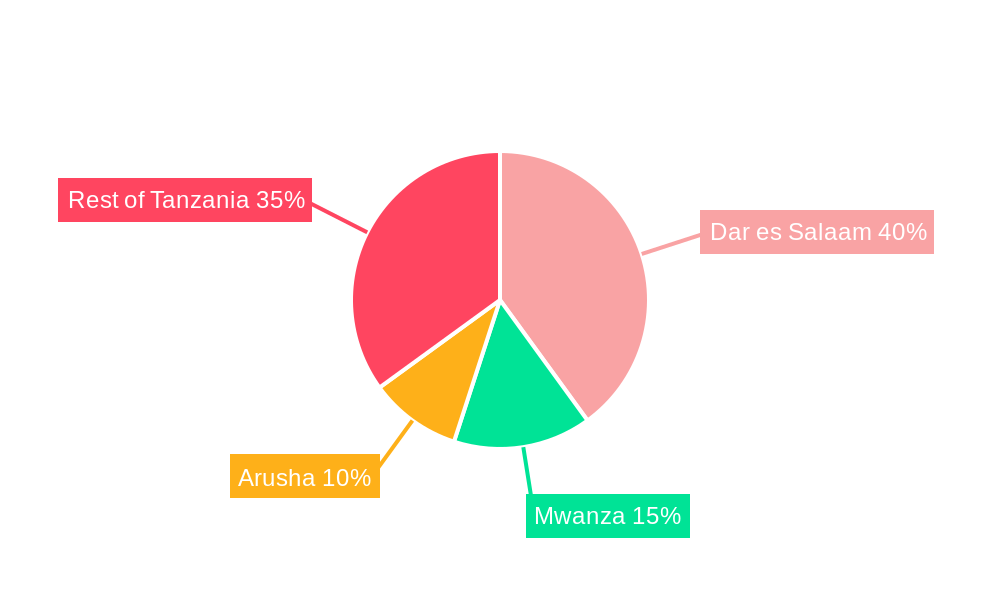
The Dar es Salaam region dominates the Tanzanian used car market, owing to its status as the nation's commercial hub and major port of entry for imported vehicles. The most prominent vehicle segments are Sedans and SUVs/MPVs, reflecting prevailing consumer preferences. Organized vendors hold a larger market share compared to unorganized players, though the latter continue to play a significant role in the market. Petrol remains the dominant fuel type, although diesel vehicles are gaining traction due to cost considerations. Online sales channels are rapidly expanding, but offline sales remain prominent, particularly in the unorganized segment.
- Key Drivers for Dar es Salaam Dominance:
- High population density
- Established infrastructure
- Major import hub
- Key Drivers for Sedans & SUVs/MPV Segment Dominance:
- Affordability
- Versatility
- Family suitability
- Key Drivers for Organized Vendor Growth:
- Transparency and trust
- Comprehensive services (financing, warranty)
- Wider vehicle selection
Tanzania Used Car Market Product Developments
Recent product innovations include improved online search tools, financing options, and extended warranties offered by organized vendors to enhance buyer confidence. The market is witnessing increased focus on fuel-efficient vehicles to address rising fuel costs. Technological advancements in online platforms have created greater convenience, information access, and security in transactions. The market is adapting to evolving consumer needs and technological advancements.
Key Drivers of Tanzania Used Car Market Growth
The Tanzanian used car market’s growth is propelled by several factors. Rising disposable incomes and the expanding middle class fuel demand for personal vehicles. Government initiatives promoting infrastructure development and improved transportation networks enhance accessibility and market reach. The influx of vehicles via Dar es Salaam port, despite challenges in other regions, contributes to supply. The increasing adoption of online platforms and mobile technology boosts transaction efficiency and market expansion.
Challenges in the Tanzania Used Car Market Market
Challenges include stringent import regulations and high duties that increase the cost of used car imports. The supply chain often faces complexities, leading to delays and higher transportation costs. Competition, especially amongst the organized players, can intensify, affecting profit margins. Counterfeit parts and lack of vehicle history verification create reliability concerns for buyers.
Emerging Opportunities in Tanzania Used Car Market
Significant growth opportunities exist through expanding online platforms to reach a wider customer base. Strategic partnerships with financial institutions and insurance providers can facilitate easier access to financing and vehicle protection plans. Government policies focusing on vehicle standards and environmental regulations present opportunities for businesses offering compliant and sustainable solutions. Expansion into underserved regions offers further growth potential.
Leading Players in the Tanzania Used Car Market Sector
- Be Forward
- Enhance Auto
- Jan Japan
- Bizupon
- SBT Japan
- Jiji
- CarTanzania
- SBI Motor Japan
- Car Junction Tanzania
- UsedCars.co.tz
- Garipesa
- Autorod
Key Milestones in Tanzania Used Car Market Industry
- June 2021: SBT Japan expands into the C2C market segment.
- November 2022: Dar es Salaam port sees a 316% increase in vehicle imports from Zimbabwe (2016-2022), reaching an estimated 15,000 vehicles annually.
Strategic Outlook for Tanzania Used Car Market Market
The Tanzanian used car market holds substantial long-term growth potential. Continued economic growth and infrastructure development will support expansion. The strategic adoption of technology and innovative business models will be crucial for success. Focusing on customer experience, transparent pricing, and secure transactions will further enhance market growth.
Tanzania Used Car Market Segmentation
-
1. Vehicle Type
- 1.1. Hatchbacks
- 1.2. Sedans
- 1.3. Sports U
-
2. Vendor Type
- 2.1. Organized
- 2.2. Unorganized
-
3. Fuel Type
- 3.1. Petrol
- 3.2. Diesel
- 3.3. Electric
- 3.4. Other Fuel Types (LPG, CNG, etc.)
-
4. Sales Channel
- 4.1. Online
- 4.2. Offline
Tanzania Used Car Market Segmentation By Geography
- 1. Tanzania
Tanzania Used Car Market REPORT HIGHLIGHTS
| Aspects | Details |
|---|---|
| Study Period | 2019-2033 |
| Base Year | 2024 |
| Estimated Year | 2025 |
| Forecast Period | 2025-2033 |
| Historical Period | 2019-2024 |
| Growth Rate | CAGR of 7.65% from 2019-2033 |
| Segmentation |
|
Table of Contents
- 1. Introduction
- 1.1. Research Scope
- 1.2. Market Segmentation
- 1.3. Research Methodology
- 1.4. Definitions and Assumptions
- 2. Executive Summary
- 2.1. Introduction
- 3. Market Dynamics
- 3.1. Introduction
- 3.2. Market Drivers
- 3.2.1. Rising Adoption of Digital Technologies
- 3.3. Market Restrains
- 3.3.1. Increasing Fuel Prices to Hinder the Demand for Used Cars
- 3.4. Market Trends
- 3.4.1. Rising Adoption of Digital Technologies Will Foster the Growth of the Target Market
- 4. Market Factor Analysis
- 4.1. Porters Five Forces
- 4.2. Supply/Value Chain
- 4.3. PESTEL analysis
- 4.4. Market Entropy
- 4.5. Patent/Trademark Analysis
- 5. Tanzania Used Car Market Analysis, Insights and Forecast, 2019-2031
- 5.1. Market Analysis, Insights and Forecast - by Vehicle Type
- 5.1.1. Hatchbacks
- 5.1.2. Sedans
- 5.1.3. Sports U
- 5.2. Market Analysis, Insights and Forecast - by Vendor Type
- 5.2.1. Organized
- 5.2.2. Unorganized
- 5.3. Market Analysis, Insights and Forecast - by Fuel Type
- 5.3.1. Petrol
- 5.3.2. Diesel
- 5.3.3. Electric
- 5.3.4. Other Fuel Types (LPG, CNG, etc.)
- 5.4. Market Analysis, Insights and Forecast - by Sales Channel
- 5.4.1. Online
- 5.4.2. Offline
- 5.5. Market Analysis, Insights and Forecast - by Region
- 5.5.1. Tanzania
- 5.1. Market Analysis, Insights and Forecast - by Vehicle Type
- 6. Competitive Analysis
- 6.1. Market Share Analysis 2024
- 6.2. Company Profiles
- 6.2.1 Be Forward
- 6.2.1.1. Overview
- 6.2.1.2. Products
- 6.2.1.3. SWOT Analysis
- 6.2.1.4. Recent Developments
- 6.2.1.5. Financials (Based on Availability)
- 6.2.2 Enhance Auto
- 6.2.2.1. Overview
- 6.2.2.2. Products
- 6.2.2.3. SWOT Analysis
- 6.2.2.4. Recent Developments
- 6.2.2.5. Financials (Based on Availability)
- 6.2.3 Jan Japan
- 6.2.3.1. Overview
- 6.2.3.2. Products
- 6.2.3.3. SWOT Analysis
- 6.2.3.4. Recent Developments
- 6.2.3.5. Financials (Based on Availability)
- 6.2.4 Bizupon
- 6.2.4.1. Overview
- 6.2.4.2. Products
- 6.2.4.3. SWOT Analysis
- 6.2.4.4. Recent Developments
- 6.2.4.5. Financials (Based on Availability)
- 6.2.5 SBT Japan
- 6.2.5.1. Overview
- 6.2.5.2. Products
- 6.2.5.3. SWOT Analysis
- 6.2.5.4. Recent Developments
- 6.2.5.5. Financials (Based on Availability)
- 6.2.6 Jiji
- 6.2.6.1. Overview
- 6.2.6.2. Products
- 6.2.6.3. SWOT Analysis
- 6.2.6.4. Recent Developments
- 6.2.6.5. Financials (Based on Availability)
- 6.2.7 CarTanzania
- 6.2.7.1. Overview
- 6.2.7.2. Products
- 6.2.7.3. SWOT Analysis
- 6.2.7.4. Recent Developments
- 6.2.7.5. Financials (Based on Availability)
- 6.2.8 SBI Motor Japa
- 6.2.8.1. Overview
- 6.2.8.2. Products
- 6.2.8.3. SWOT Analysis
- 6.2.8.4. Recent Developments
- 6.2.8.5. Financials (Based on Availability)
- 6.2.9 Car Junction Tanzania
- 6.2.9.1. Overview
- 6.2.9.2. Products
- 6.2.9.3. SWOT Analysis
- 6.2.9.4. Recent Developments
- 6.2.9.5. Financials (Based on Availability)
- 6.2.10 UsedCars co tz
- 6.2.10.1. Overview
- 6.2.10.2. Products
- 6.2.10.3. SWOT Analysis
- 6.2.10.4. Recent Developments
- 6.2.10.5. Financials (Based on Availability)
- 6.2.11 Garipesa
- 6.2.11.1. Overview
- 6.2.11.2. Products
- 6.2.11.3. SWOT Analysis
- 6.2.11.4. Recent Developments
- 6.2.11.5. Financials (Based on Availability)
- 6.2.12 Autorod
- 6.2.12.1. Overview
- 6.2.12.2. Products
- 6.2.12.3. SWOT Analysis
- 6.2.12.4. Recent Developments
- 6.2.12.5. Financials (Based on Availability)
- 6.2.1 Be Forward
List of Figures
- Figure 1: Tanzania Used Car Market Revenue Breakdown (Million, %) by Product 2024 & 2032
- Figure 2: Tanzania Used Car Market Share (%) by Company 2024
List of Tables
- Table 1: Tanzania Used Car Market Revenue Million Forecast, by Region 2019 & 2032
- Table 2: Tanzania Used Car Market Revenue Million Forecast, by Vehicle Type 2019 & 2032
- Table 3: Tanzania Used Car Market Revenue Million Forecast, by Vendor Type 2019 & 2032
- Table 4: Tanzania Used Car Market Revenue Million Forecast, by Fuel Type 2019 & 2032
- Table 5: Tanzania Used Car Market Revenue Million Forecast, by Sales Channel 2019 & 2032
- Table 6: Tanzania Used Car Market Revenue Million Forecast, by Region 2019 & 2032
- Table 7: Tanzania Used Car Market Revenue Million Forecast, by Country 2019 & 2032
- Table 8: Tanzania Used Car Market Revenue Million Forecast, by Vehicle Type 2019 & 2032
- Table 9: Tanzania Used Car Market Revenue Million Forecast, by Vendor Type 2019 & 2032
- Table 10: Tanzania Used Car Market Revenue Million Forecast, by Fuel Type 2019 & 2032
- Table 11: Tanzania Used Car Market Revenue Million Forecast, by Sales Channel 2019 & 2032
- Table 12: Tanzania Used Car Market Revenue Million Forecast, by Country 2019 & 2032
Frequently Asked Questions
1. What is the projected Compound Annual Growth Rate (CAGR) of the Tanzania Used Car Market?
The projected CAGR is approximately 7.65%.
2. Which companies are prominent players in the Tanzania Used Car Market?
Key companies in the market include Be Forward, Enhance Auto, Jan Japan, Bizupon, SBT Japan, Jiji, CarTanzania, SBI Motor Japa, Car Junction Tanzania, UsedCars co tz, Garipesa, Autorod.
3. What are the main segments of the Tanzania Used Car Market?
The market segments include Vehicle Type, Vendor Type, Fuel Type, Sales Channel.
4. Can you provide details about the market size?
The market size is estimated to be USD 38.5 Million as of 2022.
5. What are some drivers contributing to market growth?
Rising Adoption of Digital Technologies.
6. What are the notable trends driving market growth?
Rising Adoption of Digital Technologies Will Foster the Growth of the Target Market.
7. Are there any restraints impacting market growth?
Increasing Fuel Prices to Hinder the Demand for Used Cars.
8. Can you provide examples of recent developments in the market?
November 2022: The Dar Es Salaam port in Tanzania witnessed a remarkable annual increase of 316% in the importation of both new and used vehicles by Zimbabweans in 2022, compared to the figures recorded in 2016. As of November 2022, it was estimated that approximately 15,000 vehicles were being imported annually by Zimbabweans through this port, a significant surge from the mere 3,600 vehicles in 2016. This substantial shift in preference towards Dar Es Salaam port for shipments by Zimbabwe's used car dealers can be attributed to challenges in the South African ports' logistical operations.
9. What pricing options are available for accessing the report?
Pricing options include single-user, multi-user, and enterprise licenses priced at USD 3800, USD 4500, and USD 5800 respectively.
10. Is the market size provided in terms of value or volume?
The market size is provided in terms of value, measured in Million.
11. Are there any specific market keywords associated with the report?
Yes, the market keyword associated with the report is "Tanzania Used Car Market," which aids in identifying and referencing the specific market segment covered.
12. How do I determine which pricing option suits my needs best?
The pricing options vary based on user requirements and access needs. Individual users may opt for single-user licenses, while businesses requiring broader access may choose multi-user or enterprise licenses for cost-effective access to the report.
13. Are there any additional resources or data provided in the Tanzania Used Car Market report?
While the report offers comprehensive insights, it's advisable to review the specific contents or supplementary materials provided to ascertain if additional resources or data are available.
14. How can I stay updated on further developments or reports in the Tanzania Used Car Market?
To stay informed about further developments, trends, and reports in the Tanzania Used Car Market, consider subscribing to industry newsletters, following relevant companies and organizations, or regularly checking reputable industry news sources and publications.
Methodology
Step 1 - Identification of Relevant Samples Size from Population Database


Step 2 - Approaches for Defining Global Market Size (Value, Volume* & Price*)

Note*: In applicable scenarios
Step 3 - Data Sources
Primary Research
- Web Analytics
- Survey Reports
- Research Institute
- Latest Research Reports
- Opinion Leaders
Secondary Research
- Annual Reports
- White Paper
- Latest Press Release
- Industry Association
- Paid Database
- Investor Presentations

Step 4 - Data Triangulation
Involves using different sources of information in order to increase the validity of a study
These sources are likely to be stakeholders in a program - participants, other researchers, program staff, other community members, and so on.
Then we put all data in single framework & apply various statistical tools to find out the dynamic on the market.
During the analysis stage, feedback from the stakeholder groups would be compared to determine areas of agreement as well as areas of divergence
