

Key Insights
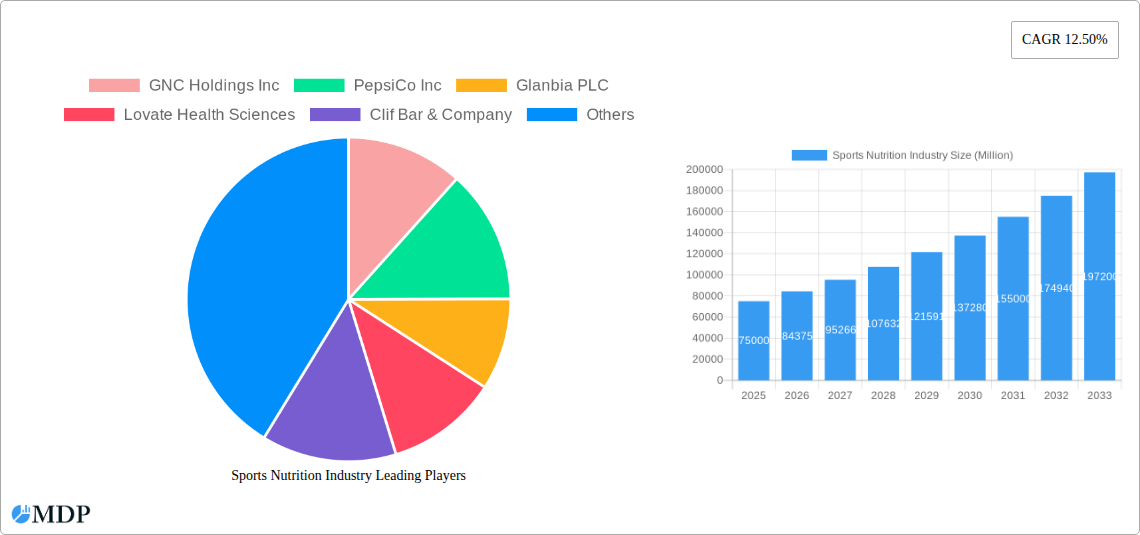
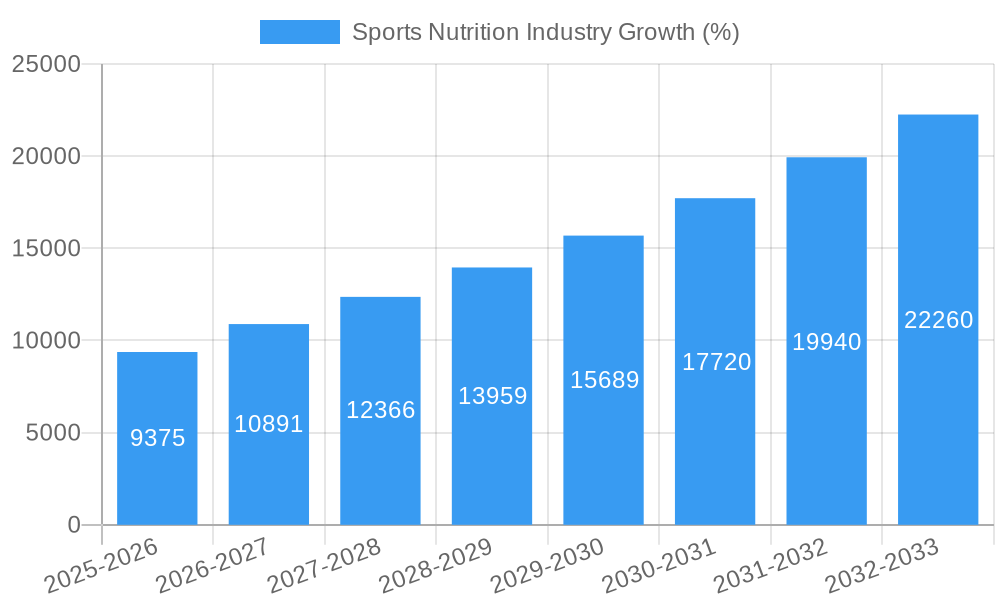
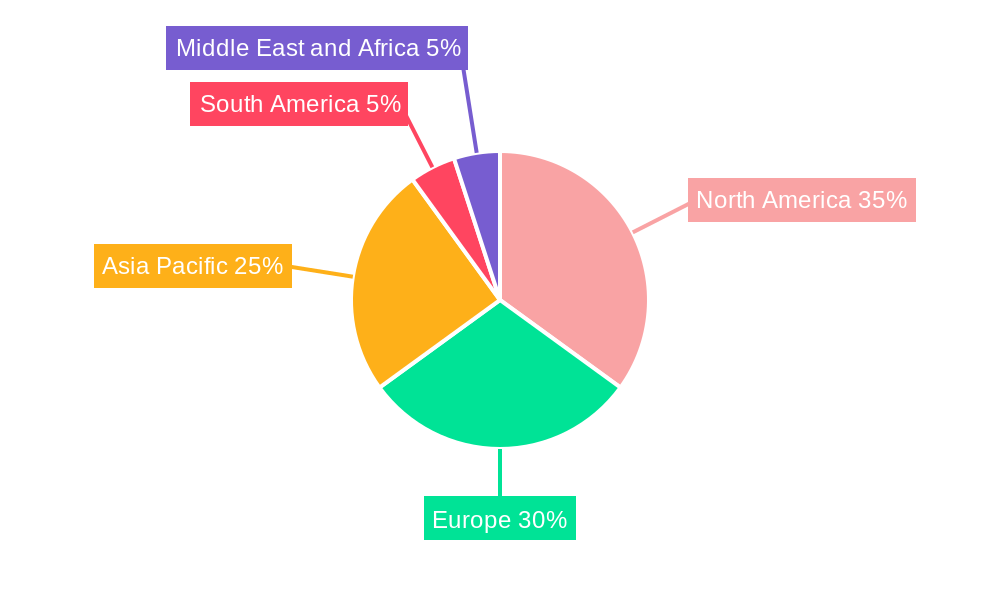
The global sports nutrition market, currently experiencing robust growth, is projected to reach a substantial size within the forecast period (2025-2033). A compound annual growth rate (CAGR) of 12.50% indicates a significant expansion driven by several key factors. The rising health consciousness among consumers, coupled with the increasing popularity of fitness activities and athletic pursuits, fuels strong demand for sports nutrition products. This includes a wide array of offerings, such as sports foods (energy bars, protein snacks), sports drinks (electrolyte beverages, performance enhancing drinks), and sports supplements (protein powders, creatine, vitamins and minerals). The convenience factor provided by online stores further contributes to the growth of this market, supplementing traditional distribution channels like supermarkets, specialty stores and convenience stores. However, market growth may be somewhat tempered by factors such as concerns regarding the safety and efficacy of certain supplements, and stringent regulatory requirements across different regions. The segmentation of the market by product type and distribution channel highlights important growth areas, allowing manufacturers to tailor product offerings and marketing strategies for optimal results. North America and Europe currently dominate the market, but the Asia-Pacific region shows considerable potential for future growth, given the rising disposable incomes and expanding fitness culture.
Competitive landscape analysis reveals key players such as GNC Holdings Inc., PepsiCo Inc., Glanbia PLC, and others actively engaged in product innovation, brand building, and strategic partnerships to increase market share. The companies focus on various aspects to stay competitive, including expanding product lines, strengthening distribution networks and marketing campaigns targeted at specific demographics. Further analysis reveals that the growth trajectory is likely to be influenced by evolving consumer preferences, technological advancements in product formulation and delivery systems, and ongoing regulatory developments. The market’s substantial growth potential, driven by these converging trends, presents attractive opportunities for existing players and new entrants alike. Understanding these dynamics is crucial for successful navigation and capitalizing on the emerging market opportunities within the sports nutrition industry.
Sports Nutrition Industry Market Report: 2019-2033
This comprehensive report provides an in-depth analysis of the global sports nutrition industry, projecting a market value exceeding $XX Million by 2033. The study covers the period 2019-2033, with 2025 as the base and estimated year. This report is essential for industry stakeholders, investors, and businesses seeking to understand market dynamics, identify growth opportunities, and make informed strategic decisions. Benefit from actionable insights based on extensive market research and data analysis.
Sports Nutrition Industry Market Dynamics & Concentration
The global sports nutrition market, valued at $XX Million in 2024, exhibits a moderately concentrated structure with several key players holding significant market share. While exact figures are proprietary to the full report, GNC Holdings Inc., PepsiCo Inc., and Glanbia PLC are among the leading companies, collectively accounting for an estimated xx% market share in 2024. Market concentration is influenced by factors including brand recognition, distribution networks, and R&D capabilities.
Innovation Drivers: The market is driven by continuous innovation in product formulations, functional ingredients (e.g., plant-based proteins, creatine), and delivery systems (e.g., ready-to-drink formats, convenient sachets).
Regulatory Frameworks: Government regulations regarding food safety, labeling, and ingredient claims significantly impact market dynamics. Variations in regulations across different regions create complexities for international players.
Product Substitutes: The industry faces competition from traditional food and beverage products, as well as alternative health and wellness solutions.
End-User Trends: Growing health consciousness, rising participation in fitness activities, and increased awareness of the benefits of sports nutrition are major growth drivers. Demand for specialized products targeting specific fitness goals (e.g., muscle building, weight management, endurance enhancement) is on the rise.
M&A Activities: The sports nutrition market has witnessed a considerable number of mergers and acquisitions (M&As) in recent years. These activities, totaling approximately xx deals in the historical period (2019-2024), reflect industry consolidation and efforts by larger players to expand their product portfolios and market reach.
Sports Nutrition Industry Industry Trends & Analysis
The sports nutrition market exhibits strong growth momentum, driven by several key factors. The compound annual growth rate (CAGR) during the forecast period (2025-2033) is projected to be xx%, exceeding the historical CAGR (2019-2024) of xx%. Market penetration is expected to increase significantly, particularly in emerging markets with growing disposable incomes and increased health awareness. Key trends include the increasing demand for personalized nutrition solutions, plant-based protein alternatives, and functional products offering specific health benefits beyond basic nutrition. Technological disruptions, such as the use of advanced analytical tools for formulation optimization and personalized recommendations, are reshaping industry dynamics. The competitive landscape is characterized by intense rivalry among established players and the emergence of innovative startups. Consumer preferences are shifting towards clean label products, sustainable sourcing, and greater transparency regarding ingredients and manufacturing processes.
Leading Markets & Segments in Sports Nutrition Industry
The North American region currently holds the largest market share within the global sports nutrition industry, driven by high consumer spending on health and wellness products, strong athletic participation rates, and a well-established distribution network. Within this, the United States represents the largest single national market. However, other regions are exhibiting robust growth, particularly Asia-Pacific, fueled by rising disposable incomes and increased health consciousness.
Key Drivers by Segment:
Type: Sports Supplements are the largest segment, followed by Sports Food and Sports Drinks. The growth of Sports Supplements is driven by the increasing demand for specialized products catering to specific fitness goals.
Distribution Channel: Online stores are experiencing rapid growth, driven by e-commerce expansion and increased convenience for consumers. Supermarkets/Hypermarkets remain the dominant distribution channel, benefiting from widespread accessibility and established distribution networks. However, specialty stores continue to play a vital role due to their expertise and personalized customer service.
Sports Nutrition Industry Product Developments
Recent years have seen significant product innovation in the sports nutrition industry. New product launches focus on improving efficacy, enhancing taste and texture, and incorporating natural and functional ingredients. Technological advancements in areas such as encapsulation and microencapsulation are enabling the development of more stable and bioavailable supplements. This results in products better suited to meet the diverse needs of various consumer groups. The market is seeing a surge in personalized nutrition solutions, leveraging technology to provide customized product recommendations and formulations.
Key Drivers of Sports Nutrition Industry Growth
Several factors contribute to the growth of the sports nutrition industry. Technological advancements in product formulation, processing, and packaging improve product quality, efficacy, and convenience. Rising disposable incomes and a growing health-conscious population, particularly in developing economies, fuel market expansion. Favorable government policies and regulations encouraging healthy lifestyles and sports participation further stimulate market growth.
Challenges in the Sports Nutrition Industry Market
The sports nutrition industry faces challenges such as stringent regulatory requirements, increasing raw material costs, and intense competition. Supply chain disruptions and fluctuations in raw material prices can affect profitability. Counterfeit products and negative publicity related to ingredient safety or efficacy can damage consumer confidence.
Emerging Opportunities in Sports Nutrition Industry
The sports nutrition market presents numerous opportunities for growth. The rising demand for personalized nutrition plans and the use of digital technologies to tailor products to individual needs provide fertile ground for innovation. Strategic partnerships between sports nutrition companies and fitness technology firms offer new avenues for product development and market expansion. Expansion into emerging markets, leveraging their growing health consciousness and rising disposable incomes, remains a significant opportunity.
Leading Players in the Sports Nutrition Industry Sector
- GNC Holdings Inc
- PepsiCo Inc
- Glanbia PLC
- Lovate Health Sciences
- Clif Bar & Company
- The Coca-Cola Company
- Abbott Laboratories Inc
- BioTech USA Kft
- Bulk Powders
Key Milestones in Sports Nutrition Industry Industry
- January 2022: Lovate Health Sciences launched "Cut," an energy drink by Hydroxycut, focusing on fat reduction.
- November 2021: Solabia-Algatech Nutrition introduced AstaPure MAX, a multi-blend supplement for muscle soreness relief.
- October 2021: Glaxon partnered with GNC through a new technological incubation program.
Strategic Outlook for Sports Nutrition Industry Market
The sports nutrition market is poised for continued robust growth, driven by sustained consumer demand for convenient, high-quality, and effective products. Strategic focus on personalized nutrition, leveraging digital technologies and data analytics, will be critical for success. Expanding into emerging markets and strategic alliances will further unlock significant growth opportunities. Companies that successfully navigate regulatory hurdles and adapt to evolving consumer preferences are best positioned to thrive in this dynamic market.
Sports Nutrition Industry Segmentation
-
1. Type
- 1.1. Sports Food
- 1.2. Sports Drinks
- 1.3. Sports Supplements
-
2. Distribution Channel
- 2.1. Supermarkets/Hypermarkets
- 2.2. Specialty Stores
- 2.3. Convenience Stores
- 2.4. Online Stores
- 2.5. Other Distribution Channels
Sports Nutrition Industry Segmentation By Geography
-
1. North America
- 1.1. United States
- 1.2. Canada
- 1.3. Mexico
- 1.4. Rest of North America
-
2. Europe
- 2.1. United Kingdom
- 2.2. Germany
- 2.3. Spain
- 2.4. France
- 2.5. Italy
- 2.6. Russia
- 2.7. Rest of Europe
-
3. Asia Pacific
- 3.1. China
- 3.2. Japan
- 3.3. India
- 3.4. Australia
- 3.5. Rest of Asia Pacific
-
4. South America
- 4.1. Brazil
- 4.2. Argentina
- 4.3. Rest of South America
-
5. Middle East and Africa
- 5.1. South Africa
- 5.2. United Arab Emirates
- 5.3. Rest of Middle East and Africa
Sports Nutrition Industry REPORT HIGHLIGHTS
| Aspects | Details |
|---|---|
| Study Period | 2019-2033 |
| Base Year | 2024 |
| Estimated Year | 2025 |
| Forecast Period | 2025-2033 |
| Historical Period | 2019-2024 |
| Growth Rate | CAGR of 12.50% from 2019-2033 |
| Segmentation |
|
Table of Contents
- 1. Introduction
- 1.1. Research Scope
- 1.2. Market Segmentation
- 1.3. Research Methodology
- 1.4. Definitions and Assumptions
- 2. Executive Summary
- 2.1. Introduction
- 3. Market Dynamics
- 3.1. Introduction
- 3.2. Market Drivers
- 3.2.1. Increasing inclination towards fitness and sports participation; Increasing demand for fortified processed food products
- 3.3. Market Restrains
- 3.3.1. Extensive presence of alternative protein products sourced from plant based ingredients
- 3.4. Market Trends
- 3.4.1. Rising Consumer Engagements in Fitness Clubs
- 4. Market Factor Analysis
- 4.1. Porters Five Forces
- 4.2. Supply/Value Chain
- 4.3. PESTEL analysis
- 4.4. Market Entropy
- 4.5. Patent/Trademark Analysis
- 5. Global Sports Nutrition Industry Analysis, Insights and Forecast, 2019-2031
- 5.1. Market Analysis, Insights and Forecast - by Type
- 5.1.1. Sports Food
- 5.1.2. Sports Drinks
- 5.1.3. Sports Supplements
- 5.2. Market Analysis, Insights and Forecast - by Distribution Channel
- 5.2.1. Supermarkets/Hypermarkets
- 5.2.2. Specialty Stores
- 5.2.3. Convenience Stores
- 5.2.4. Online Stores
- 5.2.5. Other Distribution Channels
- 5.3. Market Analysis, Insights and Forecast - by Region
- 5.3.1. North America
- 5.3.2. Europe
- 5.3.3. Asia Pacific
- 5.3.4. South America
- 5.3.5. Middle East and Africa
- 5.1. Market Analysis, Insights and Forecast - by Type
- 6. North America Sports Nutrition Industry Analysis, Insights and Forecast, 2019-2031
- 6.1. Market Analysis, Insights and Forecast - by Type
- 6.1.1. Sports Food
- 6.1.2. Sports Drinks
- 6.1.3. Sports Supplements
- 6.2. Market Analysis, Insights and Forecast - by Distribution Channel
- 6.2.1. Supermarkets/Hypermarkets
- 6.2.2. Specialty Stores
- 6.2.3. Convenience Stores
- 6.2.4. Online Stores
- 6.2.5. Other Distribution Channels
- 6.1. Market Analysis, Insights and Forecast - by Type
- 7. Europe Sports Nutrition Industry Analysis, Insights and Forecast, 2019-2031
- 7.1. Market Analysis, Insights and Forecast - by Type
- 7.1.1. Sports Food
- 7.1.2. Sports Drinks
- 7.1.3. Sports Supplements
- 7.2. Market Analysis, Insights and Forecast - by Distribution Channel
- 7.2.1. Supermarkets/Hypermarkets
- 7.2.2. Specialty Stores
- 7.2.3. Convenience Stores
- 7.2.4. Online Stores
- 7.2.5. Other Distribution Channels
- 7.1. Market Analysis, Insights and Forecast - by Type
- 8. Asia Pacific Sports Nutrition Industry Analysis, Insights and Forecast, 2019-2031
- 8.1. Market Analysis, Insights and Forecast - by Type
- 8.1.1. Sports Food
- 8.1.2. Sports Drinks
- 8.1.3. Sports Supplements
- 8.2. Market Analysis, Insights and Forecast - by Distribution Channel
- 8.2.1. Supermarkets/Hypermarkets
- 8.2.2. Specialty Stores
- 8.2.3. Convenience Stores
- 8.2.4. Online Stores
- 8.2.5. Other Distribution Channels
- 8.1. Market Analysis, Insights and Forecast - by Type
- 9. South America Sports Nutrition Industry Analysis, Insights and Forecast, 2019-2031
- 9.1. Market Analysis, Insights and Forecast - by Type
- 9.1.1. Sports Food
- 9.1.2. Sports Drinks
- 9.1.3. Sports Supplements
- 9.2. Market Analysis, Insights and Forecast - by Distribution Channel
- 9.2.1. Supermarkets/Hypermarkets
- 9.2.2. Specialty Stores
- 9.2.3. Convenience Stores
- 9.2.4. Online Stores
- 9.2.5. Other Distribution Channels
- 9.1. Market Analysis, Insights and Forecast - by Type
- 10. Middle East and Africa Sports Nutrition Industry Analysis, Insights and Forecast, 2019-2031
- 10.1. Market Analysis, Insights and Forecast - by Type
- 10.1.1. Sports Food
- 10.1.2. Sports Drinks
- 10.1.3. Sports Supplements
- 10.2. Market Analysis, Insights and Forecast - by Distribution Channel
- 10.2.1. Supermarkets/Hypermarkets
- 10.2.2. Specialty Stores
- 10.2.3. Convenience Stores
- 10.2.4. Online Stores
- 10.2.5. Other Distribution Channels
- 10.1. Market Analysis, Insights and Forecast - by Type
- 11. North America Sports Nutrition Industry Analysis, Insights and Forecast, 2019-2031
- 11.1. Market Analysis, Insights and Forecast - By Country/Sub-region
- 11.1.1 United States
- 11.1.2 Canada
- 11.1.3 Mexico
- 11.1.4 Rest of North America
- 12. Europe Sports Nutrition Industry Analysis, Insights and Forecast, 2019-2031
- 12.1. Market Analysis, Insights and Forecast - By Country/Sub-region
- 12.1.1 United Kingdom
- 12.1.2 Germany
- 12.1.3 Spain
- 12.1.4 France
- 12.1.5 Italy
- 12.1.6 Russia
- 12.1.7 Rest of Europe
- 13. Asia Pacific Sports Nutrition Industry Analysis, Insights and Forecast, 2019-2031
- 13.1. Market Analysis, Insights and Forecast - By Country/Sub-region
- 13.1.1 China
- 13.1.2 Japan
- 13.1.3 India
- 13.1.4 Australia
- 13.1.5 Rest of Asia Pacific
- 14. South America Sports Nutrition Industry Analysis, Insights and Forecast, 2019-2031
- 14.1. Market Analysis, Insights and Forecast - By Country/Sub-region
- 14.1.1 Brazil
- 14.1.2 Argentina
- 14.1.3 Rest of South America
- 15. Middle East and Africa Sports Nutrition Industry Analysis, Insights and Forecast, 2019-2031
- 15.1. Market Analysis, Insights and Forecast - By Country/Sub-region
- 15.1.1 South Africa
- 15.1.2 United Arab Emirates
- 15.1.3 Rest of Middle East and Africa
- 16. Competitive Analysis
- 16.1. Global Market Share Analysis 2024
- 16.2. Company Profiles
- 16.2.1 GNC Holdings Inc
- 16.2.1.1. Overview
- 16.2.1.2. Products
- 16.2.1.3. SWOT Analysis
- 16.2.1.4. Recent Developments
- 16.2.1.5. Financials (Based on Availability)
- 16.2.2 PepsiCo Inc
- 16.2.2.1. Overview
- 16.2.2.2. Products
- 16.2.2.3. SWOT Analysis
- 16.2.2.4. Recent Developments
- 16.2.2.5. Financials (Based on Availability)
- 16.2.3 Glanbia PLC
- 16.2.3.1. Overview
- 16.2.3.2. Products
- 16.2.3.3. SWOT Analysis
- 16.2.3.4. Recent Developments
- 16.2.3.5. Financials (Based on Availability)
- 16.2.4 Lovate Health Sciences
- 16.2.4.1. Overview
- 16.2.4.2. Products
- 16.2.4.3. SWOT Analysis
- 16.2.4.4. Recent Developments
- 16.2.4.5. Financials (Based on Availability)
- 16.2.5 Clif Bar & Company
- 16.2.5.1. Overview
- 16.2.5.2. Products
- 16.2.5.3. SWOT Analysis
- 16.2.5.4. Recent Developments
- 16.2.5.5. Financials (Based on Availability)
- 16.2.6 The Coca-Cola Company
- 16.2.6.1. Overview
- 16.2.6.2. Products
- 16.2.6.3. SWOT Analysis
- 16.2.6.4. Recent Developments
- 16.2.6.5. Financials (Based on Availability)
- 16.2.7 Abbott Laboratories Inc
- 16.2.7.1. Overview
- 16.2.7.2. Products
- 16.2.7.3. SWOT Analysis
- 16.2.7.4. Recent Developments
- 16.2.7.5. Financials (Based on Availability)
- 16.2.8 BioTech USA Kft *List Not Exhaustive
- 16.2.8.1. Overview
- 16.2.8.2. Products
- 16.2.8.3. SWOT Analysis
- 16.2.8.4. Recent Developments
- 16.2.8.5. Financials (Based on Availability)
- 16.2.9 Bulk Powders
- 16.2.9.1. Overview
- 16.2.9.2. Products
- 16.2.9.3. SWOT Analysis
- 16.2.9.4. Recent Developments
- 16.2.9.5. Financials (Based on Availability)
- 16.2.1 GNC Holdings Inc
List of Figures
- Figure 1: Global Sports Nutrition Industry Revenue Breakdown (Million, %) by Region 2024 & 2032
- Figure 2: North America Sports Nutrition Industry Revenue (Million), by Country 2024 & 2032
- Figure 3: North America Sports Nutrition Industry Revenue Share (%), by Country 2024 & 2032
- Figure 4: Europe Sports Nutrition Industry Revenue (Million), by Country 2024 & 2032
- Figure 5: Europe Sports Nutrition Industry Revenue Share (%), by Country 2024 & 2032
- Figure 6: Asia Pacific Sports Nutrition Industry Revenue (Million), by Country 2024 & 2032
- Figure 7: Asia Pacific Sports Nutrition Industry Revenue Share (%), by Country 2024 & 2032
- Figure 8: South America Sports Nutrition Industry Revenue (Million), by Country 2024 & 2032
- Figure 9: South America Sports Nutrition Industry Revenue Share (%), by Country 2024 & 2032
- Figure 10: Middle East and Africa Sports Nutrition Industry Revenue (Million), by Country 2024 & 2032
- Figure 11: Middle East and Africa Sports Nutrition Industry Revenue Share (%), by Country 2024 & 2032
- Figure 12: North America Sports Nutrition Industry Revenue (Million), by Type 2024 & 2032
- Figure 13: North America Sports Nutrition Industry Revenue Share (%), by Type 2024 & 2032
- Figure 14: North America Sports Nutrition Industry Revenue (Million), by Distribution Channel 2024 & 2032
- Figure 15: North America Sports Nutrition Industry Revenue Share (%), by Distribution Channel 2024 & 2032
- Figure 16: North America Sports Nutrition Industry Revenue (Million), by Country 2024 & 2032
- Figure 17: North America Sports Nutrition Industry Revenue Share (%), by Country 2024 & 2032
- Figure 18: Europe Sports Nutrition Industry Revenue (Million), by Type 2024 & 2032
- Figure 19: Europe Sports Nutrition Industry Revenue Share (%), by Type 2024 & 2032
- Figure 20: Europe Sports Nutrition Industry Revenue (Million), by Distribution Channel 2024 & 2032
- Figure 21: Europe Sports Nutrition Industry Revenue Share (%), by Distribution Channel 2024 & 2032
- Figure 22: Europe Sports Nutrition Industry Revenue (Million), by Country 2024 & 2032
- Figure 23: Europe Sports Nutrition Industry Revenue Share (%), by Country 2024 & 2032
- Figure 24: Asia Pacific Sports Nutrition Industry Revenue (Million), by Type 2024 & 2032
- Figure 25: Asia Pacific Sports Nutrition Industry Revenue Share (%), by Type 2024 & 2032
- Figure 26: Asia Pacific Sports Nutrition Industry Revenue (Million), by Distribution Channel 2024 & 2032
- Figure 27: Asia Pacific Sports Nutrition Industry Revenue Share (%), by Distribution Channel 2024 & 2032
- Figure 28: Asia Pacific Sports Nutrition Industry Revenue (Million), by Country 2024 & 2032
- Figure 29: Asia Pacific Sports Nutrition Industry Revenue Share (%), by Country 2024 & 2032
- Figure 30: South America Sports Nutrition Industry Revenue (Million), by Type 2024 & 2032
- Figure 31: South America Sports Nutrition Industry Revenue Share (%), by Type 2024 & 2032
- Figure 32: South America Sports Nutrition Industry Revenue (Million), by Distribution Channel 2024 & 2032
- Figure 33: South America Sports Nutrition Industry Revenue Share (%), by Distribution Channel 2024 & 2032
- Figure 34: South America Sports Nutrition Industry Revenue (Million), by Country 2024 & 2032
- Figure 35: South America Sports Nutrition Industry Revenue Share (%), by Country 2024 & 2032
- Figure 36: Middle East and Africa Sports Nutrition Industry Revenue (Million), by Type 2024 & 2032
- Figure 37: Middle East and Africa Sports Nutrition Industry Revenue Share (%), by Type 2024 & 2032
- Figure 38: Middle East and Africa Sports Nutrition Industry Revenue (Million), by Distribution Channel 2024 & 2032
- Figure 39: Middle East and Africa Sports Nutrition Industry Revenue Share (%), by Distribution Channel 2024 & 2032
- Figure 40: Middle East and Africa Sports Nutrition Industry Revenue (Million), by Country 2024 & 2032
- Figure 41: Middle East and Africa Sports Nutrition Industry Revenue Share (%), by Country 2024 & 2032
List of Tables
- Table 1: Global Sports Nutrition Industry Revenue Million Forecast, by Region 2019 & 2032
- Table 2: Global Sports Nutrition Industry Revenue Million Forecast, by Type 2019 & 2032
- Table 3: Global Sports Nutrition Industry Revenue Million Forecast, by Distribution Channel 2019 & 2032
- Table 4: Global Sports Nutrition Industry Revenue Million Forecast, by Region 2019 & 2032
- Table 5: Global Sports Nutrition Industry Revenue Million Forecast, by Country 2019 & 2032
- Table 6: United States Sports Nutrition Industry Revenue (Million) Forecast, by Application 2019 & 2032
- Table 7: Canada Sports Nutrition Industry Revenue (Million) Forecast, by Application 2019 & 2032
- Table 8: Mexico Sports Nutrition Industry Revenue (Million) Forecast, by Application 2019 & 2032
- Table 9: Rest of North America Sports Nutrition Industry Revenue (Million) Forecast, by Application 2019 & 2032
- Table 10: Global Sports Nutrition Industry Revenue Million Forecast, by Country 2019 & 2032
- Table 11: United Kingdom Sports Nutrition Industry Revenue (Million) Forecast, by Application 2019 & 2032
- Table 12: Germany Sports Nutrition Industry Revenue (Million) Forecast, by Application 2019 & 2032
- Table 13: Spain Sports Nutrition Industry Revenue (Million) Forecast, by Application 2019 & 2032
- Table 14: France Sports Nutrition Industry Revenue (Million) Forecast, by Application 2019 & 2032
- Table 15: Italy Sports Nutrition Industry Revenue (Million) Forecast, by Application 2019 & 2032
- Table 16: Russia Sports Nutrition Industry Revenue (Million) Forecast, by Application 2019 & 2032
- Table 17: Rest of Europe Sports Nutrition Industry Revenue (Million) Forecast, by Application 2019 & 2032
- Table 18: Global Sports Nutrition Industry Revenue Million Forecast, by Country 2019 & 2032
- Table 19: China Sports Nutrition Industry Revenue (Million) Forecast, by Application 2019 & 2032
- Table 20: Japan Sports Nutrition Industry Revenue (Million) Forecast, by Application 2019 & 2032
- Table 21: India Sports Nutrition Industry Revenue (Million) Forecast, by Application 2019 & 2032
- Table 22: Australia Sports Nutrition Industry Revenue (Million) Forecast, by Application 2019 & 2032
- Table 23: Rest of Asia Pacific Sports Nutrition Industry Revenue (Million) Forecast, by Application 2019 & 2032
- Table 24: Global Sports Nutrition Industry Revenue Million Forecast, by Country 2019 & 2032
- Table 25: Brazil Sports Nutrition Industry Revenue (Million) Forecast, by Application 2019 & 2032
- Table 26: Argentina Sports Nutrition Industry Revenue (Million) Forecast, by Application 2019 & 2032
- Table 27: Rest of South America Sports Nutrition Industry Revenue (Million) Forecast, by Application 2019 & 2032
- Table 28: Global Sports Nutrition Industry Revenue Million Forecast, by Country 2019 & 2032
- Table 29: South Africa Sports Nutrition Industry Revenue (Million) Forecast, by Application 2019 & 2032
- Table 30: United Arab Emirates Sports Nutrition Industry Revenue (Million) Forecast, by Application 2019 & 2032
- Table 31: Rest of Middle East and Africa Sports Nutrition Industry Revenue (Million) Forecast, by Application 2019 & 2032
- Table 32: Global Sports Nutrition Industry Revenue Million Forecast, by Type 2019 & 2032
- Table 33: Global Sports Nutrition Industry Revenue Million Forecast, by Distribution Channel 2019 & 2032
- Table 34: Global Sports Nutrition Industry Revenue Million Forecast, by Country 2019 & 2032
- Table 35: United States Sports Nutrition Industry Revenue (Million) Forecast, by Application 2019 & 2032
- Table 36: Canada Sports Nutrition Industry Revenue (Million) Forecast, by Application 2019 & 2032
- Table 37: Mexico Sports Nutrition Industry Revenue (Million) Forecast, by Application 2019 & 2032
- Table 38: Rest of North America Sports Nutrition Industry Revenue (Million) Forecast, by Application 2019 & 2032
- Table 39: Global Sports Nutrition Industry Revenue Million Forecast, by Type 2019 & 2032
- Table 40: Global Sports Nutrition Industry Revenue Million Forecast, by Distribution Channel 2019 & 2032
- Table 41: Global Sports Nutrition Industry Revenue Million Forecast, by Country 2019 & 2032
- Table 42: United Kingdom Sports Nutrition Industry Revenue (Million) Forecast, by Application 2019 & 2032
- Table 43: Germany Sports Nutrition Industry Revenue (Million) Forecast, by Application 2019 & 2032
- Table 44: Spain Sports Nutrition Industry Revenue (Million) Forecast, by Application 2019 & 2032
- Table 45: France Sports Nutrition Industry Revenue (Million) Forecast, by Application 2019 & 2032
- Table 46: Italy Sports Nutrition Industry Revenue (Million) Forecast, by Application 2019 & 2032
- Table 47: Russia Sports Nutrition Industry Revenue (Million) Forecast, by Application 2019 & 2032
- Table 48: Rest of Europe Sports Nutrition Industry Revenue (Million) Forecast, by Application 2019 & 2032
- Table 49: Global Sports Nutrition Industry Revenue Million Forecast, by Type 2019 & 2032
- Table 50: Global Sports Nutrition Industry Revenue Million Forecast, by Distribution Channel 2019 & 2032
- Table 51: Global Sports Nutrition Industry Revenue Million Forecast, by Country 2019 & 2032
- Table 52: China Sports Nutrition Industry Revenue (Million) Forecast, by Application 2019 & 2032
- Table 53: Japan Sports Nutrition Industry Revenue (Million) Forecast, by Application 2019 & 2032
- Table 54: India Sports Nutrition Industry Revenue (Million) Forecast, by Application 2019 & 2032
- Table 55: Australia Sports Nutrition Industry Revenue (Million) Forecast, by Application 2019 & 2032
- Table 56: Rest of Asia Pacific Sports Nutrition Industry Revenue (Million) Forecast, by Application 2019 & 2032
- Table 57: Global Sports Nutrition Industry Revenue Million Forecast, by Type 2019 & 2032
- Table 58: Global Sports Nutrition Industry Revenue Million Forecast, by Distribution Channel 2019 & 2032
- Table 59: Global Sports Nutrition Industry Revenue Million Forecast, by Country 2019 & 2032
- Table 60: Brazil Sports Nutrition Industry Revenue (Million) Forecast, by Application 2019 & 2032
- Table 61: Argentina Sports Nutrition Industry Revenue (Million) Forecast, by Application 2019 & 2032
- Table 62: Rest of South America Sports Nutrition Industry Revenue (Million) Forecast, by Application 2019 & 2032
- Table 63: Global Sports Nutrition Industry Revenue Million Forecast, by Type 2019 & 2032
- Table 64: Global Sports Nutrition Industry Revenue Million Forecast, by Distribution Channel 2019 & 2032
- Table 65: Global Sports Nutrition Industry Revenue Million Forecast, by Country 2019 & 2032
- Table 66: South Africa Sports Nutrition Industry Revenue (Million) Forecast, by Application 2019 & 2032
- Table 67: United Arab Emirates Sports Nutrition Industry Revenue (Million) Forecast, by Application 2019 & 2032
- Table 68: Rest of Middle East and Africa Sports Nutrition Industry Revenue (Million) Forecast, by Application 2019 & 2032
Frequently Asked Questions
1. What is the projected Compound Annual Growth Rate (CAGR) of the Sports Nutrition Industry?
The projected CAGR is approximately 12.50%.
2. Which companies are prominent players in the Sports Nutrition Industry?
Key companies in the market include GNC Holdings Inc, PepsiCo Inc, Glanbia PLC, Lovate Health Sciences, Clif Bar & Company, The Coca-Cola Company, Abbott Laboratories Inc, BioTech USA Kft *List Not Exhaustive, Bulk Powders.
3. What are the main segments of the Sports Nutrition Industry?
The market segments include Type, Distribution Channel.
4. Can you provide details about the market size?
The market size is estimated to be USD XX Million as of 2022.
5. What are some drivers contributing to market growth?
Increasing inclination towards fitness and sports participation; Increasing demand for fortified processed food products.
6. What are the notable trends driving market growth?
Rising Consumer Engagements in Fitness Clubs.
7. Are there any restraints impacting market growth?
Extensive presence of alternative protein products sourced from plant based ingredients.
8. Can you provide examples of recent developments in the market?
In January 2022, Hydroxycut a sports nutrition brand under its parent company, Lovate Health Scie, launched "Cut", an energy drink that will help consumers to reduce their body fat percentage.
9. What pricing options are available for accessing the report?
Pricing options include single-user, multi-user, and enterprise licenses priced at USD 4750, USD 5250, and USD 8750 respectively.
10. Is the market size provided in terms of value or volume?
The market size is provided in terms of value, measured in Million.
11. Are there any specific market keywords associated with the report?
Yes, the market keyword associated with the report is "Sports Nutrition Industry," which aids in identifying and referencing the specific market segment covered.
12. How do I determine which pricing option suits my needs best?
The pricing options vary based on user requirements and access needs. Individual users may opt for single-user licenses, while businesses requiring broader access may choose multi-user or enterprise licenses for cost-effective access to the report.
13. Are there any additional resources or data provided in the Sports Nutrition Industry report?
While the report offers comprehensive insights, it's advisable to review the specific contents or supplementary materials provided to ascertain if additional resources or data are available.
14. How can I stay updated on further developments or reports in the Sports Nutrition Industry?
To stay informed about further developments, trends, and reports in the Sports Nutrition Industry, consider subscribing to industry newsletters, following relevant companies and organizations, or regularly checking reputable industry news sources and publications.
Methodology
Step 1 - Identification of Relevant Samples Size from Population Database


Step 2 - Approaches for Defining Global Market Size (Value, Volume* & Price*)

Note*: In applicable scenarios
Step 3 - Data Sources
Primary Research
- Web Analytics
- Survey Reports
- Research Institute
- Latest Research Reports
- Opinion Leaders
Secondary Research
- Annual Reports
- White Paper
- Latest Press Release
- Industry Association
- Paid Database
- Investor Presentations

Step 4 - Data Triangulation
Involves using different sources of information in order to increase the validity of a study
These sources are likely to be stakeholders in a program - participants, other researchers, program staff, other community members, and so on.
Then we put all data in single framework & apply various statistical tools to find out the dynamic on the market.
During the analysis stage, feedback from the stakeholder groups would be compared to determine areas of agreement as well as areas of divergence
